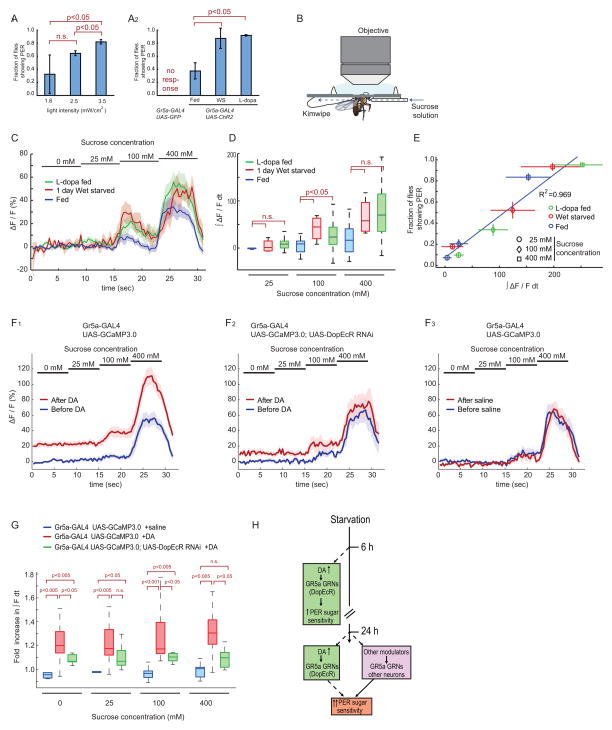
Figure 6. Starvation or L-dopa feeding enhance calcium transients in sugar sensing GRNs.
(A) Channelrhodopsin-2-evoked PER. Gr5a-GAL4;UAS-ChR2 or Gr5a-GAL4;UAS-GFP control flies were stimulated with blue (470/40 nm: centerwavelength/bandwidth) light at the indicated intensities (A1) or at 1.6 mW/cm2 under the indicated conditions (A2).
(B) The setup for calcium imaging of sugar-sensing GRNs. Blue dashed arrow indicates direction of flow of sugar solution.
(C) Responses (ΔF/F) to different concentrations of sucrose in the central projections of sugar-sensing GRNs in Gr5a-GAL4;UAS-GCaMP3.0 flies. The solid lines represent average trace, and envelopes indicate SEM (n>7 for each condition).
(D) Quantification of fluorescent changes. ∫ ΔF/F dt, integrated ΔF/F during stimulus period. Data analyzed from (C). Mann-Whitney U-tests with Bonferroni correction.
(E) Correlation between GCaMP signals (analyzed in B, C) and behavioral responses (PER) of Gr5a-GAL4;UAS-GCaMP3.0 flies (n>4). Error bars represent SEM.
(F) Responses (ΔF/F) to different concentrations of sucrose in the central projections of sugar-sensing GRNs before and after 5 min exposure of the brain to saline with or without 1mM DA. The solid lines represent average trace, and envelopes indicate SEM (n>7 for each condition).
(G) Fold increase in ∫ F dt (∫ F dt[After DA]/∫ F dt[Before DA]) during each stimulus period, calculated from the data in (F). Mann-Whitney U-tests with Bonferroni correction.
(H) Schematic illustrating mechanisms controlling starvation-induced increases in the sugar sensitivity of PER behavior.

