

Abstract
The redox potentials of the hemes of the mitochondrial bc1 complex are dependent on the proton-motive force due to the energy transduction. This allows the membrane potential and pH gradient components to be calculated from the oxidation state of the hemes measured with multi-wavelength cell spectroscopy. Oxidation states were measured in living RAW 264.7 cells under varying electron flux and membrane potential obtained by a combination of oligomycin and titration with a proton ionophore. A stochastic model of bc1 turnover was used to confirm that the membrane potential and redox potential of the ubiquinone pool could be measured from the redox poise of the b-hemes under physiological conditions assuming the redox couples are in equilibrium. The pH gradient was then calculated from the difference in redox potentials of cytochrome c and ubiquinone pool using the stochastic model to evaluate the ΔG of the bc1 complex. The technique allows absolute quantification of the membrane potential, pH gradient, and proton-motive force without the need for genetic manipulation or exogenous compounds.
Introduction
The bc1 complex (EC 1.10.2.2) of the mitochondrial electron transport chain transfers electrons from membrane-bound ubiquinol (UQH2) to intermembrane cytochrome c (Cytc). It catalyzes the net reaction, Reaction 1,
where UQ is ubiquinone, and HN+ and HP+ refer to protons on the N-side (matrix) and P-side (cytosol) of the membrane, respectively. It operates via the modified Q-cycle (1) in which the two electrons released by ubiquinol oxidation at the Qo center close to the P-side of the membrane are bifurcated so that one electron is passed along a high potential chain to reduce Cytc, and the other is passed along a low potential chain to reduce ubiquinone at the Qi center that is located close to the N-side of the membrane (see Fig. 1). The high potential chain consists of an iron-sulfur (Rieske) center and the c1 heme that is close to the Cytc docking site. The low potential chain consists of the bL heme close to the Qo center and the bH heme close to the Qi center. The resulting charge and proton separation results in energy transduction into the proton-motive force (ΔP) that consists of a membrane potential (ΔΨ) component and proton concentration gradient (ΔH+, equivalent to Mitchell's −ZΔpH, the pH gradient expressed in millivolts (2), where Z = Ln(10)RT/F). Energy transduction into ΔΨ occurs through movement of the electrons between the Qo and Qi centers, release of the ubiquinol protons at the Qo center to the P-side of the membrane and uptake of protons from the N-side of the membrane to reduce ubiquinone at the Qi center. Energy transduction into ΔH+ occurs through uptake and release of protons to and from the Qi and Qo centers, respectively. A result of the energy transduction is that the relative redox potentials of the redox centers are dependent on ΔΨ and ΔH+ (Fig. 1). This raises the possibility that ΔΨ and ΔH+ could be quantified from the oxidation state of the hemes of the bc1 complex measured with multi-wavelength cell spectroscopy. Methods to measure ΔΨ in cells use cationic fluorescent dyes that accumulate in the matrix according to the Nernst equation (3). They are nonquantitative (but see Nicholls (4)), nonlinear, and subject to multiple confounding factors. Measurement of matrix and intermembrane space pH in cells requires transfection with targeted pH-sensitive fluorescent proteins (5,6) that require in situ intensity calibration. In contrast, measuring ΔΨ and ΔH+ from the bc1 complex would enable studies of quantitative cellular bioenergetics without the need for genetic manipulation or exogenous compounds.
Figure 1.

Cartoon of the bc1 complex showing the relative position in the membrane of the redox centers (bL, bH, c1, Rieske), the ubiquinone binding centers (Qo, Qi), the bound Cyt, and the high and low potential chain electron pathways.
The b-hemes are separated in the membrane so that the Gibbs free energy change for electron transfer from bL to bH, , expressed in millivolts, is given by
| (1) |
where and are the redox potentials of bH and bL, respectively, β is the fraction of the dielectric distance of the insulating phase between the hemes, and ΔΨ is membrane potential. The first term on the right is the energy released on transfer of an electron between redox couples and the second term is the work done against the proton-motive force. The dielectric distance can be approximated by the physical separation of the hemes perpendicular to the membrane expressed as a fraction of the membrane thickness. A disequilibrium, defined as the deviation in ΔG from equilibrium (that is, −ΔG), must be present for a net forward flux but the close proximity of the b-hemes leads to a rapid and reversible interheme electron transfer rate and ensures they should remain in close redox equilibrium. In this case, the free energy change can be approximated as zero and ΔΨ to be calculated from the redox potentials of the b-hemes that, in turn, can be calculated from their measured oxidation state.
The Gibbs free energy change for electron transfer from bH to the ubiquinone/ubiquinol pool in the membrane through the Qi center, , expressed in millivolts per electron transferred, is given by
| (2) |
where is the redox potential of the membrane-bound ubiquinone pool with respect to matrix pH and γ is the dielectric depth in the insulating phase of bH with respect to the matrix. A total of one charge is moved from bH to the matrix against ΔΨ because an electron moves from bH to Qi and half of two protons move from the matrix to Qi. Note that the matrix proton concentration does not appear in Eq. 2 because the protons taken up are substrate protons of the UQ/UQH2 redox couple and the redox potential of this couple is dependent on the proton concentration in the matrix. Assuming equilibrium, this allows to be calculated from the redox potential of bH, which can be calculated from its measured oxidation state, and ΔΨ calculated from Eq. 1.
The Gibbs free energy of the overall reaction of the bc1 complex (see Reaction 1, above), expressed in mV per electron transferred from the ubiquinol/ubiquinone pool in the membrane to Cytc in the intermembrane space, is derived in the Supporting Material and given by
| (3) |
where is the redox potential of the Cytc pool in the intermembrane space. The term in brackets on the right is the energy released when an electron is moved from the UQ pool to the Cytc pool. This allows ΔH+ to be calculated from the redox potential of Cytc (which can be calculated from the measured oxidation state of Cytc, the redox potential of the ubiquinone pool, as calculated from Eq. 2; the membrane potential, as calculated from Eq. 1; and the disequilibrium of the bc1 complex). Although the bc1 complex is reversible and works close to equilibrium (7), direct measurements in isolated mitochondria have shown that the disequilibrium is substantial compared to ΔH+ at high electron flux (8) so that a nonequilibrium model of turnover must be employed to evaluate the extent of the disequilibrium.
Multi-wavelength cell spectroscopy is an emerging technology to measure oxidation changes of the hemes of the electron transport chain from living cells in suspension (9). It uses a linear-combination-of-model-spectra algorithm to calculate the change in oxidation of the hemes from the change in attenuation spectrum. Being an absorption spectroscopy technique, it is strictly quantitative as long as the differential pathlength is known. Although it only measures oxidation changes from baseline, the oxidation states can be back-calculated once the hemes have been fully reduced under anoxic conditions and fully oxidized with an upstream inhibitor (10). The goal of this article is to determine whether ΔΨ and ΔP can be quantified in RAW 264.7 cells from the redox poise of the hemes of bc1 complex under normal physiological conditions and over the dynamic range of electron flux. First, we measure heme oxidation states and bc1 turnover under baseline conditions and in the physiological range of turnover and membrane potential obtained with a combination of the ATP synthase inhibitor (oligomycin) and proton ionophore (carbonyl cyanide 3-chlorophenylhydrazone, CCCP). We then use a stochastic model of the bc1 turnover to show that a simple analytical equilibrium model based on Eqs. 1 and 2 can be used to calculate ΔΨ and from the oxidation state of bH and bL with good accuracy under these conditions. Finally, we use the stochastic model to estimate the disequilibrium necessary to achieve the measured turnover for the measured value of and derived values of and ΔΨ so that ΔH+ can be estimated from Eq. 3 and ΔP calculated.
Materials and Methods
Cell culture
RAW 264.7 mouse macrophage cells were cultured at 37°C in spinner flasks in phenol-red free RPMI medium containing antibiotics/antimycotics and 10% fetal bovine serum in a 95% air and 5% CO2 incubator. Cells were spun down at 500g for 5 min and then resuspended at a density of 2.0 × 10⁷ cells/mL in RPMI medium and placed in a custom-built 6 mL chamber that consisted of a 17-mm inside-diameter quartz tube surrounded by a water jacket to maintain the cells at 37°C. The oxygen concentration within the chamber was measured from the fluorescence lifetime of a phosphorescent membrane located at the bottom of the chamber and the top of the chamber was sealed with a stainless-steel plunger. The stir bar was made of glass rather than Teflon (DuPont, Wilmington, DE) and all the seals were made of Viton (DuPont) in accordance with good respirometry practice (11). The chamber could be used in either respirometry or oximetry mode. In respirometry mode, the chamber was sealed and the cellular oxygen consumption measured from the rate of depletion of oxygen. In oximetry mode, the cells were oxygenated and deoxygenated under computer control by exchange of oxygen across 90 mm of narrow-bore silicone tubing immersed in the cell suspension. The tubing always contained 5% CO2 to maintain intracellular pH.
Spectroscopy and spectral analysis
Heme attenuation spectra and NADH fluorescence spectra were measured with two separate charge-coupled device spectrograph systems working in time-multiplexed mode at 50 Hz using a 6-ms-on, 4-ms-off duty cycle. Contiguous spectra were averaged to give a temporal resolution of 0.5 s. A warm white-light-emitting diode was used for the attenuation spectra illumination that was mounted 10 mm below a bundle of three NA0.37 1-mm optical fibers. One fiber was used for attenuation spectra detection, one for fluorescence spectra detection, and one was coupled to a 365 nm ultraviolet light-emitting diode for fluorescence excitation. The two detection fibers were F-matched onto the slits of two 0.3-mm spectrographs (Triax 320; Horiba, Edison, NJ), each equipped with a 1024 × 128 pixel back-thinned charge-coupled device camera (DV401BV; Andor Technology, South Windsor, CT). The fluorescence data are not reported here. The attenuation spectrograph was equipped with a 600 g/mm grating blazed at 500 nm that provided complete spectra between 508 and 640 nm with a pixel bandpass of 0.16 nm. The slits were set to give a spectral resolution of 1 nm. The spectral analysis and calculation of oxidation states are described in the Supporting Material and in previous reports (10,12).
Redox potentials
The redox potential of Cytc, , was calculated from the oxidation state using the n = 1 Nernst equation assuming a midpoint potential of 260 mV. The redox potential of c1, , was calculated likewise using a midpoint potential of 240 mV.
The redox potential of the ubiquinone pool with respect to the matrix pH is given by
| (4) |
where is the midpoint potential of the ubiquinone/ubiquinol pool in the membrane at pH 7.0; R is the gas constant; T is absolute temperature (310 K at 37°C); F is the Faraday constant; [Hm+] is the proton concentration of the matrix; and [H7+] is the proton concentration at pH 7.0 (0.1 μM). We define as the redox potential that a given ubiquinone/ubiquinol ratio would have at pH 7.0, e.g.,
| (5) |
The modeling assumes that the cytosol side is at pH 7.0 so that .
Equilibrium measurement of membrane potential
Membrane potential was measured from the redox poise of hemes bH and bL assuming Eq. 1 remains at equilibrium. The redox potentials could not be calculated using the Nernst equation because there is substantial redox anticooperativity between the hemes, presumably due to simple electrostatic repulsion (13). Instead, a redox cooperativity model (14) using +40 mV and −20 mV for the first-electron midpoint potentials of bH and bL, respectively, and −30 mV and −90 mV for the second electron midpoint potentials (13), was employed. To account for the membrane potential, the redox potential of bL was assumed to be . The model was fitted to the oxidation state of bH and bL using a Levenberg-Marquardt algorithm with and βΔψ as free parameters. The membrane potential is only reported when the reduction state of bH and bL is between 10 and 90%, because small errors in reduction state lead to large errors in ΔΨ outside this range.
Stochastic model
A stochastic model based on Gillespie's algorithm (15) following Ransac et al. (16), but including the redox anti-cooperativity between the b-hemes and the effect of ΔΨ and ΔH+, was implemented as a native Win32 application in Delphi 2010 (Embarcadero, CA) using mixed object PASCAL and ASSEMBLY language. In brief, the Gillespie algorithm first determines the available partial reactions from a given state. It then chooses the time the enzyme dwells in that state and a partial reaction to be executed. Each choice is based on the available partial reaction rates and a random number. The partial reaction is then executed and the enzyme is moved to the next state from which the process starts again. The algorithm is particularly suited to modeling enzyme turnover because a complex enzyme reaction can be split into multiple simple partial reactions, but a prerequisite is knowledge of the reaction mechanism and the forward and reverse rate constants of the partial reactions.
A single bc1 complex monomer was modeled to be interacting with thermodynamic pools of intermembrane Cytc, intramembrane ubiquinone, and matrix protons. The partial reactions and their rate constants are listed in Table S1 in the Supporting Material and the midpoint potentials of the redox centers are listed in Table S2. The forward and reverse rate constants were determined from Dutton's Ruler using λ = 0.7 (17) and previously published distances (16). The forward and reverse rates of electrogenic reactions were determined by weighting the respective rate constants by and , respectively, where n is the charge and δ is the dielectric distance, as suggested previously (13). The dielectric distance between the matrix and bH, between bH and bL, and between bL and the intermembrane space was assumed to be 0.25, 0.50 (13), and 0.25, respectively. Anticooperativity between the hemes was modeled by changing their midpoint potentials depending on whether the other heme was oxidized or reduced. The bc1 is able to precisely bifurcate the electrons into the high and low potential chains, but the mechanism of bifurcation is not known (18,19). The bifurcation mechanism was modeled by only allowing the first and second electron on ubiquinol oxidation at the Qo center to pass to the Rieske center and bL, respectively, that is, the leak reactions were not included.
The total concentration of ubiquinone and ubiquinol in the membrane was assumed to be 30 mM (20). The concentration of Cytc in the intermembrane space was assumed to be 700 μM based on the measured Cytc concentration of 80 nM in the cell suspension (see Results), the cell suspension containing 1.1% volume by volume of cells at this density (10), and the intermembrane space being 1% of the cell volume.
The stochastic model was used to estimate turnover, occupancy of the ubiquinone binding centers, and oxidation states of the redox centers for given values of , , ΔΨ, and ΔH+. The enzyme was initialized with the ubiquinone centers empty, the redox centers oxidized, and the Rieske center close to Qo. The system was allowed to evolve for 108 partial reactions, which was typically between 5 and 18 s of enzyme time depending on the starting parameters, and the time-average occupation of the redox centers was logged. Enzyme turnover was measured from the net flux of electrons transferred from the Rieske center to c1 (that is, the difference between the numbers of forward and reverse partial reactions executed by the simulation divided by the total enzyme time). Computational time was ∼30 s per simulation on a six-core 3.2 GHz AMD Phenom II processor.
Statistics
Results are expressed as mean ± SD (n = 7), unless otherwise stated.
Results
Experimental protocol
Fig. 2 shows a representative example of the data collection and experimental protocol. Initially, the cells were maintained in the chamber at an oxygen concentration of 100 μM, a concentration at which the oxidation state of the hemes is independent of the oxygen concentration. A 2-min anoxia was performed by switching the oxygen in the tubing to 0 to fully reduce the hemes, followed by reoxygenation to 100 μM and a 2-min stabilization period. The shaded area in Fig. 2 shows the period when the oxygen concentration was <50 μM. Note that the hemes reduce upon anoxia and return precisely to baseline on reoxygenation.
Figure 2.
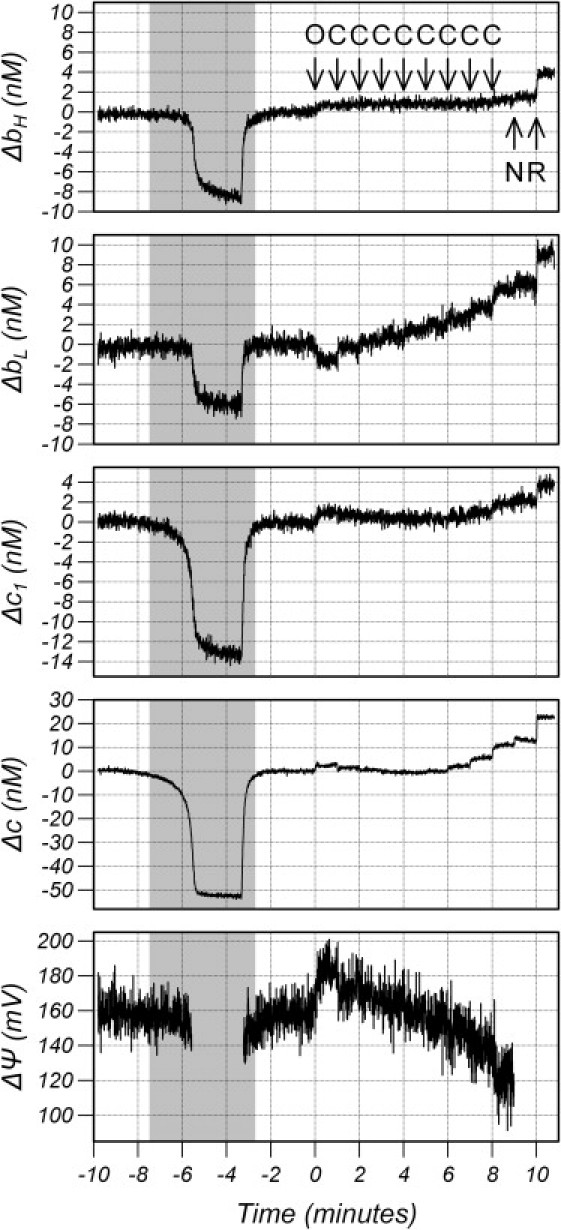
Oxidation changes in bH, bL, c1, and Cytc and ΔΨ during the experimental protocol <50 μM. (Arrows) Additions to the chamber. (O) 5 μg/mL oligomycin, (C) 75 nM CCCP, (N) 1 mM 3-NPA, and (R) 1 μM Rotenone. The hemes were assumed to be fully oxidized after rotenone.
At time 0, the cells were treated with 100 ng/mL of oligomycin followed by six additions of 75 nM carbonyl cyanide 3-chlorophenylhydrazone (CCCP) separated by 1 min, 1 mM of 3-nitropropionic acid (3-NPA), and finally 1 μM of rotenone. Oligomycin is an ATP synthase inhibitor that blocks proton transport through the ATP synthase, resulting in a rise in ΔP and a decrease in oxygen consumption. CCCP is a proton ionophore that increases the conductivity of the inner mitochondrial membrane to protons. It allows a flux of protons back into the matrix, lowering ΔP, increasing electron flux, and increasing oxygen consumption. Finally, 3-NPA is a complex-II inhibitor and rotenone is a complex-I inhibitor providing the fully oxidized state of the hemes. The signal/noise is lower for the bc1 hemes compared to Cytc mainly because of the difference in content: the total content of Cytc, bH, bL, and c1 was 79 ± 12, 13.6 ± 1.7, 15.6 ± 1.9, and 17.7 ± 2.7 nM, respectively.
The lower graph of Fig. 2 shows ΔΨ calculated from the oxidation state of bH and bL assuming equilibrium. The data are not shown during the anoxia or after the addition of 3-NPA because errors in the algorithm become large whenever bH or bL are highly oxidized or highly reduced. The root mean-square noise on the signal is 7.7 mV, which is large compared to the functional range of ΔΨ. However, this represents random noise on 0.5-s data collection and the precision can be improved by averaging over an epoch. A 30-s epoch (60 data points) should provide a standard error of the mean of ≈1 mV, and this is borne out by averages over 30-s epochs from the baseline, which were 159.8, 158.4, 158.9, 160.4, and 159.3 mV.
Oxidation states
Paired experiments with cells from the same culture were carried out with the chamber in respirometry mode so that cellular oxygen consumption (VcO2) could be measured under the same conditions. A separate study using cyanide to inhibit mitochondrial oxygen consumption (VmO2) and so separate the contributions of mitochondrial and nonmitochondrial oxygen consumption to VcO2 was carried out and it was found that nonmitochondrial oxygen consumption is 9.0 ± 1.3% of baseline (mean ± SD, n = 6). Therefore, VmO2 at baseline, after oligomycin and after CCCP, was determined by subtracting 9% of the baseline VcO2 from the measured VcO2. The results are displayed in the top panel of Fig. 3 along with the oxidation state of the b-hemes (middle panel) and the c-hemes (lower panel).
Figure 3.

Mitochondrial oxygen consumption and oxidation state of bH, bL, c1, and Cytc under baseline conditions (B), after oligomycin (O) and subsequent addition of CCCP.
Oligomycin decreased VmO2 to 5.5 ± 0.5 μM/min and subsequent additions of CCCP increased VmO2 to 48.2 ± 6.5 μM/min, which was an 8.8-fold increase. Pilot studies had shown VmO2 decreases with at higher CCCP concentrations and VmO2 was maximal at 525 nM of CCCP in two of the seven studies.
The baseline oxidation state of bH, bL, c1, and Cytc were 66.2 ± 1.6, 41.3 ± 1.4, 78.5 ± 1.6, and 68.6 ± 1.6%, respectively. The difference in oxidation states between c1 and Cytc could be mostly accounted for in their difference in midpoint potential assuming equilibrium. Oligomycin resulted in a ≈5% oxidation in bH, c1, and Cytc and a ≈10% reduction in bL. Addition of CCCP up to 300 nM caused a small reduction in c1 and Cytc to slightly below baseline values and then higher concentrations caused an oxidation to above the oligomycin values. The b-hemes oxidized with increasing CCCP but the oxidation in bH was small (<6%), whereas the oxidation in bL was substantial (>45%). Pilot studies showed that even higher concentrations of CCCP resulted in a profound oxidation of all the hemes of the electron transport chain concomitant with the decrease in VmO2.
Redox potentials
Fig. 4 shows turnover number of the bc1 complex, redox potentials of Cytc and ubiquinone, ΔΨ, and the redox span (ΔEs) of the bc1 complex. The redox span is the difference in redox potentials of Cytc and UQ/UQH2 and the term in brackets in Eq. 2. Baseline turnover was 92 ± 13e/s and decreased to 24 ± 2e/s after oligomycin and increased to a maximum of 206 ± 28e/s after 600 nM of CCCP. Baseline ΔΨ was 155 ± 2 mV and increased to 180 ± 3 mV after oligomycin and decreased to a minimum of 121 ± 11 mV after 600 nM of CCCP. The redox potential of Cytc remained remarkably constant, and only varied between 280 and 285 mV except at the highest two concentrations of CCCP.
Figure 4.

The bc1 turnover, redox potentials of Cytc, c1, and UQ, bc1 redox span, and ΔΨ under baseline conditions (B), after oligomycin (O) and subsequent addition of CCCP.
Stochastic modeling
To compare the results of the stochastic model with published data, the experimental protocol of Sun and Trumpower (21) was modeled in which the reaction of isolated bovine heart bc1 complex was followed in the presence of 50 μM of decyl-ubiquinol and 40 μM of oxidized Cytc at pH 7.4. Enzyme turnover was simulated at the concentrations of reactants and products that would be present as the enzyme transferred electrons from the ubiquinol to Cytc pools. The model predicted a maximum turnover of 271e/s when the enzyme had consumed 4 μM of UQH2, which compares favorably with the measured turnover of 355e/s (21).
To justify using an analytical equilibrium model to estimate ΔΨ and from the oxidation state of the hemes using Eqs. 1 and 2, stochastic simulations were carried out to estimate the turnover and oxidation state of bH and bL using parameters comparable to those found in RAW cells. The values ΔΨ and were then estimated from the oxidation state of the hemes using the equilibrium model and compared to the known values used to run the simulation. Fig. 5 shows an example of the results. Simulations were carried out with = 285 mV, ΔH+ = 20 mV, and varied between 0 and 180 mV in steps of 5 mV (plotted on the x axis) at ΔΨ = 120 mV (left graphs), ΔΨ = 150 mV (center graphs), and ΔΨ = 180 mV (right graphs). The shaded regions represent the range of in which the disequilibrium of the reaction was between 0 and 60 mV. The turnover is shown in the upper graphs and the values are compatible with the physiological data and the assumption that the bc1 complex works close to equilibrium (e.g., at ΔΨ = 120, 150, and 180 mV, the observed turnover (Fig. 3) is ≈220, 150, and 25 e/s, respectively, which would require a disequilibrium of <30 mV, <15 mV, and <5 mV, respectively). The oxidation state of bH and bL are plotted in the second row of graphs. The effective midpoint potentials of bH and bL are the same when ΔΨ = 120 mV and both hemes would be expected to have the same oxidation state assuming they remain in equilibrium, as is found. Heme bL becomes increasingly more reduced with respect to bH with increasing ΔΨ, as would be expected if the hemes remained in redox equilibrium.
Figure 5.

Stochastic model estimations of bc1 turnover (upper panels), oxidation states of bH and bL (middle panels), and the difference between ΔΨ and used the model and calculated from the oxidation state of the hemes assuming equilibrium (lower panels) as a function of for ΔΨ = 120 mV (left panels), 150 mV (center panels), and 180 mV (right panels). The values and ΔH+ were set to 285 and 20 mV, respectively.
The difference between the values of ΔΨ and estimated from the oxidation state of bH and bL using the equilibrium model and the values used in the simulation are plotted in the lower graphs of Fig. 5. Under all conditions, the estimated value of ΔΨ was <1 mV different from the value used in the simulation except at high ΔΨ under conditions where the bc1 complex is running backward. Even then, the maximum error is <4 mV. The estimated value of was similarly very good at high ΔΨ in the range of disequilibrium that could be expected where the maximum error was 3.6 mV at ΔΨ = 180 mV and ΔG = −60 mV. At 120 mV, the accuracy of the estimated and the greatest error was 8.3 mV at a ΔG of −20 mV. However, only half of this error propagates into ΔH+ when using Eq. 2 so that ΔH+ should be accurate to <2 mV at high ΔΨ and <5 mV at lower ΔΨ.
Estimation of ΔH+
The operating disequilibrium of the bc1 complex was estimated by performing stochastic simulations to determine the degree of disequilibrium necessary to match the observed turnover. Simulations were carried out at the observed values of , , and ΔΨ shown in Fig. 4 at different values of ΔH+ to vary the disequilibrium of the reaction. Fig. 6 shows the difference in turnover between the simulation and the measured turnover as a function of disequilibrium for parameters sets measured after oligomycin, 150, 300, 450, and 600 nM of CCCP. The difference in turnover is plotted for clarity as the curves for 0, 150, 300, and 450 nM of CCCP, and under baseline conditions, overlay each other when the simulated turnover is plotted but also because the disequilibrium can easily estimated from where the curves cross the ΔTurnover = 0 line. The disequilibrium was estimated for each experimental point in the seven datasets and presented in Fig. 7 along with the measured difference in the redox span and ΔΨ that, according to Eq. 3, is equal to 2ΔH+−ΔG such that the difference of the two curves is equal to 2ΔH+.
Figure 6.

Difference between the measured and simulated bc1 turnover as a function of ΔG using values of bc1 turnover, , , and ΔΨ from oligomycin-inhibited cells (O) and after addition of 150, 300, 450, and 600 nM of CCCP. The value ΔG was varied in the simulation by varying ΔH+.
Figure 7.

Disequilibrium of the bc1 complex calculated from the stochastic simulations compared to the difference between the redox span of the bc1 complex and ΔΨ, which is equal to 2ΔH++ΔG under baseline conditions (B), after oligomycin (O) and subsequent addition of CCCP.
The baseline disequilibrium was 7 ± 2 mV and fell to 2 ± 1 mV after oligomycin and then increased with increasing turnover to 35 ± 13 mV after 600 nM of CCCP. The calculated values of ΔH+, ΔΨ, and ΔP are shown in Fig. 8. Baseline ΔH+ was 28 ± 3 mV; this decreased to 18 ± 3 mV after oligomycin, trended downwards to a minimum of 16 ± 3 mV at 300 nM of CCCP, and then increased to 27 ± 5 mV after 600 nM of CCCP. Baseline ΔP was 184 ± 2 mV, increased to 198 ± 2 mV, and declined to 148 ± 7 mV after 600 nM of CCCP.
Figure 8.

Values ΔP, ΔΨ, and ΔH+ under baseline conditions (B), after oligomycin (O) and subsequent addition of CCCP.
Discussion
The stochastic simulations confirmed that the b-hemes of the bc1 complex operate very close to equilibrium under the full dynamic range of electron flux found in the RAW 264.7 mouse macrophage cells so that the membrane potential can be measured from their oxidation state with millivolt accuracy. The model also predicts that ΔH+ can be measured from the equilibrium poise of the enzyme using the redox state of bH as a surrogate for the redox potential of the ubiquinone pool. Furthermore, the oxidation state of the b-hemes can be measured with sufficient signal/noise for the calculation of these parameters with millivolt precision. The accuracy of the calculated ΔΨ will depend on the accuracy of the measurement of the oxidation state of the b-hemes, which in turn depends on the ability to fully reduce and fully oxidize them, and the accuracy of the midpoint potentials used in the redox cooperativity model. The accuracy of the calculated ΔH+ also depends on the accuracy of the measurement of redox potential of Cytc and the ability of the stochastic model to estimate the disequilibrium for the given turnover conditions. Validation of the measurements is hampered by the lack of a gold-standard to measure ΔΨ.
The mitochondrial membrane potential can be measured in isolated mitochondria with a tetraphenyl phosphonium (TPP+) electrode (22), which provides a continuous time trace, and both ΔΨ and ΔH+ can be measured simultaneously from aliquots using radioactive tracers (86Rb for ΔΨ and the membrane-permeant weak acid 3H-acetate and weak base 14C-methylamine for ΔH+) in the presence of the potassium ionophore, valinomycin, to make the inner membrane permeant to rubidium (23). Using this method, the maximum ΔP was found to be ≈220 mV in both state-4 respiration and by reversal of the ATP synthase, and the minimum ΔP under state-3 respiration was 173 mV. The contribution of ΔΨ and ΔH+ to ΔP was split 153:66 mV in state 4 and 137:38 mV in state 3. However, the valinomycin tends to redistribute the components of ΔP to favor higher ΔH+ and lower ΔΨ, even in low potassium media. In contrast, the matrix and cytosol contains 120 mM of potassium (24) and similar concentrations of chloride and millimolar concentrations of sodium, which are maintained far from their Nernst equilibrium by the high impermeability of the inner membrane and by electroneutral ionic antiporters (25,26). Therefore, isolated mitochondrial studies only weakly inform on the magnitude of ΔP and its distribution into ΔΨ and ΔH+ when mitochondria are in their physiological environment within cells.
Methods to measure ΔΨ in cells rely on the use of membrane-permeant, cationic fluorescent probes such as tetramethyl rhodamine ethyl ester (TMRE), tetramethyl rhodamine methyl ester (TMRM) (27), and JC1, which accumulate in the mitochondrial matrix according to the Nernst equation (see Nicholls and Ward (3) for a review). At high concentrations, the probes aggregate, which quenches the fluorescence for TMRE and TMRM so that TMRM must be used at a concentration of <5 nM (4). A major confounding error will occur if the indicator enters the quenching regime because then a small decline in ΔΨ will result in an increase in fluorescence, whereas a collapse in ΔΨ obtained by adding a high concentration of a proton ionophore, which is often used as a control, will cause a decrease in fluorescence. Thus, even the direction change in ΔΨ may be misrepresented if great care is not taken. The JC1 aggregates fluoresce at a different wavelength compared to the free fluorophore allowing for a ratiometric measurement but the aggregates are slow to disassociate (3).
All the indicators are sensitive to matrix volume, which is a particular problem in apoptotic studies due to cristae remodeling after caspase activation (28), and also the plasma membrane potential, which causes accumulation of the indicator in the cytosol, but which is rarely measured in nonneuronal cell lines. The membrane potential can be deconvoluted and quantified from the fluorescence signal if the rate constants for equilibration across the plasma and mitochondrial membrane are known, if the relative matrix volume is known, if the plasma membrane potential is known, and if nonspecific binding is assumed negligible (4), but this is very rarely carried out. In contrast, measurement of ΔΨ from the b-hemes is entirely independent of the plasma-membrane potential and the matrix volume, as it only depends on the electric field within the inner mitochondrial membrane in which the bc1 complex is embedded. Furthermore, the theoretical temporal resolution, based on the intraheme rate constants, is on the microsecond scale, although the signal/noise limits the measurements to tens of seconds to obtain millivolt precision.
Under baseline conditions, ΔΨ, ΔH+, and ΔP were measured to be 155 ± 2, 28 ± 3, and 183 ± 2 mV, respectively, which compares extremely well with the estimated normal values in cells of 150, 30, and 180 mV, respectively (3,4). Oligomycin caused an increase in ΔΨ to 180 ± 3 mV but a decrease in ΔH+ to 18 ± 3 mV resulting in a ΔP of 198 ± 2 mV. The higher ΔP in mitochondria under state-4 respiration compared to the oligomycin-inhibited cells is not surprising, because the mitochondria preparation uses an artificial electron donor system (glutamate and malate operating through the malate-aspartate shuttle system) that is able to fully reduce NADH in state-4 (29). This drives the ETC to generate a higher ΔP than in cells in which the electron source originates from the TCA cycle. If oligomycin simply caused a transient net efflux of protons, then both ΔΨ and ΔH+ would be expected to increase and the ratio of the increase should depend on the relative capacitance of the inner mitochondrial membrane and the matrix pH buffering capacity. But in the milieu of the cell, there will be a reequilibration of ions, weak acids, and weak bases across the inner membrane that could redistribute the contribution of ΔΨ and ΔH+ to ΔP. In particular, an accumulation of a weak base or inorganic phosphate (the latter being cotransported into the matrix with a proton by the phosphate symporter) would tend to decrease ΔH+, as occurs on addition of phosphate to isolated mitochondria (23).
Addition of CCCP to the oligomycin-inhibited cells decreases ΔP and ΔΨ, as would be expected. The value ΔH+ decreased at concentrations of CCCP below 375 nM, broadly consistent with a ≈90:10% distribution of ΔP into ΔΨ/ΔH+, but ΔH+ increased at higher concentration of CCCP. The value ΔP could not be measured at much higher concentrations of CCCP that would collapse ΔP completely because, under these conditions, all the hemes of the electron transport chain become highly oxidized, making the estimation of their redox potentials error-prone. The increase in ΔH+ is thermodynamically possible as ΔP continually decreases with increasing CCCP, but the apparent increase in ΔH+ could be the result of an underestimation of the disequilibrium of the bc1 complex by the stochastic model. The disequilibrium of the bc1 complex has been measured in isolated mitochondria and found to be similar to the values calculated by the stochastic simulations (8). The disequilibrium was ≈6 mV in oligomycin-inhibited mitochondria compared to 2 mV in the simulations, and increased to ≈48 mV in the mitochondria at high flux obtained with a proton ionophore, compared to 35 mV in simulations. However, the results are not precisely comparable, because the flux was measured in terms of oxygen consumption per mg of protein in the mitochondrial study rather than turnover of the bc1 complex. Furthermore, the electron donor in the mitochondrial studies was succinate; this may have led to a higher maximum turnover, and the respiratory control ratio was <4 in the mitochondria compared to 8.8 in the cells that may also have made the oligomycin turnover higher.
The calculation of ΔH+ from Eq. 3 depends directly on the midpoint potential of Cytc used in the calculation of its redox potential. The midpoint potential of isolated Cytc varies between 270 and 290 mV depending on ionic strength and concentration of chloride and phosphate (30), and has been measured to be 230 mV in isolated mitochondria (31). There are reports of increases in midpoint potential on Cytc binding to artificial membranes (32) although studies have shown that Cytc diffuses in three dimensions in the mitochondria intermembrane space at physiological ionic strength (33–35), and decreases from 282 to 252 mV in the presence of increasing concentration of cytOx (36). All reports observe that Cytc titrates with an n = 1 Nernst function so that only the error in the midpoint potential would affect the calculation of ΔH+ and would result in an offset of half the magnitude being added to ΔH+. In support of our use of 260 mV, it was found that the difference in midpoint potential between Cytc and c1 varied by only 8 mV over the dynamic range of turnover, and the stochastic simulations predict that a component of this can be attributed to the disequilibrium between Cytc and c1.
Conclusion
In this article, we have shown that the ΔΨ can be measured from the redox poise of the b-hemes of the bc1 complex with millivolt precision. Furthermore, the stochastic simulations predict that the redox potential of the ubiquinone pool can be calculated from the redox potential of bH with millivolt accuracy except at low membrane potential when turnover is very high. This allows ΔH+ to be calculated from the difference in the redox potentials of the Cytc and ubiquinone pools. Application of this technique could make quantitative cellular bioenergetics possible and lead to a more precise understanding of the function of the mitochondrial electron transport chain.
Acknowledgments
This work was supported by grant No. 5R21RR25803 from the National Institutes of Health.
Supporting Material
References
- 1.Crofts A.R., Meinhardt S.W., Snozzi M. The role of the quinone pool in the cyclic electron-transfer chain of Rhodopseudomonas sphaeroides: a modified q-cycle mechanism. Biochim. Biophys. Acta. 1983;723:202–218. doi: 10.1016/0005-2728(83)90120-2. [DOI] [PMC free article] [PubMed] [Google Scholar]
- 2.Mitchell P. Keilin's respiratory chain concept and its chemiosmotic consequences. Science. 1979;206:1148–1159. doi: 10.1126/science.388618. [DOI] [PubMed] [Google Scholar]
- 3.Nicholls D.G., Ward M.W. Mitochondrial membrane potential and neuronal glutamate excitotoxicity: mortality and millivolts. Trends Neurosci. 2000;23:166–174. doi: 10.1016/s0166-2236(99)01534-9. [DOI] [PubMed] [Google Scholar]
- 4.Nicholls D.G. Simultaneous monitoring of ionophore- and inhibitor-mediated plasma and mitochondrial membrane potential changes in cultured neurons. J. Biol. Chem. 2006;281:14864–14874. doi: 10.1074/jbc.M510916200. [DOI] [PubMed] [Google Scholar]
- 5.Llopis J., McCaffery J.M., Tsien R.Y. Measurement of cytosolic, mitochondrial, and Golgi pH in single living cells with green fluorescent proteins. Proc. Natl. Acad. Sci. U S A. 1998;95:6803–6808. doi: 10.1073/pnas.95.12.6803. [DOI] [PMC free article] [PubMed] [Google Scholar]
- 6.Azarias G., Perreten H., Chatton J.Y. Glutamate transport decreases mitochondrial pH and modulates oxidative metabolism in astrocytes. J. Neurosci. 2011;31:3550–3559. doi: 10.1523/JNEUROSCI.4378-10.2011. [DOI] [PMC free article] [PubMed] [Google Scholar]
- 7.Osyczka A., Moser C.C., Dutton P.L. Reversible redox energy coupling in electron transfer chains. Nature. 2004;427:607–612. doi: 10.1038/nature02242. [DOI] [PubMed] [Google Scholar]
- 8.Brown G.C., Brand M.D. Thermodynamic control of electron flux through mitochondrial cytochrome bc1 complex. Biochem. J. 1985;225:399–405. doi: 10.1042/bj2250399. [DOI] [PMC free article] [PubMed] [Google Scholar]
- 9.Hollis V.S., Palacios-Callender M., Moncada S. Monitoring cytochrome redox changes in the mitochondria of intact cells using multi-wavelength visible light spectroscopy. Biochim. Biophys. Acta. 2003;1607:191–202. doi: 10.1016/j.bbabio.2003.09.012. [DOI] [PubMed] [Google Scholar]
- 10.Ripple M.O., Abajian M., Springett R. Cytochrome c is rapidly reduced in the cytosol after mitochondrial outer membrane permeabilization. Apoptosis. 2010;15:563–573. doi: 10.1007/s10495-010-0455-2. [DOI] [PMC free article] [PubMed] [Google Scholar]
- 11.Haller T., Ortner M., Gnaiger E. A respirometer for investigating oxidative cell metabolism: toward optimization of respiratory studies. Anal. Biochem. 1994;218:338–342. doi: 10.1006/abio.1994.1188. [DOI] [PubMed] [Google Scholar]
- 12.Kim N., Ripple M.O., Springett R. Spectral components of the α-band of cytochrome oxidase. Biochim. Biophys. Acta. 2011;1807:779–787. doi: 10.1016/j.bbabio.2011.03.008. [DOI] [PMC free article] [PubMed] [Google Scholar]
- 13.Shinkarev V.P., Crofts A.R., Wraight C.A. The electric field generated by photosynthetic reaction center induces rapid reversed electron transfer in the bc1 complex. Biochemistry. 2001;40:12584–12590. doi: 10.1021/bi011334j. [DOI] [PubMed] [Google Scholar]
- 14.Hendler R.W., Westerhoff H.V. Redox interactions in cytochrome c oxidase: from the “neoclassical” toward “modern” models. Biophys. J. 1992;63:1586–1604. doi: 10.1016/S0006-3495(92)81748-4. [DOI] [PMC free article] [PubMed] [Google Scholar]
- 15.Gillespie D.T. Exact stochastic simulation of coupled chemical-reactions. J. Phys. Chem. 1977;81:2340–2361. [Google Scholar]
- 16.Ransac S., Parisey N., Mazat J.P. The loneliness of the electrons in the bc1 complex. Biochim. Biophys. Acta. 2008;1777:1053–1059. doi: 10.1016/j.bbabio.2008.05.003. [DOI] [PubMed] [Google Scholar]
- 17.Moser C.C., Farid T.A., Dutton P.L. Electron tunneling chains of mitochondria. Biochim. Biophys. Acta. 2006;1757:1096–1109. doi: 10.1016/j.bbabio.2006.04.015. [DOI] [PubMed] [Google Scholar]
- 18.Ransac S., Mazat J.P. How does antimycin inhibit the bc1 complex? A part-time twin. Biochim. Biophys. Acta. 2010;1797:1849–1857. doi: 10.1016/j.bbabio.2010.05.014. [DOI] [PubMed] [Google Scholar]
- 19.Darrouzet E., Moser C.C., Daldal F. Large scale domain movement in cytochrome bc1: a new device for electron transfer in proteins. Trends Biochem. Sci. 2001;26:445–451. doi: 10.1016/s0968-0004(01)01897-7. [DOI] [PubMed] [Google Scholar]
- 20.Ding H., Moser C.C., Dutton P.L. Ubiquinone pair in the Qo site central to the primary energy conversion reactions of cytochrome bc1 complex. Biochemistry. 1995;34:15979–15996. doi: 10.1021/bi00049a012. [DOI] [PubMed] [Google Scholar]
- 21.Sun J., Trumpower B.L. Superoxide anion generation by the cytochrome bc1 complex. Arch. Biochem. Biophys. 2003;419:198–206. doi: 10.1016/j.abb.2003.08.028. [DOI] [PubMed] [Google Scholar]
- 22.Kamo N., Muratsugu M., Kobatake Y. Membrane potential of mitochondria measured with an electrode sensitive to tetraphenyl phosphonium and relationship between proton electrochemical potential and phosphorylation potential in steady state. J. Membr. Biol. 1979;49:105–121. doi: 10.1007/BF01868720. [DOI] [PubMed] [Google Scholar]
- 23.Nicholls D.G. The influence of respiration and ATP hydrolysis on the proton-electrochemical gradient across the inner membrane of rat-liver mitochondria as determined by ion distribution. Eur. J. Biochem. 1974;50:305–315. doi: 10.1111/j.1432-1033.1974.tb03899.x. [DOI] [PubMed] [Google Scholar]
- 24.Nicholls D.G. Commentary on: ‘old and new data, new issues: the mitochondrial Deltapsi’ by H. Tedeschi. Biochim. Biophys. Acta. 2005;1710:63–66. doi: 10.1016/j.bbabio.2005.09.002. [DOI] [PubMed] [Google Scholar]
- 25.Garlid K.D., Paucek P. Mitochondrial potassium transport: the K+ cycle. Biochim. Biophys. Acta. 2003;1606:23–41. doi: 10.1016/s0005-2728(03)00108-7. [DOI] [PubMed] [Google Scholar]
- 26.Bernardi P. Mitochondrial transport of cations: channels, exchangers, and permeability transition. Physiol. Rev. 1999;79:1127–1155. doi: 10.1152/physrev.1999.79.4.1127. [DOI] [PubMed] [Google Scholar]
- 27.Scaduto R.C., Jr., Grotyohann L.W. Measurement of mitochondrial membrane potential using fluorescent rhodamine derivatives. Biophys. J. 1999;76:469–477. doi: 10.1016/S0006-3495(99)77214-0. [DOI] [PMC free article] [PubMed] [Google Scholar]
- 28.Sun M.G., Williams J., Frey T.G. Correlated three-dimensional light and electron microscopy reveals transformation of mitochondria during apoptosis. Nat. Cell Biol. 2007;9:1057–1065. doi: 10.1038/ncb1630. [DOI] [PubMed] [Google Scholar]
- 29.Chance B., Williams G.R. Respiratory enzymes in oxidative phosphorylation. III. The steady state. J. Biol. Chem. 1955;217:409–427. [PubMed] [Google Scholar]
- 30.Gopal D., Wilson G.S., Cusanovich M.A. Cytochrome c: ion binding and redox properties. Studies on ferri and ferro forms of horse, bovine, and tuna cytochrome c. J. Biol. Chem. 1988;263:11652–11656. [PubMed] [Google Scholar]
- 31.Dutton P.L., Wilson D.F., Lee C.P. Oxidation-reduction potentials of cytochromes in mitochondria. Biochemistry. 1970;9:5077–5082. doi: 10.1021/bi00828a006. [DOI] [PubMed] [Google Scholar]
- 32.Salamon Z., Tollin G. Interaction of horse heart cytochrome c with lipid bilayer membranes: effects on redox potentials. J. Bioenerg. Biomembr. 1997;29:211–221. doi: 10.1023/a:1022401825287. [DOI] [PubMed] [Google Scholar]
- 33.Gupte S.S., Hackenbrock C.R. The role of cytochrome c diffusion in mitochondrial electron transport. J. Biol. Chem. 1988;263:5248–5253. [PubMed] [Google Scholar]
- 34.Gupte S.S., Hackenbrock C.R. Multidimensional diffusion modes and collision frequencies of cytochrome c with its redox partners. J. Biol. Chem. 1988;263:5241–5247. [PubMed] [Google Scholar]
- 35.Cortese J.D., Hackenbrock C.R. Motional dynamics of functional cytochrome c delivered by low pH fusion into the intermembrane space of intact mitochondria. Biochim. Biophys. Acta. 1993;1142:194–202. doi: 10.1016/0005-2728(93)90102-l. [DOI] [PubMed] [Google Scholar]
- 36.Kojima N., Palmer G. Further characterization of the potentiometric behavior of cytochrome oxidase. Cytochrome α stays low spin during oxidation and reduction. J. Biol. Chem. 1983;258:14908–14913. [PubMed] [Google Scholar]
- 37.Reference deleted in proof.
- 38.Yu C.A., Yu L., King T.E. Kinetics of electron transfer between cardiac cytochrome c1 and c. J. Biol. Chem. 1973;248:528–533. [PubMed] [Google Scholar]
- 39.Matcher S.J., Cope M., Delpy D.T. Use of the water absorption spectrum to quantify tissue chromophore concentration changes in near-infrared spectroscopy. Phys. Med. Biol. 1994;39:177–196. doi: 10.1088/0031-9155/39/1/011. [DOI] [PubMed] [Google Scholar]
- 40.Yu L., Xu J.X., Yu C.A. Properties of bovine heart mitochondrial cytochrome b560. J. Biol. Chem. 1987;262:1137–1143. [PubMed] [Google Scholar]
Associated Data
This section collects any data citations, data availability statements, or supplementary materials included in this article.