

Abstract
Superoxide flash represents quantal and bursting production of mitochondrial reactive oxygen species (ROS) instigated by transient opening of the mitochondrial permeability transition pore (mPTP). Given their critical role in metabolism, ischemia-reperfusion injury, and apoptosis, characterization of flash properties would be valuable to further mechanistic and physiological studies of this newly discovered mitochondrial phenomenon. Here we developed the flash detector FlashSniper based on segmentation of two-dimensional feature maps extracted from time-lapse confocal image stacks, and on the theory for correcting optical distortion of flash-amplitude histograms. Through large-scale analysis of superoxide flashes in cardiomyocytes, we demonstrated uniform mitochondrial ROS excitability among subsarcolemmal and intermyofibrillar mitochondria, and exponential distribution of intervals between consecutive flash events. Flash ignition displayed three different patterns: an abrupt rise from quiescence (44%), a rise with an exponential foot (27%), or a rise occurring after a pedestal precursor (29%), closely resembling action-potential initiation in excitable cells. However, the optical blurring-corrected amplitudes of superoxide flashes were highly variable, as were their durations, indicating stochastic automaticity of single-mitochondrion ROS excitation. Simultaneous measurement of mitochondrial membrane potential revealed that graded, rather than all-or-none, depolarization mirrored the precursor and the primary peak of the flash. We propose that superoxide flash production is a regenerative process dominated by stochastic, autonomous recruitment of a limited number of units (e.g., mPTPs) in single mitochondria.
Introduction
In the cardiomyocyte, several thousands of mitochondria occupy up to 40% of the cell volume. As the most prominent and dominant intracellular organelle, these mitochondria act not only as the so-called “powerhouse” central to cardiac bioenergetics, but are also the convergence point of pro- and anti-apoptotic signals. A third, but not yet fully appreciated, role of mitochondria resides in their unparalleled ability to produce most of the reactive oxygen species (ROS) in the cell (1). Although high levels of ROS are associated with a broad variety of metabolic, cardiovascular, and neurodegenerative diseases (2–4), emerging evidence suggests that ROS are also indispensable messengers that regulate pivotal processes ranging from protein kinase and phosphatase activity (5,6) to organogenesis (7) and wound-healing (8). These recent findings suggest that the mitochondrion may act as a key regulator of intracellular ROS signaling, as well as redox homeostasis.
The traditional view of mitochondrial ROS production is that, due presumably to the imperfect insulation of the mitochondrial electron transport chain (ETC), electrons (up to 1%) may go astray and directly react with ambient molecular oxygen to form superoxide anions (9). Early studies have demonstrated massive increases in localized ROS production during metabolic stress (10), photostimulation (11), and excessive elevations in intracellular ROS or Ca2+ (12,13) that ultimately contribute to necrotic or apoptotic cell death. Recently, we discovered that mitochondrial ROS production can accelerate transiently, leading to excitable ROS production events, named superoxide flashes (14). Unlike constitutive ROS generation from basal ETC activity, a superoxide flash reflects the intermittent, quantal, and bursting production of superoxide anions. Mechanistically, it is triggered by transient opening of the mitochondrial permeability transition pore (mPTP) under physiological conditions, and is thus an actively regulated process. Being a fundamental and universal mitochondrial phenomenon, the superoxide flash occurs in virtually all cell types examined (14). Its physiological relevance is further supported by its existence in the beating heart under Langendorff perfusion (14), and in the skeletal muscles and sciatic nerves of anesthetized mice (15). Furthermore, it has been shown that the superoxide flash gauges oxidative stress during cardiac anoxia/hypoxia-reoxygenation (14), serves as a metabolic biomarker in skeletal muscles in vitro (16,17) and in vivo (15), and constitutes an early signal for selenite-induced apoptosis in cancer cells (18).
Since the superoxide flash is a newly discovered phenomenon, the ability to quantitatively characterize the production and properties of flashes is essential to understanding their upstream regulation, downstream signaling pathways, and the specific mechanism that couples mPTP opening to mitochondrial ROS excitability. In the present study, we developed and validated a computer algorithm named FlashSniper that allows automated detection and analysis of superoxide flashes from large-scale imaging data and established a confocal detection theory for correcting optical blurring effects. We found that superoxide flash production, as well as its companion, single-mitochondrion electrophysiological excitation, displays distinct ignition patterns that are characteristic of an excitable system. However, the genesis of superoxide flashes appears to be dominated by stochastic recruitment of presumably very limited numbers of constituent units (mPTPs or other channels) in single mitochondria, resulting in high variability in terms of flash amplitude and kinetics.
Materials and Methods
Culture and adenoviral infection of adult rat cardiomyocytes
Adult rat cardiomyocytes were isolated, cultured, and infected as previously described (14,19). See Supporting Material for further details.
Confocal imaging
Confocal imaging of mt-cpYFP and TMRM signals was carried out on a Zeiss LSM 710 confocal microscope (Carl Zeiss, Oberkochen, Germany) equipped with a 40×, 1.3 NA oil-immersion objective, and cells were bathed in Tyrode solution consisting of (in mM) 137 NaCl, 5.4 KCl, 1.2 MgCl2, 1.2 NaH2PO4, 10 glucose, and 20 Hepes (pH 7.35, adjusted with NaOH). All experiments were performed at room temperature (22–26°C).
Data analysis
The input data set was a time-lapse scanning LSM file generated from the Zeiss LSM 710. The whole procedure of data analysis is illustrated in Fig. S2. The software, FlashSniper, was implemented in IDL (ITT, New York, NY).
Statistics
Data are reported as the mean ± SE. Student's t-test and the Mann-Whitney U test for nonparametric distributions were applied, when appropriate, to determine the statistical significance of differences. P < 0.05 was considered statistically significant.
Results
Development of FlashSniper software for automated detection and analysis of superoxide flashes
To characterize the properties of cardiac superoxide flashes, stacks of time-lapse confocal image (xyt) were acquired at 1 frame/s for 100 s in cardiomyocytes expressing the superoxide-selective probe, mt-cpYFP ((14), see also (20) and (21)) (Fig. 1 A). Visual examination identified superoxide flashes as sudden and punctuated fluorescence increases that were sharply confined to regions with morphologies suggestive of a single or a few functionally coupled mitochondria. By reconstructing space-time (xt) plots from the raw (F) or normalized (F/F0, where F0 is the average intensity during quiescence) xyt data set, we found that typical events lasted 10–20 s and exhibited a uniform spatial intensity over the entire mitochondrion, but they rarely propagated into adjacent mitochondria (Fig. 1, B and C).
Figure 1.

Superoxide flashes in cardiomyocytes. (A) Time-lapse confocal-frame (xyt) images of an adult rat cardiomyocyte expressing the superoxide probe mt-cpYFP. Arrows indicate individual mitochondria undergoing a flash. N, nucleus. (B) Space-time (xt) plot of a typical flash in A. Pseudolinescan image was reconstructed from the xyt data set, with the line placed across the long axis of the mitochondrion. (C) Normalized image (F/F0) from B along with the spatial (right trace) and temporal (bottom trace) profiles of the flash.
For objective, reproducible, and efficient detection of superoxide flashes, we developed the FlashSniper software based on segmentation of two-dimensional feature maps (Fig. 2, see also Fig. S2). The main steps of our algorithm were as follows.
-
1.
Correction for photoconversion and photobleaching of mt-cpYFP. Upon 488-nm illumination, mt-cpYFP fluorescence intensity dropped precipitately in the first few images, followed by a small gradual decline over the entire image acquisition period (Fig. S3 A). The initial drop was mainly due to reversible photoconversion, rather than irreversible photobleaching, because the fluorescence essentially recovered after a short period without illumination (Fig. S3 A). Interestingly, simultaneous 405-nm excitation served as a photoactivation mechanism and effectively alleviated the initial drop of fluorescence at 488-nm excitation (Fig. S3 B). The minor slow-decay component, however, was attributable to both residual photoconversion and irreversible loss by photobleaching (Fig. S3). In the data analysis, we first corrected for the residual photoconversion and photobleaching at dual laser excitation (405 nm and 488 nm) to prime the data for subsequent feature extractions.
-
2.
Generation of the peak map, which is the projection of the maximal increase in fluorescence intensity (ΔFmax = Max(F − Fbaseline)) during the observation period at each intracellular pixel (Fig. 2 B). The pixel histogram of the peak map shows a Gaussian-like distribution, except for the presence of a long tail at the high-amplitude end corresponding to potential superoxide flash activity (Fig. 2 C). The mean value, m, and standard deviation, σ, were then determined by fitting the left portion of the histogram to a Gaussian function.
-
3.
Generation of the flash site map. By setting a threshold m + k × σ, where k is a constant, we obtained a binary flash site map based on the peak map described above (Fig. 2 D).
-
4.
Generation of the peak-time map, which provides a time stamp of ΔFmax occurrence (Fig. 2 E).
-
5.
Detection of superoxide flashes in space and time. After combining the flash-site map with the peak-time map (Fig. 2 F), sieving procedures were applied to determine flash events above a certain area criterion (>5 connected pixels in this study) and local noise (22). Then, the spatial contours of detected flashes were overlapped onto the confocal image for visual confirmation (Fig. 2 G). After event detection, we used the raw image stack for parametric measurement of the spatial size, amplitude, and kinetic properties of individual superoxide flashes. An overall chart flow of the algorithm of FlashSniper is shown in Fig. S2.
Figure 2.
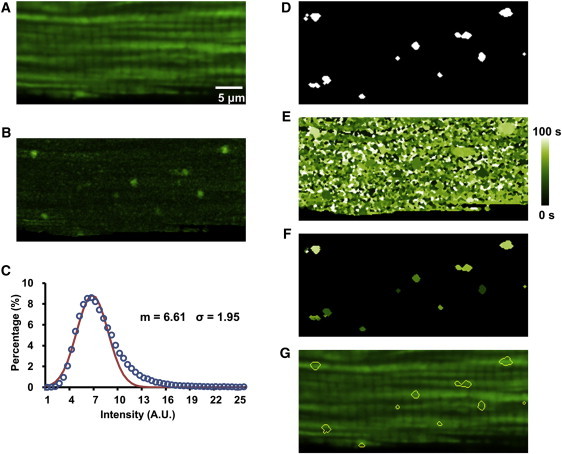
Feature maps for automated detection of superoxide flashes. (A) Averaged cell image showing fluorescent staining of mitochondria. (B) Peak map (ΔFmax) showing maximum increase of fluorescence intensity at each pixel. (C) Histogram of ΔFmax (open circles) and Gaussian fitting of its left portion (solid line), yielding mean (m) and standard deviation (σ). (D) Peak-site map. Binary map after thresholding the peak map at the level of m + kσ; in this case, k = 3. (E) Peak-time map showing the time (0–100 s, color-coded) when local fluorescence increase attained its peak. (F) Combinatorial map derived from D and E, showing tentative flash sites and respective peak times. (G) Overlay of contours of detected flashes on the averaged cell image.
The performance of FlashSniper was evaluated by creating synthetic test data that closely mimicked the real data. For this purpose, we selected 10 xyt image stacks with no discernible flash events as the flash-null background, thus retaining features of experimental noises, mitochondrial morphology, and organization, as well as other cellular textures. Four hundred mock superoxide flashes of variable amplitude (ΔF/F0) and a fixed triangular waveform (6-s rise time, 14-s decay time) were superimposed on randomly selected mitochondria, and their starting times were assigned by a random number generator (Fig. S4 A). Fig. S4, B–D, shows the performance of FlashSniper when it was applied to the test data sets. At k = 3.0, the detection sensitivity increased from 0.1 to 0.9 when mock event amplitude varied from 0.1 to 0.24 (Fig. S4 B). The positive prediction value (PPV), which reflects the ability to discriminate against events of false detection, rose steeply to >0.9 when mock event amplitude exceeded 0.12, indicating that the algorithm is highly sensitive and reliable even for detecting small-amplitude events (Fig. S4 C). In addition, there was only minor distortion of amplitude measurement when mock events were >0.15 (Fig. S4 D).
Spatiotemporal pattern of superoxide flash ignition in cardiomyocytes
Next, we implemented the FlashSniper software to automatically detect superoxide flashes from xyt image stacks obtained in 194 cardiomyocytes under resting conditions. Fig. 3 A shows representative intracellular localization and Fig. 3 B shows diary plots of superoxide flash occurrence in different cells. We identified a total of 613 flash events, and on average there were 3.16 ± 0.28 superoxide flashes/image stack (i.e., per confocal section in a 100-s period). Assuming that a confocal section surveys one-tenth of the cell volume, this number translates into a rate of superoxide flash occurrence of ∼32 events/cell/100 s. The histogram of the number of flashes/image stack shows a highly skewed distribution that spans 0–22 events (Fig. 3 C). For cells displaying two or more superoxide flashes, the interval between two consecutive flashes followed a biexponential decay with time constants (τ) of 2.1 s and 12.1 s (Fig. S5). However, when we split the cells into high- or low-activity populations (at a level of 10 events/100 s/cell), the interval in each population followed an exponential distribution with τ = 3.4 or 10.2, respectively (Fig. 3 D). Parenthetically, the interval between two consecutive events of a Poisson process of rate λ obeys an exponential distribution with τ = 1/λ. This result is consistent with the idea of flash production being a Poisson process with variable rate in different cells.
Figure 3.

Stochastic superoxide flash ignition in cardiomyocytes. (A) Surface plot of superoxide flashes overlaid on a confocal micrograph of the corresponding cardiomyocyte. (B) Diary plots of superoxide flash occurrence. n = 8 cells. (C) Distribution of superoxide flash frequency (number of events/xyt data set/100 s). The total number of cells was n = 184 cells, and 10 cells displaying 12–22 flashes were not shown. (D) Distribution of waiting time between two consecutive events seen on a confocal section. Data are from subgroups of cells with the activity level below (blue circles, n = 182 cells) or 10 or above events/stack (red circles, n = 12 cells). Solid curves represent fitted exponential distributions of the high- or low-flash frequency groups, with τ = 3.4 s or 10.2 s, respectively. (E) Transverse distribution of superoxide flashes (n = 591 flash sites from 155 cells). Spatial location of a flash expressed as its distance to the cell edge normalized by the half-width of the cell. (F) Properties of subsarcolemmal and intermyofibrillar superoxide flashes in cardiomyocytes. FDHM, full duration at half maximum; RT90, time to achieve 90% of maximum increase.
Studies in isolated mitochondria preparations have shown that cardiac mitochondria are heterogeneous, with subsarcolemmal and intermyofibrillar populations differing in Ca2+ uptake capacity (23). In skeletal muscles, subsarcolemmal mitochondria are more prone to generate superoxide flashes than intermyofibrillar ones (16). To determine whether mitochondria are functionally heterogeneous in terms of superoxide flash production in intact cardiomyocytes, we mapped flash distribution by measuring the distances of individual flashes from the cell edge normalized to the half-width of the cell. Our results showed that flash events were evenly scattered transversely across the cell width (Fig. 3 E). The mean normalized transverse distance was 0.44 ± 0.01 (n = 591), close to the value of 0.5 for a strictly uniform distribution. In particular, mitochondria in the subsarcolemmal layer displayed a propensity for superoxide flash production similar to those in the central region of the cell. Furthermore, subsarcolemmal and intermyofibrillar superoxide flashes were nearly identical in amplitude, rise time, and overall duration (Fig. 3 F). These results suggest that in a resting cardiomyocyte, mitochondria are homogenous with respect to their ability to produce superoxide flashes.
Confocal measurement of superoxide flashes: theoretical considerations
Owing to optical blurring defined by the point spread function (PSF) of the imaging system, the observed amplitude of a flash can vary from the true value (in focus) to almost zero (far from the focal plane) (Fig. 4 A). For stereotyped events of unit amplitude (ΔF/F0 = 1.0) that were uniformly scattered in a cell 20 μm thick, and given the full width at half maximum of a Gaussian PSF of 1 μm, confocal detection theory predicts that the apparent amplitude histogram would disperse widely: instead of a Dirac function at ΔF/F0 = 1.0, it was fairly flat between 0.1 and 0.9 (Fig. 4 B) but with a large number of events at amplitudes <0.05 (not shown; see also Methods). Histograms for apparent amplitude distribution at other designated true amplitudes (0.1–0.9) are also shown in Fig. 4 B. To account for the performance of FlashSniper, these base histograms were further multiplied by the function of detection ability, rendering an apparent-amplitude histogram that leveled off on the low-amplitude end (Fig. 4 C, red bars). Specifically, if we were to detect 100 in-focus events in the amplitude bin of 1.0 (bin width 0.05), we should also register 55, 42, …, 50, and 11 events in the amplitude bins of 0.9, 0.8, …, 0.2, and 0.1, respectively. Flashes of lower true amplitude may end up with a smaller chance of being detected and a greater distortion in the apparent amplitude histogram (Fig. 4 C). For one in-focus detection within a true amplitude bin of 1.0, 0.5, or 0.2, the total numbers of detected events (>0.1 ΔF/F0) were expected to be 8.7, 4.76, or 1.67, with mean apparent amplitudes of 0.61, 0.35, or 0.17, respectively.
Figure 4.
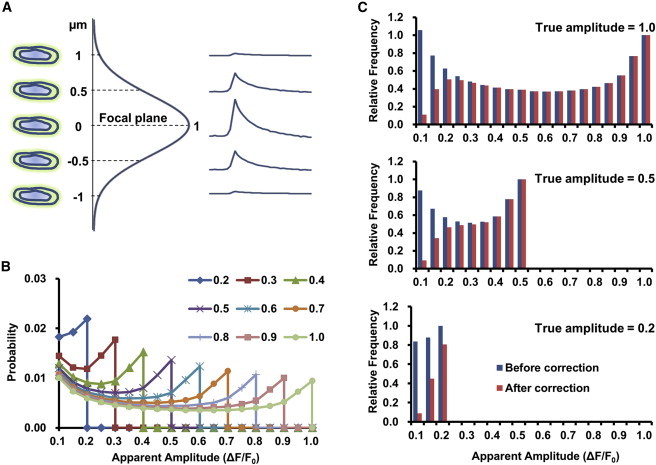
Confocal theory of superoxide flash amplitude measurement. (A) Apparent amplitude of a superoxide flash (right) is determined by the true amplitude, the confocal axial point-spread function (vertical curve; Gaussian function with a full width at half maximum of 1 μm), and the position of the flashing mitochondrion relative to the focal plane (left). (B) Apparent-amplitude distributions for confocal detection of randomly located, stereotypical flash events of designated true amplitudes. (C) Predicted apparent-amplitude histograms for events of true amplitudes equal to 1.0, 0.5, or 0.2, accounting (red bars) or not accounting (blue bars) for detection ability. Histograms were normalized to the true amplitude bins.
On the other hand, since the image acquisition (1 s interval in this study) was fast enough compared with the characteristic duration of superoxide flashes (10–20 s), our temporal resolution was sufficient to register nearly all superoxide flashes. Moreover, the apparent synchrony within the mitochondria during a flash suggests that intramitochondrial propagation or diffusion, if any, must occur on an even faster time scale. These conditions permitted confocal detection to faithfully track kinetic properties of superoxide flashes regardless of their location relative to the focal plane.
Superoxide flashes are highly polymorphic
Next, we analyzed the ensemble properties of 447 flashes, excluding those with a poor signal/noise ratio and those with sublevels in the rising phase (see below). The apparent amplitude of superoxide flashes displayed a broad and skewed distribution, with the faintest event being 0.07 and the brightest 1.13 (not shown) (Fig. 5 A). To estimate the true amplitude distribution corrected for optical blurring, we performed deconvolution according to confocal detection theory and the method detailed in the Supporting Material. In our approach, it was basically to solve a linear system to derive the coefficients of different base histograms shown in Fig. 4 B (see Supporting Material). After taking into consideration the effect of off-focus sampling, the frequency of high amplitude events was compensated, and the overall shape of the histogram was shifted rightward (Fig. 5 A). A conspicuous spike was found in the lowest bin, and it was highly sensitive to the detection ability function and PPV (data not shown), suggesting that it might be caused by inaccuracies in these two functions obtained using synthetic data. Clearly, the blurring-corrected amplitude of superoxide flashes was hardly one-sized. Consistent with this idea, large variability was also evident in the kinetics of superoxide flashes: the histogram of the rise time to 90% of peak amplitude displayed a mode at 2 s and a mean value of 3.5 s (Fig. 5 B), and the histogram of full duration at half-maximum exhibited a mode at 4 s and a prominent long decaying tail that extended up to >20 s (Fig. 5 C). Correlation analysis of the flash parameters revealed no strong interdependence between amplitude and kinetic parameters (Table S1). These data show that superoxide flashes are highly polymorphic in terms of amplitude and kinetics. That a flash duration can be as brief as 1–2 s also suggests that cpYFP is a fast reversible probe to track the superoxide flux.
Figure 5.

Characteristics of cardiac superoxide flashes. (A) Amplitude distribution of superoxide flashes, showing the apparent-amplitude (blue) and the true-amplitude distribution after correction of off-focus sampling. n = 447. See also Fig. 4 and the Supporting Material. (B and C) Histograms of rise time (B; n = 447) and duration of superoxide flashes (C; n = 432).
Ignition patterns of superoxide flashes
Intrigued by the aforementioned polymorphism of superoxide flashes, we investigated the rising kinetics of superoxide flashes in greater detail. Examination of individual time courses uncovered three distinct patterns of flash ignition: 1), an abrupt rise from quiescence to full excursion; 2), a rise with an exponential foot; or 3), a rise with a pedestal-like precursor (Fig. 6, A and B). All three ignition patterns were found in single, well-confined mitochondria (Fig. 6 A), suggesting that they are properties inherent to single mitochondria. Occasionally, synchronous type 3 superoxide flashes extending two to three sarcomeres were registered (Fig. S6, a type 3 event), suggesting functional coupling of mitochondria along the same intermyofibrillar band. The relative proportions of the three patterns were 44, 27, and 29%, respectively. Notably, the ignition patterns of superoxide flashes closely resembled those of action potentials in excitable cells. For instance, an abrupt upstroke of the action potential is seen with suprathreshold stimulation, whereas an exponential foot or a plateau of small depolarization before the upstroke of an action potential is often observed at near-threshold stimulation (24). These similarities strongly suggest that the genesis of a superoxide flash involves a regenerative or positive-feedback process, as is the case with action-potential production. Regardless of the ignition patterns, the average primary peaks and the entire descending time courses were nearly identical (Fig. 6 C). This result indicates that, once fully activated, the superoxide flash evolves and terminates in an autonomous manner.
Figure 6.
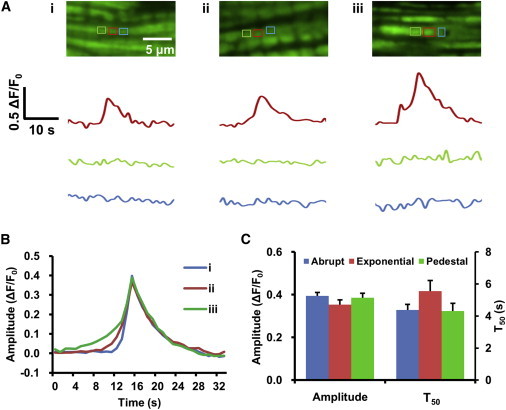
Distinctive patterns of superoxide flash ignition. (A) Typical examples of flashes with an abrupt rise (i), a rise with an exponential foot (ii), and a rise with a pedestal precursor (iii). Time courses of three neighboring mitochondria, outlined by boxes of different colors, are shown. (B) Averaged time courses for the three types of flashes, where n = 137, 72, and 89, respectively. Events were aligned by the peak. (C) Similar amplitudes and kinetics for different types of superoxide flashes.
In another set of cardiomyocytes, simultaneous measurement of the mitochondrial membrane potential (ΔΨm, indexed by TMRM fluorescence) revealed that mitochondrial ROS excitability was tightly interwoven with the electrophysiological excitability of the intracellular organelle. Specifically, transient ΔΨm depolarization developed concurrently during a flash (Fig. 7 A). Of particular notice, small and gradual depolarization mirrored the development of the exponential foot or pedestal precursor of a flash (Fig. 7, A and B). Sublevels in both ROS and electrophysiological excitation were clearly shown by the average traces of events aligned by the onset (Fig. 7 C). These results reinforce the idea that a regenerative process underlies concurrent ROS and electrical excitation of the mitochondria.
Figure 7.

Mitochondrial electrophysiological excitation during superoxide flashes. (A) Representative pairs of superoxide flashes and simultaneously measured ΔΨm depolarization. Data are for the three types of superoxide flash ignition defined in Fig. 6. Note the graded ΔΨm depolarization during the precursor and primary events. Note also the usually prolonged duration of the mitochondrial depolarization. (B) Serial images of the flash in A (iii) and companion TMRM signals. Image size, 1.63 × 1.28 μm2. (C) As in A, but showing averaged time courses. Events were aligned by the peak (types i and ii) or the takeoff point (type iii). n = 118, 76, and 94 for types i, ii, and iii, respectively.
Multiple units in some superoxide flashes
The data thus far revealed an interesting regime of mitochondrial ROS excitability: although the flash was autonomous and regenerative in nature, neither its amplitude nor its kinetics was stereotypical, in contrast to the all-or-none behavior of action potentials in excitable cells. The large variability may stem from stochastic recruitment of constituent units during the flash, given the limited quantity of channels or pores (e.g., mPTPs) in a tiny mitochondrion. To this end, a recent study has shown that Escherichia coli, a prokaryotic organism of physical dimensions similar to those of mitochondria, displays greater stochastic variability during electrical excitation (25). Another useful analogy is perhaps the Ca2+ spark, which reflects local Ca2+ excitability due to the collective openings of a limited number of channels in small organelles due to a positive feedback (i.e., the Ca2+-induced Ca2+ release) (19). Stochastic variation in the number of participating quantal units has been demonstrated for cardiac Ca2+ sparks (26) and precursor events to full-sized sparks have also been visualized in skeletal muscles (27).
To further characterize the stochastic properties of superoxide flash ignition, we investigated the properties of the precursors of the third type of flash (Fig. 8 A). The latency from the onset of a precursor to the onset of the corresponding primary flash followed a roughly decaying exponential distribution with τ ∼ 4.8 s (Fig. 8 B). The lack of events at latencies <4 s was not unexpected, because they would be classified as types 1 or 2. It is important to note that the amplitude ratio between the primary event versus the precursor was as high as 7.0, with a mean value of 2.0 (Fig. 8 C). Providing that flash amplitude increases linearly with the number of units activated (i.e., neglecting the effect of saturation) and the precursor consists of at least one unit, the lower-limit estimate of average or maximum units in a flash is three or eight, respectively. Taken together, our data strongly suggest that a superoxide flash consists of one or a few units that are activated in a stochastic and regenerative fashion.
Figure 8.
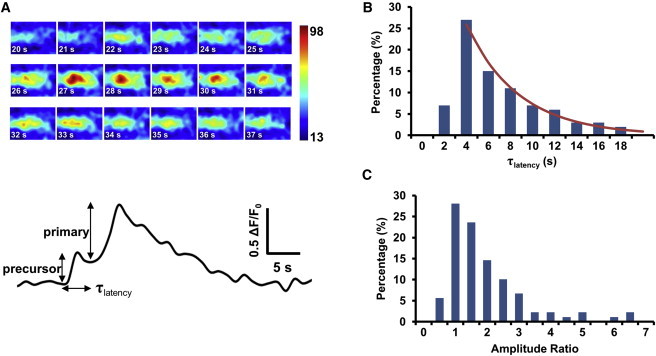
Properties of precursor and primary flashes. (A) Representative image series and corresponding time course of the occurrence of a primary flash after a pedestal precursor. (B) Histogram of the latency from precursor onset to takeoff of the primary flash (τlatency). Solid curve represents the exponential fit (τ = 4.8 s) to data at >4 s. (C) Histogram of the primary/precursor amplitude ratio. n = 89 events.
Discussion
Algorithm and theory of superoxide flash detection
Just as Ca2+ sparks constitute elemental Ca2+ release signals mediated by the ryanodine receptors in the sarcoplasmic reticulum, superoxide flashes represent elemental ROS production events triggered by transient openings of mPTPs in the mitochondria. The automated detection and measurement of Ca2+ sparks have significantly facilitated the characterization of spark properties, the discovery of spark ignition and termination mechanisms, and the quest for spark functions (22,28). Likewise, it is expected that development of the first generation of superoxide flash detector will similarly promote multifaceted investigations of this newly discovered mitochondrial ROS signaling event. However, significant differences between sparks and flashes make flash detection itself a challenge. Unlike Ca2+ sparks, which are usually recorded in linescan confocal imaging mode and are identified as signals above local noise in connected xt areas (28), superoxide flashes are events from xyt stack images and are confined to xy areas of individual mitochondria of variable shape and size. Our detection algorithm, FlashSniper, was therefore mainly based on two-dimensional feature maps, thresholding and segmentation. By using synthetic test data, we validated that our flash detector is both highly sensitive (50% detection at ΔF/F0 = 0.15) and reliable (90% PPV at ΔF/F0 = 0.12). It should be noted that the design of FlashSniper has exploited the fact that mitochondria in cardiomyocytes display little mobility on the timescale of data acquisition. In this regard, we look to the future for development of a flash detector generally applicable to other cell types with vigorous mitochondrial movement.
Two main results stemmed from theoretical considerations of the confocal detection of cardiac superoxide flashes. First, we developed a general theory and procedure to infer the true-amplitude distribution from the observed-amplitude histogram based on a priori knowledge of confocal PSF, detection function, and PPV. We found that for stereotyped events of random location, the apparent amplitude follows a rather flat distribution between the lower limit set by the detection ability and the upper limit set by the true amplitude per se. This result differs markedly from that for confocal linescan detection of Ca2+ sparks, in which the apparent amplitude distribution of stereotyped events follows a monotonically decaying function (28). This disparity arises from the fact that in the linescan (xt) detection of Ca2+ sparks, the number of surveyed events increases as a quadratic function of off-focus distance; by contrast, the number of surveyed superoxide flashes in the time-lapse frame imaging (xyt) mode increases only linearly with off-focus distance. Second, we showed that confocal detection introduces no kinetic distortion whatsoever if we assume a sufficiently high rate of image acquisition and a synchrony across the mitochondrion undergoing a flash. The latter assumption is supported by estimates of intramitochondrial diffusion time (≪1 s over a distance of 1 μm) and experimental data from ultrafast imaging of superoxide flashes in the giant mitochondrial networks of skeletal muscles in living mice (15). In contrast, the genesis of a Ca2+ spark involves Ca2+ diffusion in heavily buffered three-dimensional cytoplasm (i.e., a reaction-diffusion process). Thus, a spark exhibits variable local kinetics within a timescale comparable to its own lifetime (10–30 ms): the farther away from its origin, the slower the local Ca2+ transient develops and dissipates (29). The similarities and differences between Ca2+ spark and superoxide flash production enrich our understanding of the local control mechanisms of intracellular signal transduction.
Ignition of superoxide flashes is dominated by stochastic variability
A tenet of cellular electrophysiology states that the action potential behaves in an all-or-none fashion. However, the behavior of superoxide flashes in the cellular organelle mitochondria deviates from this tenet substantially. In particular, the optical blurring-corrected amplitude distribution and the distortion-free rise-time and duration distributions of superoxide flashes each spanned a broad range. The time courses of individual superoxide flashes were polymorphic, falling into three distinct patterns of ignition. In a search for the underlying mechanism for the large variability of superoxide flashes, we came to realize the sheer disparity in size between an excitable cell (e.g., a cardiomyocyte) and a mitochondrion and, hence, between the numbers of excitable units they each can harbor. Owing to their small peripheral membrane (1.0 μm2 for a cylindrical mitochondrion of length 1.5 μm and diameter 0.2 μm), where pores like mPTP are thought to reside (30), the number of channels or pores on a single mitochondrion must be very limited. Meanwhile, given the huge input resistance, the small capacitance expected for the inner membrane, the tiny volume, and the large surface/volume ratio of the mitochondrion, it takes only one or a few concerted channels or pores to cause substantial dissipation of ΔΨm and changes in matrix ionic concentrations or osmotic pressure. In other words, the biophysics of ROS and electrophysiological excitability of the organelle is likely dominated by stochastic fluctuations inherent in a system with a limited number of constituent units. Indeed, analysis of the ratio between the primary and precursor events further placed the lower-limit estimate of average or maximal mPTP units at three or eight, respectively. In sharp contrast, an action potential at the cellular level typically involves 104 or even more ionic channels. In this scenario, the broad distribution of flash amplitude reflects, at least partially, the recruitment of different numbers of mPTPs. The large dispersion of duration may partly stem from the variable latency and duration of individual mPTP openings. Further, the regenerative process should be less robust, as reflected by the frequently observed precursors or exponential feet. With this new insight, we propose that the recently reported swellings at discrete loci along filamentous mitochondria in HeLa cells (18) may reflect optical recording of single or a few mPTPs acting in concert.
If the above analogy between mitochondrial superoxide flashes and cellular action potentials is a little too obscure, two closer analogies of the superoxide flashes are the Ca2+ sparks, which reflect Ca2+ excitation of a small organelle (26), and the electrical spikes in E. coli, which reflect electrophysiological excitation of one of the smallest prokaryotic organisms (25). A common feature is that although an excitable system always involves a positive-feedback mechanism, stochastic variation is conspicuous because of the dominance of the behavior of individual units when only a limited number of constituent units are involved.
Mitochondrial ROS excitation is tightly interwoven with mitochondrial electrophysiological excitability. Simultaneous measurement of ΔΨm revealed that dissipation of the mitochondrial membrane potential coincides with superoxide flashes, in agreement with previous reports (14,15,17). Interestingly, we resolved that graded, small mitochondrial depolarization develops during the precursor and the exponential foot of the flash. This observation further reinforces the notion that mitochondrial depolarization during a superoxide flash represents the concerted activation of multiple channels or pores.
If more than one mPTP is involved in the genesis of a superoxide flash as well as the mitochondrial electrical excitation, what is the mechanism that underlies regenerative mPTP activation? Since mPTP gating is both voltage-dependent (31) and ROS-sensitive (32), we hypothesize that mitochondrial depolarization and ROS production from previous mPTP openings may result in collective mPTP openings, forming the positive feedback for excitability. The trigger for the very first mPTP could be the basal low-flux superoxide production of the ETC, because the frequency of superoxide flashes is sensitive to both the superoxide scavenger Tiron and the SOD mimetics TMPyP (14,18). In this scenario, the previously reported ROS-induced-ROS-release (RIRR) mechanism (11,33) can operate at the single-mitochondrion level for physiological ROS signaling. However, since mPTP is at the converging juncture of many signals (pH, ATP, Ca2+), much is to be learnt about whether other factors act independently or synergistically in triggering spontaneous superoxide flashes. It also remains to be determined how the opening of mPTP instigates the bursting production of mitochondrial ROS. In this regard, a recent report on the bistability of ROS production at Complex III may provide an interesting candidate mechanism (34).
Superoxide flashes: elemental events underlying mitochondrial ROS signaling
Superoxide flashes represent microdomain ROS signals visualized in intact cells, in the ex vivo beating heart, and in living animals. The very existence of superoxide flashes strongly indicates that mitochondrial ROS are neither static nor simply unwanted side products of energy metabolism. Rather, they are dynamic, actively produced signals reflecting the excitation of the mitochondrial ROS metabolic system. In resting cardiomyocytes, the different groups of mitochondria exhibit similar flash frequency, suggesting that at population level, they are functionally uniform. However, individual mitochondrial flashes possess huge variations in amplitude and kinetics, possibly involving different numbers of units (e.g., the number of triggered openings of mPTP units recruited for superoxide production). As in elemental Ca2+ signaling events, this local control of mitochondrial ROS signaling may be physiologically important. First, it allows the transient and confined ROS hotspots to be formed locally throughout the cell; the whole of the ROS microdomain then serves as an essential regulatory mechanism that tames the highly bioreactive ROS as messengers while evading the damage of sustained or global ROS exposure. Second, the tight coupling between mitochondrial ROS and electrical excitability is indicative of the self-regulation and integration of multiple mitochondrial functions at the level of individual mitochondria. Indeed, emerging evidence has shown that the spatiotemporal regulation of individual mitochondrial ROS and electrical excitability impacts cellular functions such as cell metabolism, oxidative stress, and apoptotic signaling (15–18).
In summary, we have developed a what to our knowledge is a first-generation algorithm for automated superoxide flash analysis with satisfactory sensitivity and reliability. The development of confocal theory of superoxide flash detection further enabled us to derive an optical blurring-corrected amplitude distribution of superoxide flashes from time-lapse imaging data. We propose that the biophysics of mitochondrial ROS and electrophysiological excitability is dominated by stochastic, autonomous recruitment of a limited number of constituent units (e.g., mPTPs) in single mitochondria. This working hypothesis accounts for the distinct patterns of ignition, the broad amplitude distribution, and the polymorphic kinetics of superoxide flashes in cardiomyocytes. These results shed new light on the nature and mechanism of superoxide flashes and lay a foundation for investigating local mitochondrial ROS signaling in cardiomyocytes and other cell types.
Acknowledgments
We thank Dr. Iain C. Bruce of Peking University for helpful discussion and critical comments.
This work was supported by the National Basic Research Program of China (2007CB512100 and 2011CB809102), the National Science Foundation of China (31130067, 30900264, 30800371, and 10825208), the National Institutes of Health, and the American Heart Association (10SDG3450009).
Contributor Information
Wenchang Tan, Email: tanwch@mech.pku.edu.cn.
Heping Cheng, Email: chengp@pku.edu.cn.
Supporting Material
References
- 1.Turrens J.F. Mitochondrial formation of reactive oxygen species. J. Physiol. 2003;552:335–344. doi: 10.1113/jphysiol.2003.049478. [DOI] [PMC free article] [PubMed] [Google Scholar]
- 2.Weiss J.N., Korge P., Ping P. Role of the mitochondrial permeability transition in myocardial disease. Circ. Res. 2003;93:292–301. doi: 10.1161/01.RES.0000087542.26971.D4. [DOI] [PubMed] [Google Scholar]
- 3.Honda H.M., Korge P., Weiss J.N. Mitochondria and ischemia/reperfusion injury. Ann. N. Y. Acad. Sci. 2005;1047:248–258. doi: 10.1196/annals.1341.022. [DOI] [PubMed] [Google Scholar]
- 4.Andersen J.K. Oxidative stress in neurodegeneration: cause or consequence? Nat. Med. 2004;10(Suppl):S18–S25. doi: 10.1038/nrn1434. [DOI] [PubMed] [Google Scholar]
- 5.Erickson J.R., Joiner M.L., Anderson M.E. A dynamic pathway for calcium-independent activation of CaMKII by methionine oxidation. Cell. 2008;133:462–474. doi: 10.1016/j.cell.2008.02.048. [DOI] [PMC free article] [PubMed] [Google Scholar]
- 6.Kamata H., Honda S., Karin M. Reactive oxygen species promote TNFα-induced death and sustained JNK activation by inhibiting MAP kinase phosphatases. Cell. 2005;120:649–661. doi: 10.1016/j.cell.2004.12.041. [DOI] [PubMed] [Google Scholar]
- 7.Owusu-Ansah E., Banerjee U. Reactive oxygen species prime Drosophila haematopoietic progenitors for differentiation. Nature. 2009;461:537–541. doi: 10.1038/nature08313. [DOI] [PMC free article] [PubMed] [Google Scholar]
- 8.Niethammer P., Grabher C., Mitchison T.J. A tissue-scale gradient of hydrogen peroxide mediates rapid wound detection in zebrafish. Nature. 2009;459:996–999. doi: 10.1038/nature08119. [DOI] [PMC free article] [PubMed] [Google Scholar]
- 9.Chance B., Sies H., Boveris A. Hydroperoxide metabolism in mammalian organs. Physiol. Rev. 1979;59:527–605. doi: 10.1152/physrev.1979.59.3.527. [DOI] [PubMed] [Google Scholar]
- 10.Romashko D.N., Marban E., O'Rourke B. Subcellular metabolic transients and mitochondrial redox waves in heart cells. Proc. Natl. Acad. Sci. USA. 1998;95:1618–1623. doi: 10.1073/pnas.95.4.1618. [DOI] [PMC free article] [PubMed] [Google Scholar]
- 11.Zorov D.B., Filburn C.R., Sollott S.J. Reactive oxygen species (ROS)-induced ROS release: a new phenomenon accompanying induction of the mitochondrial permeability transition in cardiac myocytes. J. Exp. Med. 2000;192:1001–1014. doi: 10.1084/jem.192.7.1001. [DOI] [PMC free article] [PubMed] [Google Scholar]
- 12.Vercesi A.E., Kowaltowski A.J., Castilho R.F. The role of reactive oxygen species in mitochondrial permeability transition. Biosci. Rep. 1997;17:43–52. doi: 10.1023/a:1027335217774. [DOI] [PubMed] [Google Scholar]
- 13.Duchen M.R. Mitochondria and Ca2+ in cell physiology and pathophysiology. Cell Calcium. 2000;28:339–348. doi: 10.1054/ceca.2000.0170. [DOI] [PubMed] [Google Scholar]
- 14.Wang W., Fang H., Cheng H. Superoxide flashes in single mitochondria. Cell. 2008;134:279–290. doi: 10.1016/j.cell.2008.06.017. [DOI] [PMC free article] [PubMed] [Google Scholar]
- 15.Fang H., Chen M., Cheng H. Imaging superoxide flash and metabolism-coupled mitochondrial permeability transition in living animals. Cell Res. 2011;21:1295–1304. doi: 10.1038/cr.2011.81. [DOI] [PMC free article] [PubMed] [Google Scholar]
- 16.Pouvreau S. Superoxide flashes in mouse skeletal muscle are produced by discrete arrays of active mitochondria operating coherently. PLoS One. 2010;5:e13035. doi: 10.1371/journal.pone.0013035. [DOI] [PMC free article] [PubMed] [Google Scholar]
- 17.Wei L., Salahura G., Dirksen R.T. Mitochondrial superoxide flashes: metabolic biomarkers of skeletal muscle activity and disease. FASEB J. 2011;25:3068–3078. doi: 10.1096/fj.11-187252. [DOI] [PMC free article] [PubMed] [Google Scholar]
- 18.Ma Q., Fang H., Cheng H. Superoxide flashes: early mitochondrial signals for oxidative stress-induced apoptosis. J. Biol. Chem. 2011;286:27573–27581. doi: 10.1074/jbc.M111.241794. [DOI] [PMC free article] [PubMed] [Google Scholar]
- 19.Cheng H., Lederer W.J., Cannell M.B. Calcium sparks: elementary events underlying excitation-contraction coupling in heart muscle. Science. 1993;262:740–744. doi: 10.1126/science.8235594. [DOI] [PubMed] [Google Scholar]
- 20.Muller F.L. A critical evaluation of cpYFP as a probe for superoxide. Free Radic. Biol. Med. 2009;47:1779–1780. doi: 10.1016/j.freeradbiomed.2009.09.019. [DOI] [PubMed] [Google Scholar]
- 21.Huang Z., Zhang W., Wang W. Response to “A critical evaluation of cpYFP as a probe for superoxide”. Free Rad. Biol. Med. 2011;51:1937–1940. doi: 10.1016/j.freeradbiomed.2011.08.024. [DOI] [PubMed] [Google Scholar]
- 22.Bányász T., Chen-Izu Y., Izu L.T. A new approach to the detection and statistical classification of Ca2+ sparks. Biophys. J. 2007;92:4458–4465. doi: 10.1529/biophysj.106.103069. [DOI] [PMC free article] [PubMed] [Google Scholar]
- 23.Palmer J.W., Tandler B., Hoppel C.L. Heterogeneous response of subsarcolemmal heart mitochondria to calcium. Am. J. Physiol. 1986;250:H741–H748. doi: 10.1152/ajpheart.1986.250.5.H741. [DOI] [PubMed] [Google Scholar]
- 24.Aidley D.J. Cambridge University Press; New York: 1998. The Physiology of Excitable Cells. [Google Scholar]
- 25.Kralj J.M., Hochbaum D.R., Cohen A.E. Electrical spiking in Escherichia coli probed with a fluorescent voltage-indicating protein. Science. 2011;333:345–348. doi: 10.1126/science.1204763. [DOI] [PubMed] [Google Scholar]
- 26.Wang S.Q., Stern M.D., Cheng H. The quantal nature of Ca2+ sparks and in situ operation of the ryanodine receptor array in cardiac cells. Proc. Natl. Acad. Sci. USA. 2004;101:3979–3984. doi: 10.1073/pnas.0306157101. [DOI] [PMC free article] [PubMed] [Google Scholar]
- 27.Shirokova N., Ríos E. Small event Ca2+ release: a probable precursor of Ca2+ sparks in frog skeletal muscle. J. Physiol. 1997;502:3–11. doi: 10.1111/j.1469-7793.1997.003bl.x. [DOI] [PMC free article] [PubMed] [Google Scholar]
- 28.Cheng H., Song L.S., Stern M.D. Amplitude distribution of calcium sparks in confocal images: theory and studies with an automatic detection method. Biophys. J. 1999;76:606–617. doi: 10.1016/S0006-3495(99)77229-2. [DOI] [PMC free article] [PubMed] [Google Scholar]
- 29.Smith G.D., Keizer J.E., Cheng H. A simple numerical model of calcium spark formation and detection in cardiac myocytes. Biophys. J. 1998;75:15–32. doi: 10.1016/S0006-3495(98)77491-0. [DOI] [PMC free article] [PubMed] [Google Scholar]
- 30.Zoratti M., Szabò I. The mitochondrial permeability transition. Biochim. Biophys. Acta. 1995;1241:139–176. doi: 10.1016/0304-4157(95)00003-a. [DOI] [PubMed] [Google Scholar]
- 31.Scorrano L., Petronilli V., Bernardi P. On the voltage dependence of the mitochondrial permeability transition pore. A critical appraisal. J. Biol. Chem. 1997;272:12295–12299. doi: 10.1074/jbc.272.19.12295. [DOI] [PubMed] [Google Scholar]
- 32.McStay G.P., Clarke S.J., Halestrap A.P. Role of critical thiol groups on the matrix surface of the adenine nucleotide translocase in the mechanism of the mitochondrial permeability transition pore. Biochem. J. 2002;367:541–548. doi: 10.1042/BJ20011672. [DOI] [PMC free article] [PubMed] [Google Scholar]
- 33.Aon M.A., Cortassa S., O'Rourke B. Synchronized whole cell oscillations in mitochondrial metabolism triggered by a local release of reactive oxygen species in cardiac myocytes. J. Biol. Chem. 2003;278:44735–44744. doi: 10.1074/jbc.M302673200. [DOI] [PubMed] [Google Scholar]
- 34.Selivanov V.A., Votyakova T.V., Cascante M. Bistability of mitochondrial respiration underlies paradoxical reactive oxygen species generation induced by anoxia. PLOS Comput. Biol. 2009;5:e1000619. doi: 10.1371/journal.pcbi.1000619. [DOI] [PMC free article] [PubMed] [Google Scholar]
Associated Data
This section collects any data citations, data availability statements, or supplementary materials included in this article.