

Abstract
The formation of the basoapical polarity axis in epithelia is critical for maintaining the homeostasis of differentiated tissues. Factors that influence cancer development notoriously affect tissue organization. Apical polarity appears as a specific tissue feature that, once disrupted, would facilitate the onset of mammary tumors. Thus, developing means to rapidly measure apical polarity alterations would greatly favor screening for factors that endanger the breast epithelium. A Raman scattering-based platform was used for label-free determination of apical polarity in live breast glandular structures (acini) produced in three-dimensional cell culture. The coherent anti-Stokes Raman scattering signal permitted the visualization of the apical and basal surfaces of an acinus. Raman microspectroscopy subsequently revealed that polarized acini lipids were more ordered at the apical membranes compared to basal membranes, and that an inverse situation occurred in acini that lost apical polarity upon treatment with Ca2+-chelator EGTA. This method overcame variation between different cultures by tracking the status of apical polarity longitudinally for the same acini. Therefore, the disruption of apical polarity by a dietary breast cancer risk factor, ω6 fatty acid, could be observed with this method, even when the effect was too moderate to permit a conclusive assessment by the traditional immunostaining method.
Introduction
With advantages over conventional two-dimensional cell culture models that they provide by mimicking tissue-specific architectures and functions, three-dimensional (3D) cell culture models have been increasingly used in a broad range of research, including epithelial morphogenesis, tumor biology, cell migration, regenerative medicine, and drug screening (1–3). In particular, increased knowledge in mammary gland morphogenesis and neoplastic transformation has been obtained from studies using 3D culture of different types of mammary epithelial cells that take into account alterations in tissue architecture (i.e., the specific cellular organization within an assembly of cells) to decipher the mechanisms that control cell proliferation, survival, differentiation, and resistance to chemotherapeutic drugs (4–14). However, a wide implementation of the evolving paradigm of physiologically relevant 3D culture has been hampered by the lack of proper visualization tools to study tissue phenotypes. A tremendous challenge to quantitatively measure cellular responses in 3D cultures by conventional fluorescence microscopy is the inefficient diffusion of fluorescent dyes in thick tissue samples (2) and the fluorescent background triggered by the extracellular matrix used as cell culture substratum (15). Continuous analyses of cellular responses over periods of time are limited to brightfield microscopy and the occasional GFP-tagged expression of a specific protein. Therefore, innovations in label-free analysis of cellular responses are crucial to fully exploit the benefits of 3D cultures.
An important area of investigation is the alteration of tissue architecture that precedes tumor development. Inhibiting or reversing such alterations would play a key role in the design of prevention interventions that are so much needed. A number of factors that favor cancer development have been associated with changes in tissue architecture. Indeed, epidemiological and/or animal studies reported that estrogen and a high fat diet (16), as well as obesity (17) and alcohol consumption (18) could modify mammary morphogenesis (notably the density of epithelial structures, a factor known to influence breast cancer risk).
Models that mimic phenotypically normal breast glandular differentiation exist and have been used to unravel pathways involved in the initiation of tumors. Cells are cultured in the presence of Engelbreth-Holm-Swarm (EHS)-derived extracellular matrix, which resembles a basement membrane, and functionally reproduce mammary glandular structures (acini) with, for certain cell lines like the HMT-3522 S1, complete tissue polarity axis (9,14,15). This axis largely determines the functional integrity of epithelia and includes both apical polarity and basal polarity (11,19,20). Basal polarity is determined by the presence of specific cell-basement membrane contacts (11). Apical polarity is characterized by the polarized distribution of cytoplasmic organelles (20–23) and the segregation and retention of specific proteins and lipids in distinct apical membrane (ApM) and basal membrane (BaM) domains due to the presence of apical tight junctions (24,25). Functionally, the BaM facing the extracellular compartment maintains differentiation and survival, whereas the ApM facing the luminal (external) compartment mediates physiological states (e.g., quiescence) and exchange functions (e.g., absorption and secretion) (20). Tight junctions are formed by transmembrane proteins connected to cytoplasmic proteins at the most apical side of cell-cell junctions (26,27). The redistribution of tight junction proteins away from apical sites is an indicator of the disruption of apical polarity (28–30). Of importance, proteins normally located at the apical junctional complex have been implicated in the control of tumor development (14,31). Moreover, loss of apical polarity is necessary for cell cycle entry, and is one of the earliest changes observed in tissue architecture in breast neoplasia (12,14,32). Interestingly, smoking, the key factor in the development of lung cancer, has been shown to alter apical polarity in the lung epithelium (33). Therefore, the status of tissue polarity constitutes a critical readout to assess epithelial integrity and homeostasis.
Currently, immunofluorescence imaging of fixed cell culture for apical polarity markers is needed to determine the status of apical polarity. This method prevents dynamic screening of factors that could control epithelial homeostasis. Furthermore, the percentage of apically polarized mammary acini in 3D culture varies from 60% to 80% (12,32,34). Consequently, loss of apical polarity in a small, yet significant fraction of the acini population might be easily blurred by variation between different cultures. Thus, a large number of acini have to be analyzed to achieve statistical significance, which implies ineffectiveness of the current immunostaining method.
In polarized epithelial cells, not only proteins but also lipids are differentially distributed on apical and basal membranes (22,23). The ApM is strongly enriched in sphingolipids, which, together with cholesterol, form continuous liquid-ordered assemblies with restricted mobility. In contrast, the BaM has less raft coverage and thus, is in a less ordered phase (22,23). Different degrees of lipid ordering have been shown to produce distinct Raman spectral profiles in live tissues (35–37), which opens the possibility for applying this method to 3D cultures of mammary acini.
As a noninvasive and label-free analytical method, Raman spectroscopy has been widely used in biomedical research (38). In particular, the analysis of lipid composition by Raman spectroscopy is well established in the skin (37), eye lens (36), and nerve fibers (39). Since the first measurement of living cells (40), Raman spectroscopy has been extensively applied to quantitative studies of biological systems (41–43). However, the application of Raman scattering to high-speed biological imaging is hindered by the very weak spontaneous Raman signals. To enhance the signal level, coherent anti-Stokes Raman scattering (CARS) microscope has been developed (44). By focusing the excitation energy on the single Raman band and coherent addition of the scattering field, single-frequency CARS microscopy has been employed to visualize lipid-rich structures, including cellular membranes, myelin sheath, and adipocytes, at the speed of a few microseconds per pixel, on a laser-scanning microscope platform (45–47). To offer spectral information, multiplex CARS microscopy using a narrowband and a broadband pulse has been developed (48,49) and applied to the study of lipid droplets in 3T3-L1 cells at a speed of 20 ms per pixel (50,51). Another important development is hyperspectral CARS enabled by automatic wavelength scanning of a picosecond laser (52).
To fully appreciate the potential of high-speed vibrational imaging by CARS and quantitative spectral analysis by spontaneous Raman, Cheng and co-workers developed a compound Raman microscope that couples fast CARS imaging of a live biological sample with confocal Raman spectral analysis at points of interest (53). The compound Raman microscope has been applied to quantitative analysis of lipid droplets in live cells, tissues, and model organisms (53,54).
In this work, we present a new, to our knowledge, application of compound Raman microscopy to label-free analysis of live cell membranes in 3D culture. Specifically, we investigate how lipid ordering of ApM and BaM could be used to characterize apical polarity in live mammary acini. We took advantage of a high-throughput cell culture technique that permits the formation of acini in the presence of diluted EHS on a glass surface (32), enabling direct microscopic evaluation of apical polarity. We note that cell morphology and organization in 3D culture are completely different from those in flat monolayer culture. The cells in the acini tightly adhere together to form ball-like ApM and BaM, with a diameter of 5 and 30 μm, respectively. This feature allowed acquisition of confocal Raman spectra of ApM and BaM with lateral resolution around 0.4 μm and axial resolution around 4 μm. By fast CARS imaging followed by confocal Raman spectroscopy of membranes at the equatorial plane of live acini, we show that the relative degree of lipid ordering of ApM compared with BaM effectively distinguishes polarized (P) and nonpolarized (Non-P) mammary epithelia with high sensitivity and specificity. This method offers valuable opportunities for the study of environmental factors that influence epithelial homeostasis.
Materials and Methods
3D culture of human mammary acini
As described in (32) for the protocol of high-throughput 3D culture, nonneoplastic human mammary epithelial HMT-3522 S1 cells were cultured in the presence of 5% EHS material from Matrigel (BD Bioscience, Bedford, MA). The detailed materials and methods for our high-throughput 3D culture can be found in Supplementary Materials and Methods in the Supporting Material.
Treatment with disruptors of apical polarity was applied upon acini formation. Incubation with 1.5 mM EGTA began from day 10 and lasted for 24 h, a time frame shown to effectively disrupt apical polarity in the majority of mammary acini (12). Treatment with 60 μM arachidonic acid (AA) (Cayman Chemical, Ann Arbor, MI) was performed from day 8 to day 12 of 3D culture. As shown in Fig. S1 in the Supporting Material, we were able to track the same mammary acini undergoing treatment, in gridded glass-bottom culture dishes, by transmission and CARS imaging.
Immunostaining
Immunofluorescence staining of cells in 3D culture was performed as previously described (34). Details can be found in Supplementary Materials and Methods.
Compound Raman microscopy and spectrum analysis
A compound Raman microscope, which integrates CARS and confocal Raman microspectroscopy on the same platform, was used for label-free analysis of apical polarity. The detailed methods for our compound Raman microscope can be found in Supplementary Materials and Methods. Briefly, two synchronized laser oscillators (pump: 707 nm; Stokes: 885 nm) are temporally synchronized and collinearly combined into a laser scanning inverted microscope. Combined beams were focused into the specimen through a 60× water immersion objective, and the forward CARS signal was then collected by an air condenser, transmitted through a 600/65 nm bandpass filter, and detected by a photomultiplier tube. Average acquisition time for a 512 × 512 pixels CARS image was 1.12 s, and the combined Stokes and pump laser power at the specimen was kept constant at 40 mW. The pump laser-induced Raman scattering signal was directed toward the spectrometer to permit spectral analysis from 900 to 3100 cm−1, with an axial resolution of ∼4 μm and a lateral resolution of ∼0.4 μm. Each Raman spectrum was acquired in 10 s, and pump laser power at the specimen was maintained at 15 mW. No tissue damage was observed.
For Raman analysis, details can be found in the Supplemental Materials and Methods. Briefly, the glass contribution and fluorescence background were first removed from the Raman spectra taken on the cells. For a better comparison of spectral patterns, each Raman spectrum was then normalized by dividing by the peak intensity of the band around 2935 cm−1 over the spectral range 2770–3070 cm−1. The normalized Raman spectra were then least-squares fitted as a sum of seven Lorentzian bands (49).
where w is the wavenumber, Aj is the area under the jth band, Γj is the width, and Ωj is the center wavenumber of the jth band. Peak wavenumbers and widths for curve fitting are listed in Table S1. The corresponding assignments of Raman peaks are listed in Table S2 (39,55).
For Raman analysis of membrane lipid ordering, CARS microscopy was first used to visualize cell membranes of live mammary acini. Details about how to determine the location of the ApM and BaM can be found in the Supplemental Materials and Methods. The intense bands around 2850 and 2885 cm−1 have been assigned to symmetric and asymmetric CH2 stretching, respectively. The band around 2885 cm−1 is markedly enhanced by Fermi resonance in ordered lipid packing, whereas the band around 2850 cm−1 is not affected by structural changes of the lipid hydrocarbon chains (36,37,55). Thus, the degree of lipid ordering can be represented by the ratio between the areas under Raman bands at 2885 cm−1 (A2885) and 2850 cm−1 (A2850), A2885/A2850 (R) (36,37,55). ApM_R (or BaM_R) was the degree of lipid ordering of ApM (or of BaM). A ratio ApM_R/BaM_R was defined to represent the relative degree of lipid ordering of ApM compared with that of BaM. To illustrate the ability of the ratio ApM_R/BaM_R to differentiate between P and Non-P mammary acini, a receiver operating characteristic (ROC) curve was generated by plotting sensitivity versus (1-specificity) and the area under curve (AUC) was calculated. Based on the ROC curve, the best cutoff of ApM_R/BaM_R was determined.
Statistical analysis
Student's t-test was used to 1), compare the degree of lipid ordering (R) of ApM and that of BaM for P and Non-P mammary acini, respectively; 2), compare the ratio ApM_R/BaM_R of P mammary acini and that of Non-P mammary acini; and 3), compare the ApM_R (or BaM_R) of P mammary acini and that of Non-P mammary acini. p < 0.05 was considered statistically significant. The exact p-values are shown in the corresponding figure captions.
Results and Discussion
Because CARS permits selective imaging of lipid-rich structures, it was used to visualize the ApM and BaM in the equatorial plane of live mammary acini. Substantial CARS signals arose from the lipid-rich ApM and BaM of the mammary acinus, whereas weak CARS signals came from the lipid-poor cell nucleus (Fig. 1, A–C). This strong contrast easily distinguished, in a label-free manner, the different compartments of individual cells that form the single-layered epithelium. Considerable CARS signals also arose from the cytoplasmic space, possibly due to lipid-rich organelles such as endothelium reticulum, lipid droplets, and mitochondria. An important characteristic of the morphogenesis of acinar structures is the narrower width of the apical pole compared to the basal pole of cells (32). This characteristic was clearly outlined by CARS (Fig. 1 C). Confocal Raman microspectroscopy was further used to analyze lipid phases of ApM and BaM. As shown in Fig. S2, both ApM and BaM are present within the axial resolution of confocal Raman microspectroscopy (∼4μm). Although the fingerprint regions on Raman spectra of ApM and BaM (Fig. S3) did not show a clear difference due to the low signal/noise ratio, the C-H stretching regions were very distinct (Fig. 1 D), indicating unique compositions of these cellular compartments. Moreover, based on the Lorentzian curve fitting, the degrees of lipid ordering represented by the ratio between the areas under Raman bands at 2885 cm−1 (A2885) and at 2850 cm−1 (A2850), A2885/A2850 (R), were different among ApM, BaM, cytoplasm, and nucleus (Fig. 1, E–H). In particular, R was much higher in ApM relative to BaM in the majority of P acini (n = 40) (Fig. 1 I). The polarized status was confirmed by the apical location of ZO-1 (Fig. 1 J). These results indicate that in the 3D acini, we are able to obtain distinctive Raman spectra from ApM and BaM, which are visualized by CARS. Moreover, the degree of lipid ordering, quantified by the ratio A2885/A2850 (R), is different between ApM and BaM.
Figure 1.
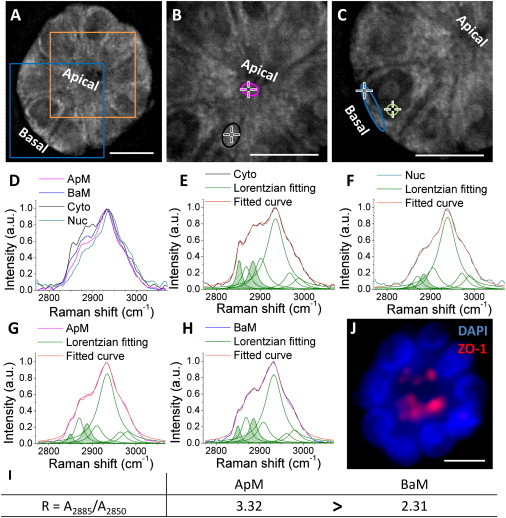
Label-free analysis of lipids in polarized mammary acini. (A) CARS image of a mammary acinus with apical and basal poles. (B) CARS image of the orange square in A shown at higher magnification. Crosses within purple and black circles, which indicate ApM and cytoplasmic regions of the cell, respectively, are the positions for confocal Raman spectral measurement. (C) CARS image of the blue square in A shown at higher magnification. Crosses within blue and green circles, which indicate BaM and nucleus regions of the cell, respectively, are the positions for confocal Raman spectral measurement. (D) Normalized Raman spectra of regions within ApM (purple line), BaM (blue line), cytoplasm (Cyto, black line), and nucleus (Nuc, green line). (E–H) Lorentzian curve fitting for Raman spectra of ApM, BaM, Cyto, and Nuc. Original spectra are shown in the same color as in D. The Lorentzian fitting curves are shown in green. The areas under Raman bands around 2850 and 2885 cm−1 are highlighted with green stripes. The cumulative fitted curves are shown in orange. (I) Ratio A2885/A2850 (R) for ApM and BaM (R for Cyto equals 1.56, and R for Nuc equals 4.11). (J) Fluorescence image of the mammary acinus in A labeled for apical polarity marker ZO-1(red) and DNA (DAPI, blue; nine nuclei are seen in this focal plane). Scale bars, 10 μm.
To induce a significant loss of apical polarity in the acini population, 10-day 3D cultures were incubated with 1.5 mM EGTA as shown previously (12). Note that EGTA does not affect membrane lipid ordering (R) in mammary epithelial cells (S1 cells in 3D culture on day 1) before apical polarity has been formed (Fig. S4). Raman spectra were then recorded for the Non-P mammary acini (i.e., with nonapically concentrated ZO-1 staining) from EGTA-treated cultures (usually >90% of acini are not apically polarized after EGTA treatment) and from control cultures (usually ∼25% of acini are not apically polarized in routine 3D culture) (Fig. 2). Breast epithelial cells treated with EGTA became round due to the loosening of cell-cell contacts, which leads to acini with a bumpy outer contour (Fig. 2 B, Movies S1–S3). This morphology was in contrast with the control population in which acini usually had a smooth circumference regardless of their polarity status (compare Fig. 1 A to Fig. 2 A). Yet, lipid ordering (R) was consistently lower in ApM compared to BaM in Non-P mammary acini regardless of the change in cell shape, indicating that disruption of apical polarity per se is sufficient to show the reorganization of lipids (Fig. 2).
Figure 2.
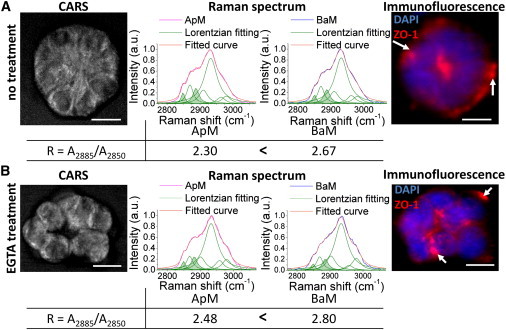
Label-free analysis of lipids in nonpolarized mammary acini. Shown are the CARS image, the Raman spectra of ApM and BaM with Lorentzian fitting, the ratio A2885/A2850 (R) for ApM and BaM, and immunofluorescence labeling for ZO-1(red; arrows indicate the presence of ZO-1 at the basal side of the acinus) for a Non-P mammary acinus in the control group (A) and a Non-P mammary acinus in the EGTA-treated group (B). Nuclei are counterstained with DAPI (blue). Scale bars, 10 μm.
To confirm that lipid ordering (R) was statistically different between ApM and BaM in both P and Non-P mammary acini, it was analyzed in 40 P and 40 Non-P mammary acini. Indeed, lipid ordering was significantly higher in ApM compared to BaM for P mammary acini, whereas it was significantly lower in ApM compared to BaM for Non-P mammary acini (Fig. 3 A). The result for P mammary acini is consistent with chromatography analysis of the lipid composition of polarized intestinal cells that shows more ordered lipids within ApM than within BaM (22,23,56). In addition, lipid ordering (R) was significantly higher for the ApM of P mammary acini compared to that of Non-P mammary acini, and significantly lower for the BaM of P mammary acini compared to that of Non-P mammary acini. The alterations in membrane lipid ordering in Non-P mammary acini compared to P mammary acini might be due to the disruption of tight junctions, which leads to improper sorting of membrane lipids including cholesterol and sphingolipids. Although the specific lipid compositions of ApM and BaM remain to be investigated, the lipid ordering shows potential to distinguish P and Non-P mammary acini (Fig. 3 A). To differentiate P and Non-P mammary acini with both high sensitivity and specificity, the lipid ordering ratio, ApM_R/BaM_R, was analyzed. This ratio represents the relative degree of lipid ordering of ApM (ApM_R) compared with that of BaM (BaM_R). Raman scans from different ApM and BaM locations inside an acinus (P or Non-P acinus) did not produce statistically different lipid ordering ratios (Fig. S5). Importantly, the lipid ordering ratio was significantly higher for P mammary acini compared to Non-P mammary acini with much smaller p-value than that obtained from the comparison of these same populations based solely on ApM_R or on BaM_R (Fig. 3 B). This result suggests that P and Non-P mammary acini can be distinguished with higher statistical significance when using the lipid ordering ratio compared to the ratio R for the ApM or for the BaM.
Figure 3.
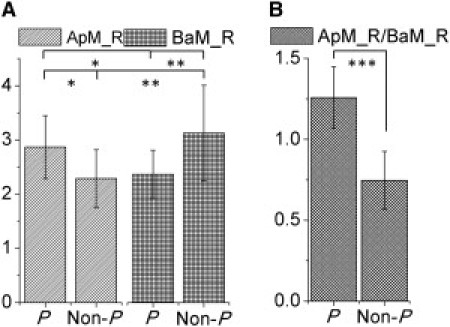
Distinction between ApM and BaM in polarized and nonpolarized acini. (A) Comparison of the ratio A2885/A2850 (R) in ApM and BaM regions for both P mammary acini and Non-P mammary acini. (B) Comparison of the relative lipid ordering ratio ApM_R/BaM_R in P mammary acini and Non-P mammary acini. (Student's t-test, ∗p < 5.0E-5, ∗∗p < 1.0E-5, ∗∗∗p = 4.0E-20, n = 40 acini).
The ratio of the symmetric C-H stretching mode intensities (peak height), I2885/I2850 (R′), is a well accepted representation of the packing order of acyl chains (36,37,39,57). However, multiple peaks overlap within the C-H stretching region, which may cause inaccuracy when using peak height to calculate lipid ordering. Therefore, in the results presented previously we have used Lorentian fitting to obtain peak areas for each Raman bands, and we have represented lipid ordering by the ratio of the areas R. The fitting results including parameters, statistics, and residuals can be found in Table S3 and Fig. S6. To compare our results with previous work that used R′ (37,57), we also calculated R′ for the same 40 P and 40 Non-P acini used for R calculation in Fig. 3. R′ fell mainly between 1.5 and 2 (for liquid R′ equals 0.7, and for crystal it equals 2.2 (37,57)) and showed the same trends as with R (compare Fig. 3 to Fig. S7). However, the p-values obtained from R′ calculations were greater than those obtained from R calculations, suggesting that R would perform better in distinguishing P and Non-P acini.
To determine the ability of the lipid ordering ratio, ApM_R/BaM_R, to distinguish P from Non-P mammary acini, the histogram of the number of acini was plotted as a function of this ratio (Fig. 4 A). The plots for P and Non-P mammary acini were assigned a red and blue color, respectively, and were fitted with normal distribution curves. An overlap between plots indicated that proper cutoff was required to distinguish P from Non-P mammary acini with both high sensitivity and specificity. A ROC curve was built to illustrate the tradeoff between sensitivity and specificity by plotting the true-positive rate against the false-positive rate for the different possible cutoffs of the lipid ordering ratio. The closer the curve comes to the 45-degree diagonal (shown as a thin black line in Fig. 4 B) the less accurate the diagnostic test. The large area under curve (= 0.98) clearly demonstrated the ability of the lipid ordering ratio to accurately differentiate P from Non-P mammary acini (Fig. 4 B). More importantly, the ROC curve provided a way to obtain the desired degree of sensitivity at the cost of specificity. Here, both high sensitivity (= 0.925) and specificity (= 0.925) were gained with a cutoff of 1.0 (lipid ordering ratio = 1.0). Therefore, it is possible to quantitatively and accurately distinguish P from Non-P mammary acini by the lipid ordering ratio with both high sensitivity and high specificity.
Figure 4.
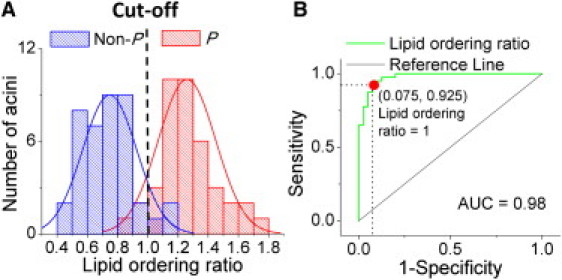
Sensitivity and specificity of the relative lipid ordering ratio in identifying P and Non-P acini. (A) Histogram plot of the number of acini as a function of the lipid ordering ratio (Blue: Non-P mammary acini, Red: P mammary acini). (B) Receiver operating characteristic ROC curve illustrating the ability of lipid ordering ratio to distinguish P and Non-P mammary acini (green line). The ROC curve of two indistinguishable populations, represented by the black line, is included for comparison. AUC: area under curve.
As an application of the label-free approach developed previously to measure polarity status, disruption of apical polarity was tracked over time in mammary acini undergoing AA treatment. Dietary fatty acids have been associated with breast cancer development (58–63). Particularly, high dietary intake of ω6 polyunsaturated fatty acids (PUFA) has been associated with increased breast cancer risk (64). Moreover, certain dietary interventions with fatty acids were shown to lead to rapid and potentially beneficial changes in ω3/ω6 PUFA ratio in the serum and breast adipose tissue (65,66). So far it is unknown whether ω6 PUFA could participate in the initiation stage of breast neoplasia by disrupting apical polarity. The impact of AA on apical polarity was assessed in a series of eight live acini before and after treatment with 60 μM AA. CARS images of the same mammary acini were taken before and after a 4-day AA treatment and the status of apical polarity was evaluated based on the lipid ordering ratio (Fig. 5 A and Fig. S8). After excluding the acini that were nonpolarized already before AA treatment, a statistically significant loss of apical polarity (∼30% of the population studied) was measured in AA-treated acini (Fig. 5 B). In contrast, examination of the apical location of tight junction protein ZO-1 by immunostaining in the same sets of samples and in 100 acini randomly chosen in each experiment, failed to reveal a statistically significant loss of apical polarity in AA-treated acini population (Fig. 5 C, Fig. S9).
Figure 5.
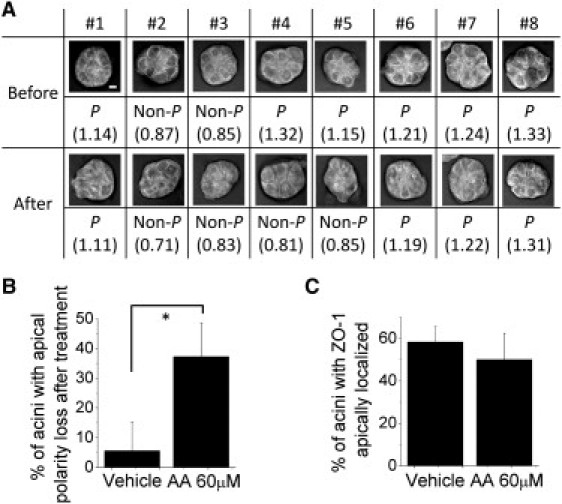
Measurements of the polarity status in acini before and after treatment with ω6 fatty acid. Acini were incubated with either ethanol vehicle or 60 μM AA from day 8 to 12 of 3D culture. (A) Status of apical polarity (polarized, P or Non-P) based on the lipid ordering ratio (ApM_R/BaM_R, number indicated in parenthesis; R = A2885/A2850) for the same group of acini before and after AA treatment as measured by the Raman scattering-based method. (B) Percentage of acini that have lost apical polarity in the control and AA-treated groups at day 12 (after treatment with vehicle or with AA) compared to day 8 (before treatment) detected by the Raman scattering-based method (∗p-value = 0.0066, n = 3 sets of 8 acini). (C) Percentage of acini with ZO-1 apically localized in vehicle control and AA-treated groups at day 12 of 3D culture (using the sample sets analyzed in B). Scale bar, 5 μm.
The results shown in Fig. 5 demonstrate that although immunostaining of tight junction proteins has been commonly used to determine the status of apical polarity (12,32,34), it is not very effective to detect significant loss of apical polarity induced by dietary factors in a small portion of the acini population. This ineffectiveness of the immunostaining method is largely due to the variation between different cultures, given that the percentage of P mammary acini in control cultures varies from 60% to 80% (12,32,34). By tracking the status of apical polarity for the same live acini before and after treatment with the Raman method, we are able to take into account only the acini that are apically polarized before treatment and then readily measure how many of them lose apical polarity. Thus, our label-free Raman analysis measures a true effect of the treatment on apical polarity by discarding false positives, that is, the acini that would not have been apically polarized from the start.
To understand the origin of reduced lipid ordering in Non-P acini, we further studied how AA treatment might affect the tight junction complex. It is possible that the effect of AA might only encompass ZO-1, leaving the rest of the tight junction intact. To rule out this possibility, the effect of AA was studied not only on ZO-1 but also on ZO-2, another core tight junction protein that links transmembrane proteins to cytoplasmic components of the junctional complex and the cytoskeleton (67–69). Immunostaining performed in a new set of experiments revealed that the two tight junction core proteins ZO-1 and ZO-2 colocalized in >90% of the cases when apically located and were significantly mislocalized upon AA treatment (Fig. 6 A) but did not overlap when away from the apical pole, suggesting that AA affects the tight junction complex globally. ZO-1 is the main protein that stabilizes the tight junction to the actin cytoskeleton in cells (67,69,70), therefore a severe disruption of the tight junction complex should be associated with the reorganization of the cytoskeleton. In cells that had apically polarized ZO-1, staining for polymerized actin was strongest at the apical side of the cells (Fig. 6 B). This is expected because the actin cytoskeleton serves as a framework to which tight junction complexes can bind and be secured in place (69). However, in the cells that had mislocalized ZO-1, the actin cytoskeleton was diffuse (Fig. 6 B), in agreement with a disruption of the tight junction complex. Tumor suppressor hScrib (31) plays a critical role during the initial formation of the tight junction complex (71) and disruption of tight junctions might perturb its function. In control acini, hScrib was located at the apical side with some lateral positioning, as shown by immunostaining. However, in acini treated with ω6 AA, hScrib became mislocalized as revealed by a diffuse staining pattern (Fig. 6 C). Although the immunostaining method cannot always detect a significant difference between control and treated groups (Fig. 5 C, Fig. S9), there have been some instances in which the AA treatment induces statistically significant loss of apically located ZO-1, ZO-2, hScrib, and actin, as shown in Fig. 6 D. These observations suggest that AA profoundly affects apical polarity, including the integrity of hScrib tumor suppressor localization. Specifically, they indicate that AA causes acinar cells to lose apical organization via a disruption of the tight junction complex, because two of the tight junction core proteins redistribute away from the apical pole and tight junction anchorage to the actin filament network is destabilized. Considering the key role of actin filaments in maintaining the integrity of cell membranes, cytoskeleton disruption is consistent with the reduced lipid ordering in the ApM as detected by the Raman analysis. Therefore, the lipid ordering ratio is a powerful way to measure modifications in tissue polarity, and thus, tissue homeostasis in live epithelia.
Figure 6.
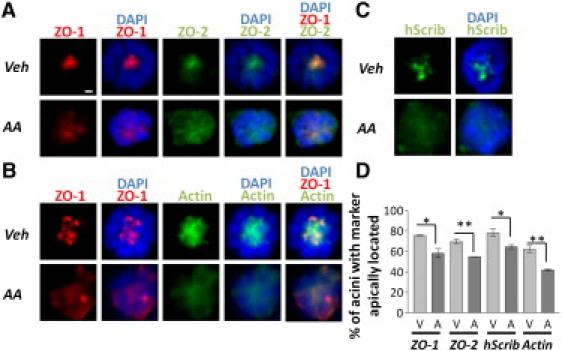
Distribution of apical polarity-related proteins in P and Non-P acini. Dual staining for tight junction core proteins ZO-1 and ZO-2 (A), ZO-1 and cytoskeleton component actin (B), and immunolabeling for apical polarity organizer hScrib (C) in P mammary acini in the control group (vehicle, Veh) and Non-P mammary acini in ω6 AA-treated group. Cell nuclei were labeled with DAPI (blue color). (D) Histograms of the percentages of acini with apically located ZO-1 (p = 0.0167), ZO-2 (p = 0.0026), hScrib (p = 0.0347), and actin (p = 0.0043), (n = 3, V: Veh, A: AA). ∗p < 0.05; ∗∗p < 0.01. Scale bar, 5 μm.
Our technique can be potentially used, in association with the breast cell model, as a screening method of risk factors for breast cancer as well as a screening method for chemopreventive agents in a similar way as what scientists are starting to do with cancer cells. In the latter case, cancer cells placed in 3D culture form tumor nodules that are then treated with potential anticancer drugs to test the cytotoxicity of these agents. In our study, we are working with nonneoplastic cells based on increasing evidence from cell culture and patient studies that loss of apical polarity is a very early sign of a preneoplastic change (12). There are currently no ways to test for dietary or chemical compounds that could act as agents to either initiate or prevent the development of breast tumors. We are proposing that our apical polarity measurement method in 3D culture of nonneoplastic cells would permit accurate screening of deleterious factors for breast health (that would induce loss of apical polarity) and also preventive factors (based on the reestablishment of apical polarity by these factors or their effect to prevent apical polarity loss normally induced by other factors). The possibility of live cell detection with Raman technology will permit the study of sequential effects of factors of interest, e.g., to assess whether factor B restores apical polarity previously altered by factor A.
Conclusions
We have demonstrated that a Raman scattering-based platform can be used to provide label-free determination of apical polarity of live mammary acini in 3D culture. In this method the lipid configurations within apical and basal membranes are measured by high-speed CARS imaging integrated with confocal Raman analysis. Notably, the derived ratio of the degree of lipid ordering appears superior to immunofluorescence-based analysis of fixed samples to determine the presence or disruption of apical polarity. This method has enabled us to quantify, with high sensitivity and specificity, the percentage of acini that lose apical polarity due to the effect of AA, a risk factor for breast cancer development. The proposed method provides an unprecedented label-free screening platform for rapid identification of risk factors that initiate the very early stage of epithelial neoplasia. Moreover, the use of the membrane lipid phase as readout to assess polarity should be applicable to other types of epithelia where over 90% of cancers originate. Indeed, polarity is a common feature of the homeostasis of such tissues and all studies of early changes in epithelial neoplasms so far report polarity loss.
Acknowledgments
Authors' contributions: S.Y. performed experiments, analyzed data, and wrote the manuscript; J.M.C. performed experiments, analyzed data, and participated in the writing of the biology portion of the manuscript; L.S.C. performed experiments; S.A.L. and JX.C. designed the research project and participated in the analysis of the data and the writing of the manuscript.
This work was supported by a Showalter grant to JX.C. and S.A.L., the National Institutes of Health (NIH) (R01CA112017 to S.A.L), Komen for the Cure (BCTR-0707641 to S.A.L.), a Congressionally Directed Medical Research/Breast Cancer Research Program Predoctoral Traineeship (BC100572 to S.Y.), the NIH, National Cancer Institute R25CA128770 (D. Teegarden) Cancer Prevention Internship Program (to Predoctoral Trainee S.Y.) administered by the Oncological Sciences Center and the Discovery Learning Research Center at Purdue University, and an Indiana Clinical and Translational Science Institute Career Development Award Grant (5TL1RR025759-03 to Predoctoral (TL1) Trainee J.M.C.).
Contributor Information
Sophie A. Lelièvre, Email: lelievre@purdue.edu.
Ji-Xin Cheng, Email: jcheng@purdue.edu.
Supporting Material
References
- 1.O'Brien L.E., Zegers M.M.P., Mostov K.E. Opinion: Building epithelial architecture: insights from three-dimensional culture models. Nat. Rev. Mol. Cell Biol. 2002;3:531–537. doi: 10.1038/nrm859. [DOI] [PubMed] [Google Scholar]
- 2.Pampaloni F., Reynaud E.G., Stelzer E.H.K. The third dimension bridges the gap between cell culture and live tissue. Nat. Rev. Mol. Cell Biol. 2007;8:839–845. doi: 10.1038/nrm2236. [DOI] [PubMed] [Google Scholar]
- 3.Yamada K.M., Cukierman E. Modeling tissue morphogenesis and cancer in 3D. Cell. 2007;130:601–610. doi: 10.1016/j.cell.2007.08.006. [DOI] [PubMed] [Google Scholar]
- 4.Weaver V.M., Petersen O.W., Bissell M.J. Reversion of the malignant phenotype of human breast cells in three-dimensional culture and in vivo by integrin blocking antibodies. J. Cell Biol. 1997;137:231–245. doi: 10.1083/jcb.137.1.231. [DOI] [PMC free article] [PubMed] [Google Scholar]
- 5.Lelièvre S.A., Weaver V.M., Bissell M.J. Tissue phenotype depends on reciprocal interactions between the extracellular matrix and the structural organization of the nucleus. Proc. Natl. Acad. Sci. USA. 1998;95:14711–14716. doi: 10.1073/pnas.95.25.14711. [DOI] [PMC free article] [PubMed] [Google Scholar]
- 6.Bissell M.J., Radisky D.C., Petersen O.W. The organizing principle: microenvironmental influences in the normal and malignant breast. Differentiation. 2002;70:537–546. doi: 10.1046/j.1432-0436.2002.700907.x. [DOI] [PMC free article] [PubMed] [Google Scholar]
- 7.Weaver V.M., Lelièvre S., Bissell M.J. beta4 integrin-dependent formation of polarized three-dimensional architecture confers resistance to apoptosis in normal and malignant mammary epithelium. Cancer Cell. 2002;2:205–216. doi: 10.1016/s1535-6108(02)00125-3. [DOI] [PMC free article] [PubMed] [Google Scholar]
- 8.Bissell M.J., Rizki A., Mian I.S. Tissue architecture: the ultimate regulator of breast epithelial function. Curr. Opin. Cell Biol. 2003;15:753–762. doi: 10.1016/j.ceb.2003.10.016. [DOI] [PMC free article] [PubMed] [Google Scholar]
- 9.Nelson C.M., Bissell M.J. Modeling dynamic reciprocity: engineering three-dimensional culture models of breast architecture, function, and neoplastic transformation. Semin. Cancer Biol. 2005;15:342–352. doi: 10.1016/j.semcancer.2005.05.001. [DOI] [PMC free article] [PubMed] [Google Scholar]
- 10.Debnath J., Brugge J.S. Modelling glandular epithelial cancers in three-dimensional cultures. Nat. Rev. Cancer. 2005;5:675–688. doi: 10.1038/nrc1695. [DOI] [PubMed] [Google Scholar]
- 11.Adissu H.A., Asem E.K., Lelièvre S.A. Three-dimensional cell culture to model epithelia in the female reproductive system. Reprod. Sci. 2007;14(Suppl):11–19. doi: 10.1177/1933719107310872. [DOI] [PubMed] [Google Scholar]
- 12.Chandramouly G., Abad P.C., Lelièvre S.A. The control of tissue architecture over nuclear organization is crucial for epithelial cell fate. J. Cell Sci. 2007;120:1596–1606. doi: 10.1242/jcs.03439. [DOI] [PubMed] [Google Scholar]
- 13.Abad P.C., Lewis J., Lelièvre S.A. NuMA influences higher order chromatin organization in human mammary epithelium. Mol. Biol. Cell. 2007;18:348–361. doi: 10.1091/mbc.E06-06-0551. [DOI] [PMC free article] [PubMed] [Google Scholar]
- 14.Lelièvre S.A. Tissue polarity-dependent control of mammary epithelial homeostasis and cancer development: an epigenetic perspective. J. Mammary Gland Biol. Neoplasia. 2010;15:49–63. doi: 10.1007/s10911-010-9168-y. [DOI] [PMC free article] [PubMed] [Google Scholar]
- 15.Lee G.Y., Kenny P.A., Bissell M.J. Three-dimensional culture models of normal and malignant breast epithelial cells. Nat. Methods. 2007;4:359–365. doi: 10.1038/nmeth1015. [DOI] [PMC free article] [PubMed] [Google Scholar]
- 16.Hilakivi-Clarke L., Cho E., Kenney N. Alterations in mammary gland development following neonatal exposure to estradiol, transforming growth factor alpha, and estrogen receptor antagonist ICI 182,780. J. Cell. Physiol. 1997;170:279–289. doi: 10.1002/(SICI)1097-4652(199703)170:3<279::AID-JCP9>3.0.CO;2-L. [DOI] [PubMed] [Google Scholar]
- 17.Olson L.K., Tan Y., Haslam S.Z. Pubertal exposure to high fat diet causes mouse strain-dependent alterations in mammary gland development and estrogen responsiveness. Int J Obes (Lond) 2010;34:1415–1426. doi: 10.1038/ijo.2010.51. [DOI] [PMC free article] [PubMed] [Google Scholar]
- 18.Vachon C.M., Kuni C.C., Sellers T.A. Association of mammographically defined percent breast density with epidemiologic risk factors for breast cancer (United States) Cancer Causes Control. 2000;11:653–662. doi: 10.1023/a:1008926607428. [DOI] [PubMed] [Google Scholar]
- 19.Fish E.M., Molitoris B.A. Alterations in epithelial polarity and the pathogenesis of disease states. N. Engl. J. Med. 1994;330:1580–1588. doi: 10.1056/NEJM199406023302207. [DOI] [PubMed] [Google Scholar]
- 20.Rodriguez-Boulan E., Nelson W.J. Morphogenesis of the polarized epithelial cell phenotype. Science. 1989;245:718–725. doi: 10.1126/science.2672330. [DOI] [PubMed] [Google Scholar]
- 21.Mellman I., Nelson W.J. Coordinated protein sorting, targeting and distribution in polarized cells. Nat. Rev. Mol. Cell Biol. 2008;9:833–845. doi: 10.1038/nrm2525. [DOI] [PMC free article] [PubMed] [Google Scholar]
- 22.Schuck S., Simons K. Polarized sorting in epithelial cells: raft clustering and the biogenesis of the apical membrane. J. Cell Sci. 2004;117:5955–5964. doi: 10.1242/jcs.01596. [DOI] [PubMed] [Google Scholar]
- 23.Simons K., van Meer G. Lipid sorting in epithelial cells. Biochemistry. 1988;27:6197–6202. doi: 10.1021/bi00417a001. [DOI] [PubMed] [Google Scholar]
- 24.Tsukita S., Furuse M., Itoh M. Multifunctional strands in tight junctions. Nat. Rev. Mol. Cell Biol. 2001;2:285–293. doi: 10.1038/35067088. [DOI] [PubMed] [Google Scholar]
- 25.Bryant D.M., Mostov K.E. From cells to organs: building polarized tissue. Nat. Rev. Mol. Cell Biol. 2008;9:887–901. doi: 10.1038/nrm2523. [DOI] [PMC free article] [PubMed] [Google Scholar]
- 26.Furuse M. Molecular basis of the core structure of tight junctions. Cold Spring Harb. Perspect. Biol. 2010;2:a002907. doi: 10.1101/cshperspect.a002907. [DOI] [PMC free article] [PubMed] [Google Scholar]
- 27.Mitic L.L., Anderson J.M. Molecular architecture of tight junctions. Annu. Rev. Physiol. 1998;60:121–142. doi: 10.1146/annurev.physiol.60.1.121. [DOI] [PubMed] [Google Scholar]
- 28.Cereijido M., Valdés J., Contreras R.G. Role of tight junctions in establishing and maintaining cell polarity. Annu. Rev. Physiol. 1998;60:161–177. doi: 10.1146/annurev.physiol.60.1.161. [DOI] [PubMed] [Google Scholar]
- 29.Matter K., Aijaz S., Balda M.S. Mammalian tight junctions in the regulation of epithelial differentiation and proliferation. Curr. Opin. Cell Biol. 2005;17:453–458. doi: 10.1016/j.ceb.2005.08.003. [DOI] [PubMed] [Google Scholar]
- 30.Matter K., Balda M.S. Epithelial tight junctions, gene expression and nucleo-junctional interplay. J. Cell Sci. 2007;120:1505–1511. doi: 10.1242/jcs.005975. [DOI] [PubMed] [Google Scholar]
- 31.Zhan L., Rosenberg A., Muthuswamy S.K. Deregulation of scribble promotes mammary tumorigenesis and reveals a role for cell polarity in carcinoma. Cell. 2008;135:865–878. doi: 10.1016/j.cell.2008.09.045. [DOI] [PMC free article] [PubMed] [Google Scholar]
- 32.Plachot C., Chaboub L.S., Lelièvre S.A. Factors necessary to produce basoapical polarity in human glandular epithelium formed in conventional and high-throughput three-dimensional culture: example of the breast epithelium. BMC Biol. 2009;7:77. doi: 10.1186/1741-7007-7-77. [DOI] [PMC free article] [PubMed] [Google Scholar]
- 33.Shaykhiev R., Otaki F., Crystal R.G. Cigarette smoking reprograms apical junctional complex molecular architecture in the human airway epithelium in vivo. Cell. Mol. Life Sci. 2011;68:877–892. doi: 10.1007/s00018-010-0500-x. [DOI] [PMC free article] [PubMed] [Google Scholar]
- 34.Plachot C., Lelièvre S.A. DNA methylation control of tissue polarity and cellular differentiation in the mammary epithelium. Exp. Cell Res. 2004;298:122–132. doi: 10.1016/j.yexcr.2004.04.024. [DOI] [PubMed] [Google Scholar]
- 35.Wallach D.F.H., Verma S.P., Fookson J. Application of laser Raman and infrared spectroscopy to the analysis of membrane structure. Biochim. Biophys. Acta. 1979;559:153–208. doi: 10.1016/0304-4157(79)90001-7. [DOI] [PubMed] [Google Scholar]
- 36.Duindam J.J., Vrensen G.F., Greve J. Cholesterol, phospholipid, and protein changes in focal opacities in the human eye lens. Invest. Ophthalmol. Vis. Sci. 1998;39:94–103. [PubMed] [Google Scholar]
- 37.Gniadecka M., Faurskov Nielsen O., Wulf H.C. Structure of water, proteins, and lipids in intact human skin, hair, and nail. J. Invest. Dermatol. 1998;110:393–398. doi: 10.1046/j.1523-1747.1998.00146.x. [DOI] [PubMed] [Google Scholar]
- 38.Gremlich H.-U., Yan B. Marcel Dekker; New York: 2001. Infrared and Raman Spectroscopy of Biological Materials. [Google Scholar]
- 39.Pézolet M., Georgescauld D. Raman spectroscopy of nerve fibers. A study of membrane lipids under steady state conditions. Biophys. J. 1985;47:367–372. doi: 10.1016/S0006-3495(85)83927-8. [DOI] [PMC free article] [PubMed] [Google Scholar]
- 40.Puppels G.J., de Mul F.F.M., Jovin T.M. Studying single living cells and chromosomes by confocal Raman microspectroscopy. Nature. 1990;347:301–303. doi: 10.1038/347301a0. [DOI] [PubMed] [Google Scholar]
- 41.Huang Y.-S., Karashima T., Hamaguchi H.O. Molecular-level investigation of the structure, transformation, and bioactivity of single living fission yeast cells by time- and space-resolved Raman spectroscopy. Biochemistry. 2005;44:10009–10019. doi: 10.1021/bi050179w. [DOI] [PubMed] [Google Scholar]
- 42.Short K.W., Carpenter S., Mourant J.R. Raman spectroscopy detects biochemical changes due to proliferation in mammalian cell cultures. Biophys. J. 2005;88:4274–4288. doi: 10.1529/biophysj.103.038604. [DOI] [PMC free article] [PubMed] [Google Scholar]
- 43.van Manen H.-J., Kraan Y.M., Otto C. Single-cell Raman and fluorescence microscopy reveal the association of lipid bodies with phagosomes in leukocytes. Proc. Natl. Acad. Sci. USA. 2005;102:10159–10164. doi: 10.1073/pnas.0502746102. [DOI] [PMC free article] [PubMed] [Google Scholar]
- 44.Cheng J.-X., Xie X.S. Coherent anti-Stokes Raman scattering microscopy: instrumentation, theory, and applications. J. Phys. Chem. B. 2004;108:827–840. [Google Scholar]
- 45.Cheng J.-X., Jia Y.K., Xie X.S. Laser-scanning coherent anti-Stokes Raman scattering microscopy and applications to cell biology. Biophys. J. 2002;83:502–509. doi: 10.1016/S0006-3495(02)75186-2. [DOI] [PMC free article] [PubMed] [Google Scholar]
- 46.Wang H., Fu Y., Cheng J.X. Coherent anti-stokes Raman scattering imaging of axonal myelin in live spinal tissues. Biophys. J. 2005;89:581–591. doi: 10.1529/biophysj.105.061911. [DOI] [PMC free article] [PubMed] [Google Scholar]
- 47.Le T.T., Cheng J.-X. Single-cell profiling reveals the origin of phenotypic variability in adipogenesis. PLoS ONE. 2009;4:e5189. doi: 10.1371/journal.pone.0005189. [DOI] [PMC free article] [PubMed] [Google Scholar]
- 48.Müller M., Schins J.M. Imaging the thermodynamic state of lipid membranes with multiplex CARS microscopy. J. Phys. Chem. B. 2002;106:3715–3723. [Google Scholar]
- 49.Cheng J.-X., Volkmer A., Xie X.S. Multiplex coherent anti-Stokes Raman scattering microspectroscopy and study of lipid vesicles. J. Phys. Chem. B. 2002;106:8493–8498. [Google Scholar]
- 50.Rinia H.A., Burger K.N.J., Müller M. Quantitative label-free imaging of lipid composition and packing of individual cellular lipid droplets using multiplex CARS microscopy. Biophys. J. 2008;95:4908–4914. doi: 10.1529/biophysj.108.137737. [DOI] [PMC free article] [PubMed] [Google Scholar]
- 51.Day J.P.R., Domke K.F., Bonn M. Quantitative coherent anti-Stokes Raman scattering (CARS) microscopy. J. Phys. Chem. B. 2011;115:7713–7725. doi: 10.1021/jp200606e. [DOI] [PubMed] [Google Scholar]
- 52.Lin C.-Y., Suhalim J.L., Potma E.O. Picosecond spectral coherent anti-Stokes Raman scattering imaging with principal component analysis of meibomian glands. J. Biomed. Opt. 2011;16:021104. doi: 10.1117/1.3533716. [DOI] [PMC free article] [PubMed] [Google Scholar]
- 53.Slipchenko M.N., Le T.T., Cheng J.X. High-speed vibrational imaging and spectral analysis of lipid bodies by compound Raman microscopy. J. Phys. Chem. B. 2009;113:7681–7686. doi: 10.1021/jp902231y. [DOI] [PMC free article] [PubMed] [Google Scholar]
- 54.Le T.T., Duren H.M., Cheng J.X. Label-free quantitative analysis of lipid metabolism in living Caenorhabditis elegans. J. Lipid Res. 2010;51:672–677. doi: 10.1194/jlr.D000638. [DOI] [PMC free article] [PubMed] [Google Scholar]
- 55.Ayala G., Carmona P., Monreal J. Vibrational spectra and structure of myelin membranes. Eur. Biophys. J. 1987;14:219–225. doi: 10.1007/BF00256355. [DOI] [PubMed] [Google Scholar]
- 56.Brasitus T.A., Schachter D. Lipid dynamics and lipid-protein interactions in rat enterocyte basolateral and microvillus membranes. Biochemistry. 1980;19:2763–2769. doi: 10.1021/bi00553a035. [DOI] [PubMed] [Google Scholar]
- 57.Gaber B.P., Peticolas W.L. On the quantitative interpretation of biomembrane structure by Raman spectroscopy. Biochim. Biophys. Acta. 1977;465:260–274. doi: 10.1016/0005-2736(77)90078-5. [DOI] [PubMed] [Google Scholar]
- 58.Chamras H., Ardashian A., Glaspy J.A. Fatty acid modulation of MCF-7 human breast cancer cell proliferation, apoptosis and differentiation. J. Nutr. Biochem. 2002;13:711–716. doi: 10.1016/s0955-2863(02)00230-9. [DOI] [PubMed] [Google Scholar]
- 59.Chujo H., Yamasaki M., Yamada K. Effect of conjugated linoleic acid isomers on growth factor-induced proliferation of human breast cancer cells. Cancer Lett. 2003;202:81–87. doi: 10.1016/s0304-3835(03)00478-6. [DOI] [PubMed] [Google Scholar]
- 60.Rose D.P., Connolly J.M. Effects of fatty acids and inhibitors of eicosanoid synthesis on the growth of a human breast cancer cell line in culture. Cancer Res. 1990;50:7139–7144. [PubMed] [Google Scholar]
- 61.Hardy S., Langelier Y., Prentki M. Oleate activates phosphatidylinositol 3-kinase and promotes proliferation and reduces apoptosis of MDA-MB-231 breast cancer cells, whereas palmitate has opposite effects. Cancer Res. 2000;60:6353–6358. [PubMed] [Google Scholar]
- 62.Calle E.E., Kaaks R. Overweight, obesity and cancer: epidemiological evidence and proposed mechanisms. Nat. Rev. Cancer. 2004;4:579–591. doi: 10.1038/nrc1408. [DOI] [PubMed] [Google Scholar]
- 63.Lorincz A.M., Sukumar S. Molecular links between obesity and breast cancer. Endocr. Relat. Cancer. 2006;13:279–292. doi: 10.1677/erc.1.00729. [DOI] [PubMed] [Google Scholar]
- 64.Bartsch H., Nair J., Owen R.W. Dietary polyunsaturated fatty acids and cancers of the breast and colorectum: emerging evidence for their role as risk modifiers. Carcinogenesis. 1999;20:2209–2218. doi: 10.1093/carcin/20.12.2209. [DOI] [PubMed] [Google Scholar]
- 65.Bagga D., Capone S., Glaspy J.A. Dietary modulation of omega-3/omega-6 polyunsaturated fatty acid ratios in patients with breast cancer. J. Natl. Cancer Inst. 1997;89:1123–1131. doi: 10.1093/jnci/89.15.1123. [DOI] [PubMed] [Google Scholar]
- 66.Capone S.L., Bagga D., Glaspy J.A. Relationship between omega-3 and omega-6 fatty acid ratios and breast cancer. Nutrition. 1997;13:822–824. doi: 10.1016/s0899-9007(97)00199-8. [DOI] [PubMed] [Google Scholar]
- 67.Itoh M., Nagafuchi A., Tsukita S. Involvement of ZO-1 in cadherin-based cell adhesion through its direct binding to alpha catenin and actin filaments. J. Cell Biol. 1997;138:181–192. doi: 10.1083/jcb.138.1.181. [DOI] [PMC free article] [PubMed] [Google Scholar]
- 68.González-Mariscal L., Betanzos A., Jaramillo B.E. Tight junction proteins. Prog. Biophys. Mol. Biol. 2003;81:1–44. doi: 10.1016/s0079-6107(02)00037-8. [DOI] [PubMed] [Google Scholar]
- 69.Fanning A.S., Jameson B.J., Anderson J.M. The tight junction protein ZO-1 establishes a link between the transmembrane protein occludin and the actin cytoskeleton. J. Biol. Chem. 1998;273:29745–29753. doi: 10.1074/jbc.273.45.29745. [DOI] [PubMed] [Google Scholar]
- 70.Wittchen E.S., Haskins J., Stevenson B.R. Protein interactions at the tight junction. Actin has multiple binding partners, and ZO-1 forms independent complexes with ZO-2 and ZO-3. J. Biol. Chem. 1999;274:35179–35185. doi: 10.1074/jbc.274.49.35179. [DOI] [PubMed] [Google Scholar]
- 71.Qin Y., Capaldo C., Macara I.G. The mammalian Scribble polarity protein regulates epithelial cell adhesion and migration through E-cadherin. J. Cell Biol. 2005;171:1061–1071. doi: 10.1083/jcb.200506094. [DOI] [PMC free article] [PubMed] [Google Scholar]
Associated Data
This section collects any data citations, data availability statements, or supplementary materials included in this article.