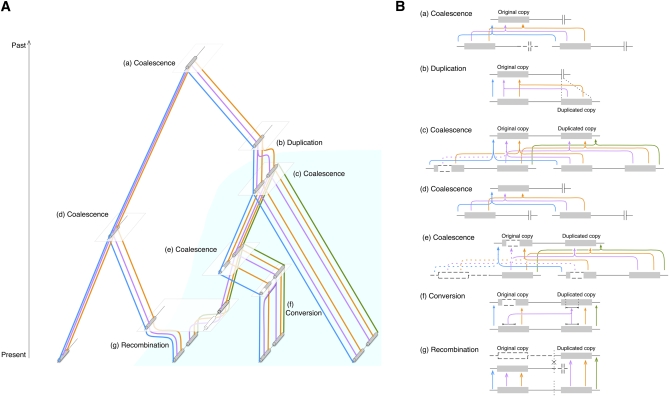
Figure 2 .
(A) Illustration of ancestral recombination graph of a pair of duplicate copies with gene conversion between them. The process is considered backward in time, from present to past. The area of light blue represents the frequency change of the duplicated copy. (B) Detailed illustrations for the coalescent, recombination, gene conversion, and duplication events in A. (a) Coalescent event to reach the MRCA of the entire region, (b) duplication event, (c–e) coalescent events between a pair of class D chromosomes, (f) gene conversion event between the original and duplicated copies, and (g) recombination between class S and D chromosomes. The recombination breakpoint is shown by X. The open boxes and dashed lines are ancestral lineages that do not originate from the sampled chromosomes.

