

Abstract
Effective temperatures of ions during traveling wave ion mobility spectrometry (TWIMS) analysis were measured using singly protonated leucine enkephalin dimer as a chemical thermometer by monitoring dissociation of the dimer into monomer, as well as the subsequent dissociation of monomer into a-, b-, and y-ions, as a function of instrumental parameters. At fixed helium cell and TWIMS cell gas flow rates, the extent of dissociation does not vary significantly with either the wave velocity or wave height, except at low (<500 m/s) wave velocities that are not commonly used. Increasing the flow rate of nitrogen gas into the TWIMS cell and decreasing the flow rate of helium gas into the helium cell resulted in greater dissociation. However, the mobility distributions of the fragment ions formed by dissociation of the dimer upon injection into the TWIMS cell are nearly indistinguishable from those of fragment ions formed in the collision cell prior to TWIMS analysis for all TWIMS experiments. These results indicate that heating and dissociation occur when ions are injected into the TWIMS cell, and that the effective temperature subsequently decreases to a point at which no further dissociation is observed during the TWIMS analysis. An upper limit to the effective ion temperature of 449 K during TWIMS analysis is obtained at a helium flow rate of 180 mL/min, TWIMS flow rate of 80 mL/min and traveling wave height of 40 V, which is well below previously reported values. Effects of ion heating in TWIMS on gas-phase protein conformation are presented.
Introduction
Ion mobility spectrometry (IMS) separates gaseous ions based on differences in their mobilities through an inert collision gas, which depend on ion charge, size, shape, and ion-molecular interactions [1]. Originally employed for analyzing atomic species [2-4] and small clusters and molecules [4-7], the use of IMS for examining the gas-phase conformations of peptides [8], proteins [9-13], multi-protein complexes [14-16], and even viruses [17] has undergone rapid growth. Static field IMS, field-asymmetric (FA)IMS, and traveling wave (TW)IMS have all been coupled with mass spectrometry (MS), either as a means of ion selection or as a detector [18-30]. In TWIMS, a wave of amplitude V is applied to a set of adjacent lenses and moved along the axis of the cell at a velocity v. Some ions are able to traverse the cell at the velocity of the wave, whereas others fall behind the wave, resulting in a mobility separation [31, 32]. TWIMS separations are rapid with resolving powers (t/Δt) approaching ~30 with a cell ~25 cm in length [30, 33].
One issue with any mobility analyzer used to investigate the conformations of biomolecules is that the measurement itself may alter the conformation of the ion. In static field IMS, cross section values for proteins that are closest to those calculated from crystal structures were obtained for the lowest charge state ions when low injection energies and short ion storage times prior to injection were used. However, more elongated conformations were observed for these ions when higher injection voltages and longer storage times were used [9-13]. This indicates that conformational changes can be caused by activation of ions in the gas phase. Similarly, elongation of protein ion conformations can occur at high fields in FAIMS [34]. Early experiments and theoretical examinations of TWIMS suggested that the resolving power of the separation increases with increasing wave height, pressure, and mobility, and decreasing wave velocity [29, 32]. Experiments on a second-generation TWIMS device show that the ratio of traveling wave height to the traveling wave velocity has the largest effect for optimal resolving power [33]. Optimum values for this ratio depend on both the drift pressure and the mobility of the ion and the highest collision cross section accuracy was obtained at high pressures and low wave velocities [33]. However, the effects of these parameters on both ion heating and any conformational changes that might occur are still not fully understood, but have recently been investigated with a first-generation TWIMS [35]. Shvartsburg and Smith examined and modeled TWIMS, and estimated that ions can have effective temperatures as high as 7000 K during TWIMS depending on experimental parameters [32]. Intact macromolecular complexes can be analyzed using a careful choice of instrumental parameters, indicating that dissociation as a result of ion heating can be minimized, and drift times can be converted to collision cross sections through calibration curves [33, 36, 37]. However, a quantitative measure of the extent to which ion heating occurs in TWIMS is desirable because ion heating can effect both the collision cross section measurements and the distributions of conformations observed even when dissociation does not occur.
The extent to which ions are heated during an activation process can be measured using thermometer ions. These are ions for which the energetics of dissociation are well characterized, and such ions have been employed in mass spectrometry for over 50 years to better understand energy deposition in various processes and instruments [38-49]. For these ions, fragments have defined appearance energies [38-40], the thermodynamics of bond cleavages are known [41, 42], or dissociation kinetics have been measured by a thermal technique, such as blackbody infrared radiative dissociation (BIRD) [43-46]. In all instances, information about the internal energy or effective temperature of the ion as it traverses the mass spectrometer can be obtained from the observed fragmentation. Recently, Morsa et al. examined heating in a first generation TWIMS instrument using the p-methoxybenzylpyridinium ion (m/z 200), which fragments to yield the p-methoxybenzyl cation, as a thermometer ion [50]. The drift profile of this product ion had populations corresponding to fragmentation of the precursor before, during, and after it traversed the TWIMS cell, and all three populations were studied as a function of instrumental parameters. Ion effective temperatures within the TWIMS cell increased with increasing wave height, decreasing wave velocity, and decreasing drift pressure, and an effective temperature of 555 K was measured at the manufacturer’s suggested settings. Although this value is significantly lower than the 7000 K upper limit of Shvartsburg and Smith [32], it is still significantly higher than temperatures typically achieved in static-field IMS. The authors suggested that ionic size might influence heating, with lower temperatures anticipated for larger singly-charged ions [50].
Whereas many thermometer ions, such as p-methoxybenzylpyridinium, are small organic molecules, protonated leucine enkephalin is an attractive larger thermometer ion which can readily be produced both by electrospray ionization (ESI) and matrix-assisted laser desorption ionization. The dissociation of this protonated peptide has been examined extensively by collisional activation, surface-induced dissociation and BIRD, and the Arrhenius parameters for its dissociation obtained from these methods have been compiled in a recent review [51]. Here, we examine the dissociation of the singly-protonated leucine enkephalin dimer (m/z 1112) [44] as it traverses a second generation TWIMS cell. Dissociation of the mass-selected dimer into monomer as well as subsequent dissociation of the monomer is observed in TWIMS. The extent of dissociation does not vary significantly as the traveling wave height or velocity is varied, except at low wave velocities. These data indicate that the injection of ions into the TWIMS cell is the “hottest” step of the process, and that ions cool rapidly prior to TWIMS analysis. These results indicate that the maximum ion effective temperature must be below 449 K during the TWIMS separation. Lastly, we present data for two other systems and show that ion heating upon injection can cause small protein ions to unfold to more elongated conformations under typical conditions used in TWIMS experiments.
Experimental
Electrospray Ionization
Leucine enkephalin and ubiquitin were purchased as lyophilized powders (Sigma Aldrich, St. Louis, MO, USA) and were used without further purification. For leucine enkephalin, the solid was diluted to a concentration of 0.1 M in 18 MΩ water to facilitate dimer formation. For ubiquitin, a solution of 3.0×10⁻⁵ M was prepared in 94:4:2 (percent volume) water: acetonitrile: acetic acid. All arrival time distributions and mass spectra were acquired using a hybrid Q-TWIMS- time-of-flight (TOF)MS (Synapt G2 High Definition Mass Spectrometer; Waters, Milford, MA, USA) equipped with a Z-spray ion source. Ions were formed using nanoelectrospray emitters made by pulling borosilicate capillaries (1.0 mm o.d./0.78 mm i.d.; Sutter Instruments, Novato, CA, USA) to a tip i.d. of ~1 μm with a Flaming/Brown micropipette puller (Model P-87; Sutter Instruments). A platinum wire (0.127 mm diameter; Sigma Aldrich) inserted into the capillary provides electrical contact with the solution. Electrospray was initiated and maintained by applying a potential of 1.0-1.7 kV to the wire relative to instrument ground.
Instrumental Parameters
The theory behind traveling wave IMS and design aspects of TWIMS cells, including those employed in the commercially available TWIMS-MS instruments, are described elsewhere [29-33]. Therefore, only a brief description of the TRIWAVE assembly is given here. Figure 1 shows a schematic diagram of the trap, TWIMS, and transfer TWAVE elements of the instrument used for these studies. Traveling waves of user-defined heights and velocities are applied independently to all of the regions except the helium cell. A sine wave of 2.8 MHz and 250 V peak-to-peak radially confines ions and is applied to all elements. Argon gas is introduced into the trap and transfer regions, and helium and nitrogen gases are introduced into the helium and TWIMS cells, respectively. DC voltages can be applied to the first and last lens of both the trap and TWIMS regions, and bias voltages can raise all elements of the trap by a defined amount above the TWIMS cell as well as the TWIMS cell relative to the transfer TWAVE. The transfer TWAVE can have a collision energy applied to it for the purpose of fragmenting mobility resolved precursor ions in parallel [52, 53]. The distance between the trap and the helium cell is 40 mm, and the lengths of the helium and TWIMS cells are 70 and 254 mm, respectively.
Fig. 1.
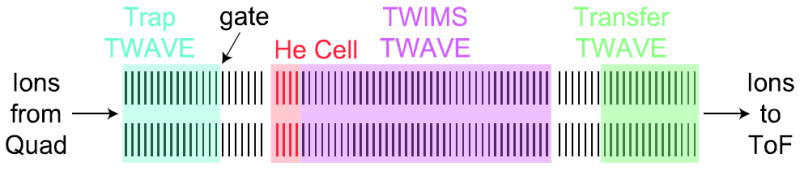
Diagram of the TRIWAVE region in the Waters Synapt G2 (not to scale), consisting of three components, the Trap TWAVE (blue), TWIMS TWAVE (purple), and Transfer TWAVE (green). A small region at the front of the TWIMS TWAVE is pressurized with helium and is shown in red. Highlighted areas denote regions to which gas is introduced: Trap and Transfer, argon; helium cell, helium, and TWIMS cell, nitrogen. The gate pulses ions into the TWIMS cell and begins the drift experiment.
Because the purpose of these experiments is to examine the extent of ion activation caused specifically by the TWIMS cell, each element was tuned to minimize dissociation of protonated leucine enkephalin dimer ion, (M2+H)+, without decreasing ion transmission by more than ~10% below the optimum value. Then, the following parameters in TWIMS-MS mode were maintained constant unless otherwise specified: trap gas (Ar) flow rate of 3.00 mL/min; source TWAVE velocity of 150 m/s; source TWAVE height of 0.5 V; trap TWAVE velocity of 150 m/s; trap TWAVE height of 2.0 V; transfer TWAVE velocity of 100 m/s, transfer TWAVE height of 1.0 V, and source pulse width of 200 μs. The DC potentials and bias voltages applied to the trap, helium, TWIMS, and transfer TWAVE cells were all maintained constant; a list of these values is provided in Supplemental Table 1. The potential of the sampling cone was 10 V for analysis of leucine enkephalin and 25 V for the analysis of myoglobin and ubiquitin, and the extraction cone was maintained at 1 V for all experiments. As a result of varying the flow rates of gases into both the helium and TWIMS cells, the pressure in the TOF analyzer varied from 1.05 – 1.22 × 10⁻⁶ mbar. The TOF analyzer was operated in single-pass sensitivity mode. Mass spectra were not smoothed whereas arrival time distributions were smoothed three times with a 1-unit wide Savitzky-Golay smoothing algorithm. Experiments were carried out in triplicate. Drift times are reproducible to within ±1 drift bin, which corresponds to 70 μs for these experiments. Extents of dissociation measured on the same day are reproducible to within an average percent relative error of ~ 8%. Uncertainties are reported as one standard deviation.
Effective Temperatures
The effective temperature of an ion was determined from the measured extent of dissociation as well as the activation time from the Arrhenius equation using Arrhenius parameters previously measured using BIRD in the rapid exchange limit [54]. The effective temperature is defined as the temperature at which the measured dissociation rate constant is equal to that of a Boltzmann distribution of ions [54, 55]. The time of ion activation during TWIMS analysis was obtained from the drift time corrected for the time spent in the transfer TWAVE and TOF [36, 37]. The time used to calculate effective temperatures during ion injection is 70 μs, which corresponds to the temporal length of each drift bin. This value was used as an upper limit to the dissociation time frame during injection based on the absence of a shift in the drift profile of the same ions formed either before or after injection.
Results
Effects of traveling wave height and velocity on dissociation
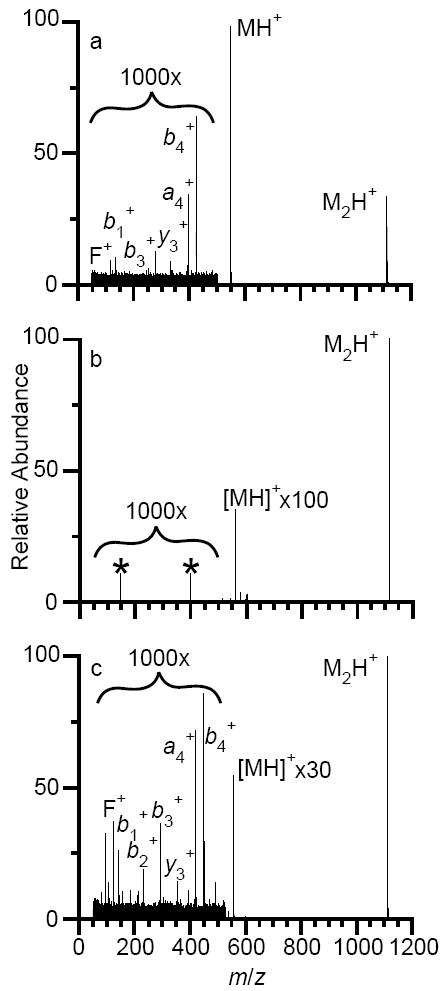
In order to characterize the extent of ion activation caused by TWIMS, experimental parameters were adjusted to minimize activation caused in other regions of the mass spectrometer while not significantly reducing ion transmission. Argon was supplied to both the trap and transfer TWAVE regions at a flow rate of 3.00 mL/min, but no helium or nitrogen was introduced into the helium and TWIMS cells. A trap TWAVE height of 0.5 V and transfer wave height of 0.2 V were necessary to observe the protonated leucine enkephalin dimer, but no waves were applied to the source or TWIMS cells. A mass spectrum of the mass-selected singly protonated leucine enkephalin dimer acquired with these conditions is shown in Figure 2a. A small fraction of protonated dimers dissociate into the singly protonated monomer (extent of dissociation is 0.259 ± 0.003%), and no further fragmentation occurs.
Fig. 2.
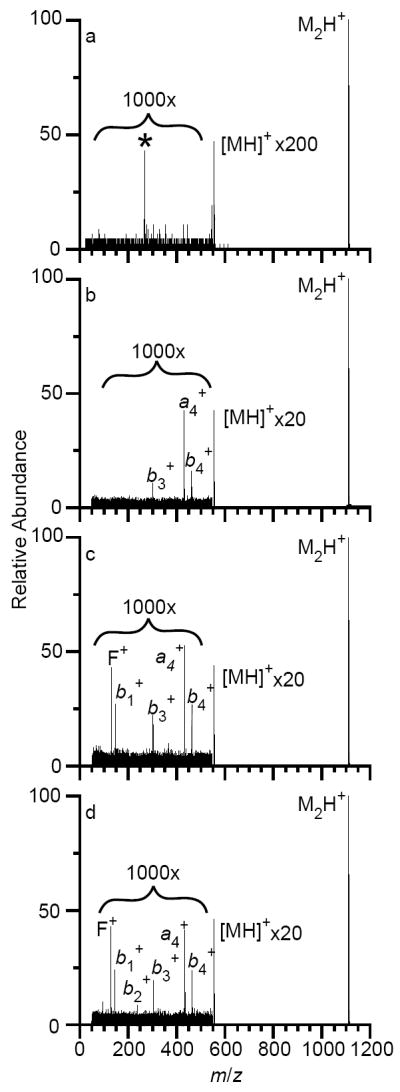
Mass spectra of the mass-selected leucine enkephalin dimer, acquired in MS mode (a), or TWIMS-MS mode at wave velocities of 500 m/s (b), 900 m/s (c), or 1300 m/s (d). In TWIMSMS mode, the helium cell flow rate was 180 mL/min, the flow rate of nitrogen into the TWIMS cell was 80 mL/min, and a constant wave height of 40 V was used. The protonated monomer ion is expanded, as is the region between m/z 50 – 550. In (a), the peak at m/z 264, highlighted with an asterisk, is noise.
In order to acquire two-dimensional TWIMS-MS spectra, helium and nitrogen were introduced into the instrument, and lens elements were set to the values given in the experimental section and Supplemental Table 1. Conditions in the source, trap, and transfer TWAVE cells were maintained constant, whereas both the TWIMS wave height and wave velocity were varied systematically. Mass spectra acquired at a constant wave height of 40 V but at wave velocities of 500, 900, and 1300 m/s are shown in Figure 2b-d. In these experiments, flow rates in the helium and TWIMS cells were 180 and 80 mL/min, respectively, both near the manufacturer’s suggested values. The abundance of the singly protonated monomer is nearly an order of magnitude greater at all three wave velocities compared to the mass spectrum in Figure 2a with no TWAVE separation. Dissociation of the monomer also occurs. The b3+, a4+, and b4+ fragments are all formed at a wave velocity of 500 m/s (Figure 2 b). Along with these fragments, the b1+ and internal fragment F+ are formed at a wave velocity of 900 m/s (Figure 2c), and at a wave velocity of 1300 m/s, the b2+ is formed as well (Figure 2d). Despite the greater number of fragments observed from dissociation of the monomer, the extent of dissociation of the singly protonated leucine enkephalin dimer does not vary significantly as the traveling wave velocity is varied, with all fragments comprising ~2 – 3% of the total ion intensity. This may be the result of subtle differences in the widths of the internal energy distribution although the average internal energy of the ion population does not change.
The effects of traveling wave height on the extent of dissociation of the singly protonated leucine enkephalin dimer as a function of wave velocity was measured and these results are shown in Figure 3. For wave velocities of 500 m/s and greater, the extent of dissociation was ~2.5% and did not depend significantly on either the wave height or wave velocity. At a wave velocity of 100 m/s, there is an increase in dissociation with wave heights of 30 V and greater, with a maximum of 16 ± 1% at 40 V. This shows that these ions are heated during TWIMS analysis at this very low wave velocity and high wave height. However, under these conditions, ion transport but no mobility separation occurs. Thus, the wave height and wave velocity do not change the effective temperature of the singly protonated leucine enkephalin dimer to an observable extent over a range of conditions that would be typically used.
Fig. 3.
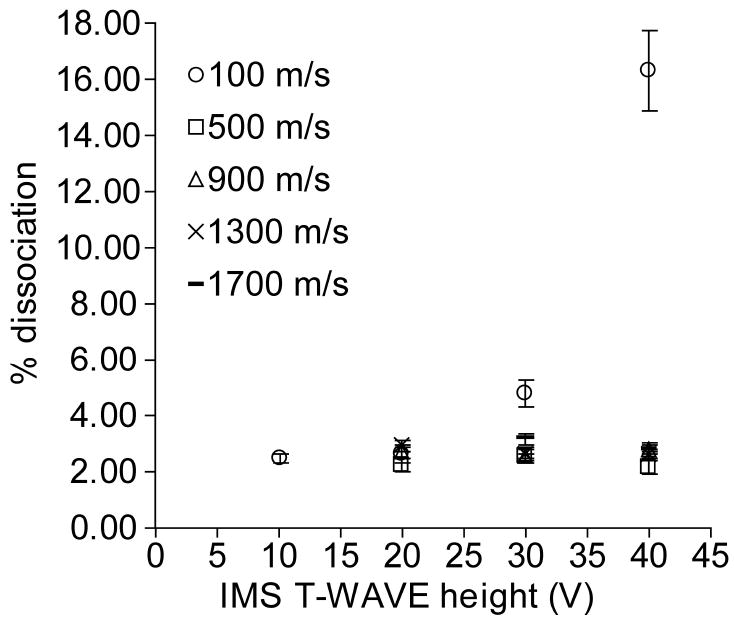
Percent dissociation as a function of traveling wave height at wave velocities of 100 (○), 500 (□), 900 (△), 1300 (×) and 1700 (−) m/s. A helium cell flow rate of 180 mL/min and nitrogen flow rate of 80 mL/min into the TWIMS cell were used for all experiments.
Where dissociation occurs
Dissociation of the singly protonated leucine enkephalin dimer could potentially occur at any time between selection in the quadrupole and analysis by TOF. If dissociation occurs before the TWIMS cell, fragments would have distinct drift profiles with drift times less than that of the precursor if they have greater mobilities. Fragments would have drift times equal to that of the precursor if dissociation occurs after the TWIMS cell, whereas dissociation of the precursor within the TWIMS cell would result in fragments having drift times between these two extremes. To determine where activation of the singly protonated leucine enkephalin dimer occurs, drift profiles of the dimer, monomer, and all fragments observed were examined at collision cell potentials of 2 V (same as the potential applied to the cell for collection of the mass spectra in Figure 2) and 30 V. A potential of 30 V causes 99.6% dissociation of protonated leucine enkephalin dimer, with the monomer ion representing 98.8% of the total ion intensity. Profiles for the dimer, monomer, and the b3+ fragment acquired at both collision cell potentials and a constant wave velocity of 900 m/s and wave height of 40 V are shown in Figure 4. The dimer has a drift time of 13.02 ms (Figure 4a), and distributions of this ion with and without collisional activation prior to injection to the TWIMS cell are indistinguishable from one another. The tailing to greater drift times, including the wrap-around of ions to drift times of 0 – 4 ms (which occurs as a result of the fixed number of drift bins and small drift bin size used), could be due to the dimer ion adopting more elongated conformations before and/or during the drift experiment.
Fig. 4.
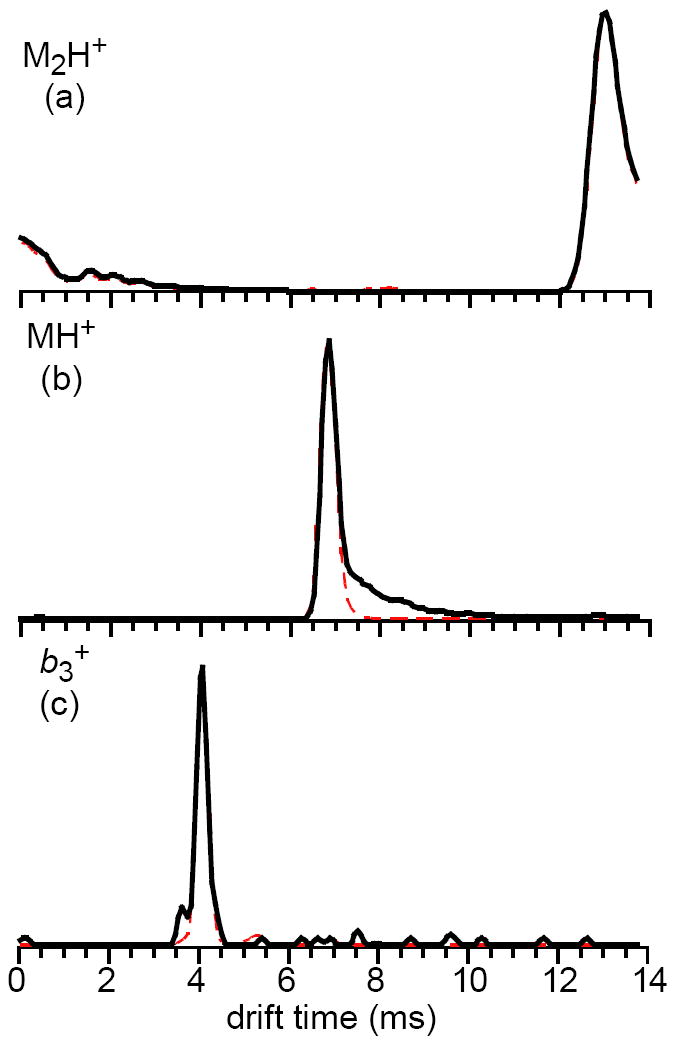
Intensity-normalized drift profiles for the protonated leucine enkephalin dimer (a), protonated monomer (b), and b3+ fragment ion (c), for dimer ions that were dissociated at collision cell potentials of 30 V (red dotted lines) and 2 V (black solid lines).
The protonated monomer has a peak with a drift time of 6.93 ms when this ion is formed by dissociation of the protonated dimer in the collision cell. The drift distribution for the protonated monomer formed without collisional activation has a maximum intensity at the same drift time. The peak widths for both distributions are also similar (~350 μs). However, there is noticeable tailing to greater drift times for ions formed without intentional collisional activation compared to those formed by collisional activation (Figure 4b). Both peaks are normalized for intensity; there is ~80× more monomer formed in the collision cell compared to when these ions are formed by injection of the dimer, indicating the tailing for the latter drift profile is not due to space-charge effects. Additionally, no tailing to greater drift times occurs for fragment ions of the protonated monomer. For example, the distributions of b3+ are virtually indistinguishable for both collision energies (Figure 4c). Similar results were obtained at all other traveling wave velocities examined. These data indicate that most of the activation and subsequent dissociation of the leucine enkephalin dimer occurs prior to or during injection into the TWIMS cell. It is possible that dissociation of the dimer within the helium and drift cells causes the tailing to greater drift times for the protonated monomer. Morsa et al. reported that the fragments of the benzylpyridinium ion formed within the TWIMS cell were fairly constant in intensity across the range of drift times between the fragment formed prior to the TWIMS cell and the precursor [50]. The tailing towards greater drift times for leucine enkephalin monomer ions is likely from monomers that are formed in the TWIMS cell as a result of metastable decay of a small fraction of dimer ions that have been activated during injection into the drift cell. Because the extent of this tailing is minor and only observed for the monomer ions, abundances were integrated over the entire distribution of monomer ions assuming they arose from a single process.
Effects of helium cell and TWIMS cell gas flow rates
The data shown in Figures 2-4 suggest that the greatest activation of protonated leucine enkephalin dimer occurs prior to or during injection into the TWIMS cell. Therefore, to evaluate the effects of the helium cell pressure on dissociation, similar drift experiments were performed at differing combinations of helium cell and TWIMS cell gas flow rates keeping all other parameters the same. Results of these experiments at a constant traveling wave velocity of 900 m/s and traveling wave height of 40 V are shown in Figure 5. Lowering the helium cell flow rate to 75 mL/min while keeping the TWIMS cell flow rate constant (80 mL/min) results in 75 ± 6% dissociation, with the monomer abundance approximately three times greater than that of the dimer ion (Figure 5a); in comparison, only 2.8 ± 0.1% dissociation is observed with a helium cell flow rate of 180 mL/min (Figure 2b). These data provide additional evidence that injection of ions into the TWIMS cell causes the majority of ion activation, and that a high pressure of helium collisionally cools the ions during injection.
Fig. 5.
Mass spectra of the mass-selected leucine enkephalin dimer, acquired in TWIMS-MS mode with a constant wave velocity of 900 m/s and wave height of 40 V, with differing combinations of helium and TWIMS cell flow rates: (a) helium = 75 mL/min, TWIMS = 80 mL/min, (b) helium = 180 mL/min, TWIMS = 20 mL/min and (c) helium = 75 mL/min, TWIMS = 20 mL/min. In (b), the peaks at m/z 150 and 400, highlighted with asterisks, are noise.
The effect of varying the TWIMS flow rate on the extent of dissociation was also examined. A nitrogen flow rate of 20 mL/min into the TWIMS cell results in 0.40 ± 0.02 and 2.1 ± 0.1% dissociation at helium cell flow rates of 180 and 75 mL/min, respectively, which is significantly lower than the dissociation observed at the higher (80 mL/min) nitrogen flow rate (Figure 5b and c compared to Figures 2b and 5a, respectively). Although dissociation decreases significantly with decreasing TWIMS cell flow rate, so does the range of drift times across which ions are observed. For example, at a helium cell flow rate of 180 mL/min and TWIMS cell flow rate of 80 mL/min, the singly protonated leucine enkephalin dimer and monomer have drift times of 13.02 and 6.93 ms, respectively. Decreasing the TWIMS cell flow rate to 20 mL/min while keeping the helium cell flow rate constant results in the same ions having drift times of 2.29 and 1.59 ms, respectively. In order to have optimum peak capacity, both the traveling wave height and wave velocity would need to be changed at these flow rates of gases into the helium and TWIMS cells. In all instances, the drift distributions of the monomer and fragment ions were indistinguishable from those formed by dissociating the dimer in the collision cell, with the exception of the tailing in the monomer ion distribution (data not shown). This indicates that the increased dissociation that occurs when higher nitrogen gas flows are introduced into the TWIMS cell is a result of collisional activation during injection, prior to TWIMS analysis.
The data in Figures 2 and 5 show that ion activation within the TWIMS cell is reduced at a high helium flow rate and a low nitrogen flow rate into the TWIMS cell. However, fragment mobility distributions formed by activation during TWIMS have identical peak centers and widths as fragments formed by dissociation of protonated leucine enkephalin dimer in the collision cell prior to the TWIMS cell (Figure 4), indicating that activation and dissociation occur prior to or during injection into the TWIMS cell. A 200 μs-wide pulse was applied to the gate (Figure 1) to inject ions into the TWIMS cell for all experiments. Decreasing the gate pulse width to 100, 50, or 25 μs does not significantly change the peak widths or the extent of ion activation, but total ion current decreases by ~1, 8, and 60%, respectively, relative to the total ion current observed with a 200 μs gate width. The minimal decrease in ion current between the 200 and 50 μs ion injection times indicates that the width of the initial ion packet is roughly 50 μs wide irrespective of whether longer injection times are used. Because there is no change in the drift time of the vast majority of the ions, whether they are formed prior to or during ion injection, the drift bin size of 70 μs provides an upper limit to the timescale for ion dissociation. There is a small fraction of monomers that are formed in the TWIMS cell from metastable decay as indicated by the tailing in the drift profiles for these ions. This suggests that there is a higher energy tail in the internal energy of this population that is not fully accounted for in this analysis. A time of 70 μs can then be used to determine a lower limit to the ion effective temperature via the Arrhenius equation. Using Arrhenius parameters of Ea = 1.6 eV and log(A) = 17.2 for the dissociation of the singly protonated leucine enkephalin dimer measured by Schnier et al. [44], a lower limit to the ion effective temperature of ~553 K is obtained for singly protonated leucine enkephalin dimer during injection into the TWIMS cell under operating conditions near the manufacturer’s suggested values (a helium flow rate of 180 mL/min, nitrogen flow rate into the TWIMS cell of 80 mL/min, and traveling wave velocity greater than 500 m/s).
Dimer ions had drift times ranging from ~2 – 24 ms depending on experimental conditions. No dissociation occurs in the TWIMS cell above that measured during ion injection for drift times up to 24 ms. The standard deviation in the measured dissociation extent (±0.2%) can be used determine the maximum extent of dissociation that could have occurred in the TWIMS cell. Using a value of two times the standard deviation as our detection limit, the effective temperature of the protonated leucine enkephalin dimer must be below ~449 K during the TWIMS separation.
Other Thermometer Ions and Protein Conformational Changes
Similar experiments at the same TWIMS settings that minimized heating of protonated leucine enkephalin dimer (helium flow rate of 180 mL/min, TWIMS flow rate of 80 mL/min, traveling wave velocity of 900 m/s, traveling wave height of 40 V) were done with the 10+ and 11+ charge states of myoglobin, as well as hydrated clusters of divalent calcium. For myoglobin, 2.3 ± 0.2 and 5.4 ± 0.3% dissociation (loss of heme+) occurs for the 10+ and 11+ charge states, respectively. As was the case for protonated leucine enkephalin dimer, fragment ions had the same drift times as those formed in the collision cell prior to the TWIMS cell (data not shown) indicating that dissociation occurs during injection of these ions into the TWIMS cell and in less time than the 70 μs drift bin size. The extents of dissociation correspond to internal temperatures of 700 K and 744 K for the myoglobin 10+ and 11+ using 70 μs and the previously reported Arrhenius parameters for these ions [45]. Because no further dissociation occurs for either ion over the course of the drift experiment, an upper limit to the ion effective temperature during the TWIMS separation of ~470 K can be established. Without TWIMS, hydrated calcium with up to several hundred water molecules could be measured. However, no hydrated ions with more than four water molecules were detected with TWIMS-MS, indicating that substantial ion heating occurred.
Conformations adopted by protein ions in the gas phase are influenced by solution composition [56], solution/source temperature [56], injection voltage [9, 10], and storage time prior to injection into a static-field IMS drift tube [11, 12]. Similarly, TWIMS conditions can lead to gas-phase unfolding of protein ions, as demonstrated on a first generation TWIMS cell [35]. The activation that occurs when ions are injected into a second generation TWIMS cell can also result in changes to ion conformations (Figure 6). Drift distributions for protonated ubiquitin ions with between +5 and +13 charges are shown in Figure 6 (left). Drift times were converted to a collision cross section scale using the procedure outlined by Robinson and coworkers [36, 37] with denatured ions (the 9+ through 13+) as calibrants. Cross sections reported for lower charge state ions may have significant uncertainty (up to 5%) [37]. The cross sections of these ions span the range of ~1000-2100 Å2, with the lowest values observed for the lowest charge state ions. The distribution for ions with 6+ charges shows two families of conformers, one with cross section values as low as those for the 5+ ion distribution with a maximum at ~1311 Å2, and another that is more unfolded, with a maximum at ~1700 Å2. Additional elongation of ion conformation with increasing charge state continues up to the 13+ ion, the highest charge state observed, which has a distribution centered ~1974 Å2. Ions formed from the same solution composition have been analyzed using static-field IMS/MS. With the most gentle IMS instrumental conditions, ions with +5-7 charges are highly compact, and a transition from compact to partially folded to elongated occurs as the charge state increases [56, 57]. The more unfolded conformations of the intermediate charge states in these TWIMS experiments are similar to those observed when ions are heated in the source region [56] or within an RF-trap prior to injection to a drift tube [12]. The greater activation that occurs in TWIMS compared to static-field IMS when gentle conditions are used complicate the comparison of these data for the purpose of calibrating collision cross sections [58].
Fig. 6.
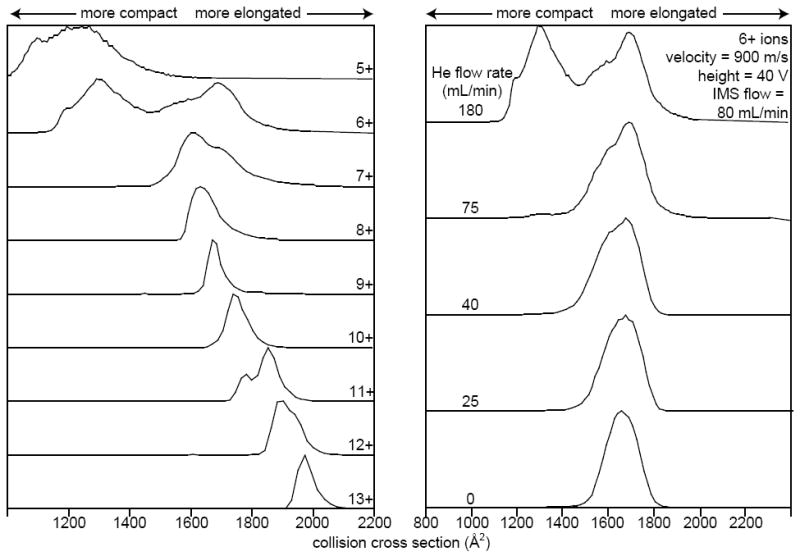
Collisional cross sections obtained from drift profiles for ubiquitin charge states 5+ through 13+ obtained with a helium flow rate of 180 mL/min, a flow rate of nitrogen into the TWIMS cell of 80 mL/min, traveling wave velocity of 900 m/s and wave height of 40 V (left). To the right are distributions of 6+ ions, acquired with a traveling wave velocity of 900 m/s, wave height of 40 V, and nitrogen flow rate into the TWIMS cell of 80 mL/min, and varying helium cell flow rate (decreasing from top to bottom).
To further examine the extent of ion heating caused by injection into the TWIMS cell, ubiquitin drift distributions were acquired at several helium cell flow rates while all other parameters were kept constant, and these data for ubiquitin 6+ are shown on the right of Figure 6. At the highest helium cell flow rate, distributions of a more folded population (~1311 Å2) and a more elongated population (~1700 Å2) are observed. At a flow rate of 125 mL/min in the helium cell, the more folded distribution is no longer observed, and all ions adopt more elongated conformations. This is consistent with more ion activation occurring at lower helium cell flow rates. The more elongated conformer or family of conformers remains the only feature for 6+ ions as the helium cell flow rate is decreased, although the peak center does shift slightly to a final collision cross section of ~1660 Å2 at a helium cell flow rate of 0 mL/min. In addition to the elongation of conformers, fragmentation of ubiquitin ions occurs at lower helium cell flow rates (not shown). These results show that the relative populations of unfolded and folded conformers can provide useful information about how experimental parameters affect the extent to which ion activation occurs.
Discussion and Concluding Remarks
Several thermometer ions were used to characterize the ion heating that occurs in a second generation TWIMS cell. Two-dimensional drift time-m/z data were obtained for singly protonated leucine enkephalin dimer as well as several charge states of myoglobin across a wide range of TWIMS operating parameters. Dissociation occurred upon injection into the TWIMS cell, but little if any dissociation occurs as these ions traverse the TWIMS cell. Data for leucine enkephalin, myoglobin, and hydrated calcium all suggest that injection of ions into the TWIMS cell causes ions to heat to internal temperatures of ~553 – 774 K, depending on the ion. This heating can be minimized by increasing the helium cell flow rate and/or decreasing the TWIMS cell flow rate, although the latter requires changes to the traveling wave height and wave velocity to maintain optimum IMS separation and peak capacity. Ion heating could also be minimized by lowering the injection energy of the ions, although there is a tradeoff with sensitivity. An upper limit to the effective temperatures of 449 K and 470 K for the protonated leucine enkephalin dimer and the 10+ and 11+ ions of myoglobin, respectively, were obtained for these ions during TWIMS analysis across a wide range of wave velocities and wave heights typically employed. These values are well below the upper estimate of Shvartsburg and Smith [32], and are also lower than those reported by Morsa et al. [50].
The extent of ion activation that occurs will depend on many factors, including ion charge state, mass, conformation, and instrumental parameters. For large ions that are significantly folded, neither the charge state nor the collisional cross section increase linearly with mass. For example, the cross section of a spherical polymer increases by ~(mass)2/3. Thus, the extent of collisional activation per degree of freedom should decrease with ion size for large proteins and protein complexes formed from aqueous solutions in which native conformations are more stable. This should result in lower effective temperatures with increasing ion size when these ions retain compact conformations through the ESI process and into the gas phase. The higher effective temperatures for myoglobin compared to protonated leucine enkephalin dimer may be an artifact of the minimal myoglobin dissociation that occurred. The observed fragments may reflect a small population of less stable ions than those for which Arrhenius parameters were measured previously [45]. Dissociation of the protonated leucine enkephalin dimer into monomer is entropically favorable, and similar Arrhenius parameters for dissociation of this ion have been measured across a wide range of temperatures [44, 47, 51]. Thus, the effective temperatures reported for this ion are expected to be the most accurate. The results for ubiquitin show that ion heating and conformational changes induced by TWIMS occur for this protein, and that ion heating can complicate attempts to relate gas-phase and solution-phase structures for small proteins or other similar size molecules. These effects are largely a result of ion injection into the cell as opposed to the TWIMS separation itself, and gentler injection conditions could significantly reduce any conformational changes induced by TWIMS analysis.
Supplementary Material
Acknowledgments
The authors acknowledge financial support from the National Institutes of Health (Grants R01GM096097-01 and 5F32GM093593-02 for fellowship support for S.I.M.). The authors also thank Professor Ewa Witkowska and Dr. Haichuan Liu of the UCSF Sandler-Moore Mass Spectrometry Core Facility for the use of their Synapt G2 instrument.
References
- 1.Mason EA, McDaniel EW. Transport Properties of Ions in Gases. Wiley; New York: 1988. [Google Scholar]
- 2.Cohen MJ, Karasek FW. Plasma Chromatography - A New Dimension for Gas Chromatography and Mass Spectrometry. J Chromatogr Sci. 1970;8:330–337. [Google Scholar]
- 3.Kemper PR, Bowers MT. Electronic-State Chromatography - Application to 1st-Row Transition-Metal Ions. J Phys Chem. 1991;95:5134–5146. [Google Scholar]
- 4.Bowers MT, Kemper PR, von Helden G, van Koppen PAM. Gas-Phase Ion Chromatography - Transition-Metal State Selection and Carbon Cluster Formation. Science. 1993;260:1446–1451. doi: 10.1126/science.260.5113.1446. [DOI] [PubMed] [Google Scholar]
- 5.St. Louis RH, Hill HH, Eiceman GA. Ion Mobility Spectrometry in Analytical-Chemistry. Crit Rev Anal Chem. 1990;21:321–355. doi: 10.1021/ac00222a001. [DOI] [PubMed] [Google Scholar]
- 6.Eiceman GA. Advances in Ion Mobility Spectrometry - 1980-1990. Crit Rev Anal Chem. 1991;22:17–36. [Google Scholar]
- 7.Jarrold MF. Drift-Tube Studies of Atomic Clusters. J Phys Chem. 1995;99:11–21. [Google Scholar]
- 8.Wyttenbach T, von Helden G, Bowers MT. Gas-Phase Conformation of Biological Molecules: Bradykinin. J Am Chem Soc. 1996;118:8355–8364. [Google Scholar]
- 9.Shelimov KB, Clemmer DE, Hudgins RR, Jarrold MF. Protein Structure in Vacuo: Gas-Phase Confirmations of BPTI and Cytochrome c. J Am Chem Soc. 1997;119:2240–2248. [Google Scholar]
- 10.Valentine SJ, Anderson JG, Ellington AD, Clemmer DE. Disulfide-Intact and -Reduced Lysozyme in the Gas Phase: Conformations and Pathways of Folding and Unfolding. J Phys Chem B. 1997;101:3891–3900. [Google Scholar]
- 11.Badman ER, Hoaglund-Hyzer CS, Clemmer DE. Monitoring Structural Changes of Proteins in an Ion Trap over ~10-200 ms: Unfolding Transitions in Cytochrome c Ions. Anal Chem. 2001;73:6000–6007. doi: 10.1021/ac010744a. [DOI] [PubMed] [Google Scholar]
- 12.Myung S, Badman ER, Lee YJ, Clemmer DE. Structural Transitions of Electrosprayed Ubiquitin Ions Stored in an Ion Trap over ~10 ms to 30 s. J Phys Chem A. 2002;106:9976–9982. [Google Scholar]
- 13.Li JW, Taraszka JA, Counterman AE, Clemmer DE. Influence of Solvent Composition and Capillary Temperature on the Conformations of Electrosprayed Ions: Unfolding of Compact Ubiquitin Conformers from Pseudonative and Denatured Solutions. Int J Mass Spectrom. 1999;185/186/187:37–47. [Google Scholar]
- 14.Loo JA, Berhane B, Kaddis CS, Wooding KM, Xie YM, Kaufman SL, Chernushevich IV. Electrospray Ionization Mass Spectrometry and Ion Mobility Analysis of the 20S Proteasome Complex. J Am Soc Mass Spectrom. 2005;16:998–1008. doi: 10.1016/j.jasms.2005.02.017. [DOI] [PubMed] [Google Scholar]
- 15.Ruotolo BT, Giles K, Campuzano I, Sandercock AM, Bateman RH, Robinson CV. Evidence for Macromolecular Protein Rings in the Absence of Bulk Water. Science. 2005;310:1658–1661. doi: 10.1126/science.1120177. [DOI] [PubMed] [Google Scholar]
- 16.Uetrecht C, Versluis C, Watts NR, Wingfield PT, Steven AC, Heck AJR. Stability and Shape of Hepatitis B Virus Capsids in Vacuo. Angew Chem-Int Edit. 2008;47:6247–6251. doi: 10.1002/anie.200802410. [DOI] [PMC free article] [PubMed] [Google Scholar]
- 17.Thomas JJ, Bothner B, Traina J, Benner WH, Siuzdak G. Electrospray Ion Mobility Spectrometry of Intact Viruses. Spectr-Int J. 2004;18:31–36. [Google Scholar]
- 18.McAfee KB, Edelson D. Identification and Mobility of Ions in a Townsend Discharge by Time-Resolved Mass Spectrometry. Proc Phys Soc London. 1963;81:382–384. [Google Scholar]
- 19.McKnight LG, McAfee KB, Sipler DP. Low-Field Drift Velocities and Reactions of Nitrogen Ions in Nitrogen. Phys Rev. 1967;164:62–70. [Google Scholar]
- 20.Young CE, Edelson D, Falconer WE. Water Cluster Ions - Rates of Formation and Decomposition of Hydrates of Hydronium Ion. J Chem Phys. 1970;53:4295–4302. [Google Scholar]
- 21.Hoaglund CS, Valentine SJ, Sporleder CR, Reilly JP, Clemmer DE. Three-Dimensional Ion Mobility TOFMS Analysis of Electrosprayed Biomolecules. Anal Chem. 1998;70:2236–2242. doi: 10.1021/ac980059c. [DOI] [PubMed] [Google Scholar]
- 22.Gillig KJ, Ruotolo B, Stone EG, Russell DH, Fuhrer K, Gonin M, Schultz AJ. Coupling High-Pressure MALDI with Ion Mobility/Orthogonal Time-of Flight Mass Spectrometry. Anal Chem. 2000;72:3965–3971. doi: 10.1021/ac0005619. [DOI] [PubMed] [Google Scholar]
- 23.Purves RW, Guevremont R, Day S, Pipich CW, Matyjaszczyk MS. Mass Spectrometric Characterization of a High-Field Asymmetric Waveform Ion Mobility Spectrometer. Rev Sci Instrum. 1998;69:4094–4105. [Google Scholar]
- 24.Kemper PR, Dupuis NF, Bowers MT. A New, Higher Resolution, Ion Mobility Mass Spectrometer. Int J Mass Spectrom. 2009;287:46–57. [Google Scholar]
- 25.Purves RW, Guevremont R. Electrospray Ionization High-Field Asymmetric Waveform Ion Mobility Spectrometry-Mass Spectrometry. Anal Chem. 1999;71:2346–2357. doi: 10.1021/ac981380y. [DOI] [PubMed] [Google Scholar]
- 26.Robinson EW, Williams ER. Multidimensional Separations of Ubiquitin Conformers in the Gas Phase: Relating Ion Cross Sections to H/D Exchange Measurements. J Am Soc Mass Spectrom. 2005;16:1427–1437. doi: 10.1016/j.jasms.2005.04.007. [DOI] [PMC free article] [PubMed] [Google Scholar]
- 27.Tang KQ, Li FM, Shvartsburg AA, Strittmatter EF, Smith RD. Two-Dimensional Gas-Phase Separations Coupled to Mass Spectrometry for Analysis of Complex Mixtures. Anal Chem. 2005;77:6381–6388. doi: 10.1021/ac050871x. [DOI] [PMC free article] [PubMed] [Google Scholar]
- 28.Shvartsburg AA, Li FM, Tang KQ, Smith RD. High-Resolution Field Asymmetric Waveform Ion Mobility Spectrometry Using New Planar Geometry Analyzers. Anal Chem. 2006;78:3706–3714. doi: 10.1021/ac052020v. [DOI] [PMC free article] [PubMed] [Google Scholar]
- 29.Pringle SD, Giles K, Wildgoose JL, Williams JP, Slade SE, Thalassinos K, Bateman RH, Bowers MT, Scrivens JH. An Investigation of the Mobility Separation of Some Peptide and Protein Ions Using a New Hybrid Quadrupole/Travelling Wave Ims/oa-ToF Instrument. Int J Mass Spectrom. 2007;261:1–12. [Google Scholar]
- 30.Giles K, Williams JP, Campuzano I. Enhancements in Travelling Wave Ion Mobility Resolution. Rapid Commun Mass Spectrom. 2011;25:1559–1566. doi: 10.1002/rcm.5013. [DOI] [PubMed] [Google Scholar]
- 31.Giles K, Pringle SD, Worthington KR, Little D, Wildgoose JL, Bateman RH. Applications of a Travelling Wave-Based Radio-Frequency Only Stacked Ring Ion Guide. Rapid Commun Mass Spectrom. 2004;18:2401–2414. doi: 10.1002/rcm.1641. [DOI] [PubMed] [Google Scholar]
- 32.Shvartsburg AA, Smith RD. Fundamentals of Traveling Wave Ion Mobility Spectrometry. Anal Chem. 2008;80:9689–9699. doi: 10.1021/ac8016295. [DOI] [PMC free article] [PubMed] [Google Scholar]
- 33.Zhong YY, Hyung SJ, Ruotolo BT. Characterizing the Resolution and Accuracy of a Second-Generation Traveling-Wave Ion Mobility Separator for Biomolecular Ions. Analyst. 2011;136:3534–3541. doi: 10.1039/c0an00987c. [DOI] [PubMed] [Google Scholar]
- 34.Shvartsburg AA, Li FM, Tang KQ, Smith RD. Distortion of Ion Structures by Field Asymmetric Waveform Ion Mobility Spectrometry. Anal Chem. 2007;79:1523–1528. doi: 10.1021/ac061306c. [DOI] [PubMed] [Google Scholar]
- 35.Michaelevski I, Eisenstein M, Sharon M. Gas-Phase Compaction and Unfolding of Protein Structures. Anal Chem. 2010;82:9484–9491. doi: 10.1021/ac1021419. [DOI] [PubMed] [Google Scholar]
- 36.Ruotolo BT, Benesch JLP, Sandercock AM, Hyung SJ, Robinson CV. Ion Mobility-Mass Spectrometry Analysis of Large Protein Complexes. Nat Protoc. 2008;3:1139–1152. doi: 10.1038/nprot.2008.78. [DOI] [PubMed] [Google Scholar]
- 37.Bush MF, Hall Z, Giles K, Hoyes J, Robinson CV, Ruotolo BT. Collision Cross Sections of Proteins and Their Complexes: A Calibration Framework and Database for Gas-Phase Structural Biology. Anal Chem. 2010;82:9557–9565. doi: 10.1021/ac1022953. [DOI] [PubMed] [Google Scholar]
- 38.Bafus DA, Gallegos EJ, Kiser RW. An Electron Impact Investigation of Some Alkylphosphate Esters. J Phys Chem. 1966;70:2614–2619. [Google Scholar]
- 39.Schultz RH, Crellin KC, Armentrout PB. Sequential Bond-Energies of Fe(CO)x+ (x = 1-5) - Systematic Effects on Collision-Induced Dissociation Measurements. J Am Chem Soc. 1991;113:8590–8601. [Google Scholar]
- 40.Morris MR, Riederer DE, Winger BE, Cooks RG, Ast T, Chidsey CED. Ion Surface Collisions at Functionalized Self-Assembled Monolayer Surfaces. Int J Mass Spectrom Ion Process. 1992;122:181–217. [Google Scholar]
- 41.Griffiths IW, Harris FM, Mukhtar ES, Beynon JH. Calculation of the Abundance Ratio [91+/92+] from Normal-Butylbenzene Molecular-Ions as a Function of Internal Energy. Int J Mass Spectrom Ion Process. 1981;41:83–88. [Google Scholar]
- 42.Collette C, De Pauw E. Calibration of the Internal Energy Distribution of Ions Produced by Electrospray. Rapid Commun Mass Spectrom. 1998;12:165–170. [Google Scholar]
- 43.Price WD, Schnier PD, Jockusch RA, Strittmatter EF, Williams ER. Unimolecular Reaction Kinetics in the High-Pressure Limit without Collisions. J Am Chem Soc. 1996;118:10640–10644. doi: 10.1021/ja961812r. [DOI] [PMC free article] [PubMed] [Google Scholar]
- 44.Schnier PD, Price WD, Strittmatter EF, Williams ER. Dissociation Energetics and Mechanisms of Leucine Enkephalin (M+H)+ and (2M+X)+ Ions (X=H, Li, Na, K, and Rb) Measured by Blackbody Infrared Radiative Dissociation. J Am Soc Mass Spectrom. 1997;8:771–780. doi: 10.1016/S1044-0305(97)84129-3. [DOI] [PMC free article] [PubMed] [Google Scholar]
- 45.Gross DS, Zhao YX, Williams ER. Dissociation of Heme-Globin Complexes by Blackbody Infrared Radiative Dissociation: Molecular Specificity in the Gas Phase? J Am Soc Mass Spectrom. 1997;8:519–524. doi: 10.1016/S1044-0305(97)00010-X. [DOI] [PMC free article] [PubMed] [Google Scholar]
- 46.Wong RL, Paech K, Williams ER. Blackbody Infrared Radiative Dissociation at Low Temperature: Hydration of X2+(H2O)n, for X = Mg, Ca. Int J Mass Spectrom. 2004;232:59–66. [Google Scholar]
- 47.Meotner M, Dongre AR, Somogyi A, Wysocki VH. Thermal-Decomposition Kinetics of Protonated Peptides and Peptide Dimers, and Comparison with Surface-Induced Dissociation. Rapid Commun Mass Spectrom. 1995;9:829–836. doi: 10.1002/rcm.1290090922. [DOI] [PubMed] [Google Scholar]
- 48.Leib RD, Donald WA, Bush MF, O’Brien JT, Williams ER. Internal Energy Deposition in Electron Capture Dissociation Measured Using Hydrated Divalent Metal Ions as Nanocalorimeters. J Am Chem Soc. 2007;129:4894–4895. doi: 10.1021/ja0666607. [DOI] [PMC free article] [PubMed] [Google Scholar]
- 49.Donald WA, Williams ER. Measuring the Extent and Width of Internal Energy Deposition in Ion Activation Using Nanocalorimetry. J Am Soc Mass Spectrom. 2010;21:615–625. doi: 10.1016/j.jasms.2009.12.006. [DOI] [PubMed] [Google Scholar]
- 50.Morsa D, Gabelica V, De Pauw E. Effective Temperature of Ions in Traveling Wave Ion Mobility Spectrometry. Anal Chem. 2011;83:5775–5782. doi: 10.1021/ac201509p. [DOI] [PubMed] [Google Scholar]
- 51.Sztaray J, Memboeuf A, Drahos L, Vekey K. Leucine Enkephalin-a Mass Spectrometry Standard. Mass Spectrom Rev. 2011;30:298–320. doi: 10.1002/mas.20279. [DOI] [PubMed] [Google Scholar]
- 52.Hoadlund-Hyzer CS, Li JW, Clemmer DE. Mobility Labeling for Parallel CID of Ion Mixtures. Anal Chem. 2000;72:2737–2740. doi: 10.1021/ac0000170. [DOI] [PubMed] [Google Scholar]
- 53.Lee YJ, Hoaglund-Hyzer CS, Taraszka JA, Zientara GA, Counterman AE, Clemmer DE. Collision-Induced Dissociation of Mobility-Separated Ions Using an Orifice-Skimmer Cone at the Back of a Drift Tube. Anal Chem. 2001;73:3549–3555. doi: 10.1021/ac010295e. [DOI] [PubMed] [Google Scholar]
- 54.Price WD, Williams ER. Activation of Peptide Ions by Blackbody Radiation: Factors That Lead to Dissociation Kinetics in the Rapid Energy Exchange Limit. The Journal of Physical Chemistry A. 1997;101:8844–8852. doi: 10.1021/jp9722418. [DOI] [PMC free article] [PubMed] [Google Scholar]
- 55.Schnier PD, Jurchen JC, Williams ER. The Effective Temperature of Peptide Ions Dissociated by Sustained Off-Resonance Irradiation Collisional Activation in Fourier Transform Mass Spectrometry. The Journal of Physical Chemistry B. 1999;103:737–745. doi: 10.1021/jp9833193. [DOI] [PMC free article] [PubMed] [Google Scholar]
- 56.Li JW, Taraszka JA, Counterman AE, Clemmer DE. Influence of Solvent Composition and Capillary Temperature on the Conformations of Electrosprayed Ions: Unfolding of Compact Ubiquitin Conformers from Pseudonative and Denatured Solutions. Int J Mass Spectrom. 1999;187:37–47. [Google Scholar]
- 57.Koeniger SL, Clemmer DE. Resolution and Structural Transitions of Elongated States of Ubiquitin. J Am Soc Mass Spectrom. 2007;18:322–331. doi: 10.1016/j.jasms.2006.09.025. [DOI] [PubMed] [Google Scholar]
- 58.Merenbloom SI, Flick TG, Daly MP, Williams ER. Effects of Select Anions from the Hofmeister Series on the Gas-Phase Conformations of Protein Ions Measured with Traveling-Wave Ion Mobility Spectrometry/Mass Spectrometry. J Am Soc Mass Spectrom. 2011;22:1978–1990. doi: 10.1007/s13361-011-0238-1. [DOI] [PMC free article] [PubMed] [Google Scholar]
Associated Data
This section collects any data citations, data availability statements, or supplementary materials included in this article.