

Abstract
Objective
Despite behavioral differences between genetic subtypes of Prader-Willi syndrome, no studies have been published characterizing brain structure in these subgroups. Our goal was to examine differences in the brain structure phenotype of common subtypes of Prader-Willi syndrome (PWS) [chromosome 15q deletions and maternal uniparental disomy 15 (UPD)].
Methods
Fifteen individuals with PWS due to a typical deletion ((DEL) Type I; n=5, Type II; n=10), 8 with PWS due to UPD, and 25 age-matched healthy-weight individuals (HWC) participated in structural magnetic resonance imaging (MRI) scans. A custom voxel-based morphometry processing stream was used to examine regional differences in gray and white matter volume between groups, covarying for age, sex, and body mass index (BMI).
Results
Overall, compared to HWC, PWS individuals had lower gray matter volumes that encompassed the prefrontal, orbitofrontal and temporal cortices, hippocampus and parahippocampal gyrus, and lower white matter volumes in the brain stem, cerebellum, medial temporal and frontal cortex. Compared to UPD, the DEL subtypes had lower gray matter volume primarily in the prefrontal and temporal cortices, and lower white matter in the parietal cortex. The UPD subtype had more extensive lower gray and white matter volumes in the orbitofrontal and limbic cortices compared to HWC.
Conclusions
These preliminary findings are the first structural neuroimaging findings to support potentially separate neural mechanisms mediating the behavioral differences seen in these genetic subtypes.
Keywords: chromosome 15q, hyperphagia, obesity, voxel-based morphometry, MRI
Introduction
Prader-Willi syndrome (PWS) is a neurogenetic disorder in which imprinted genes on the proximal long arm of chromosome 15 are affected. PWS is caused by a lack of paternal genetic information at 15q11-q13 due to a deletion on the paternal chromosome (DEL) (70%), maternal uniparental disomy (UPD) (25%), or imprinting defects, atypical deletions, or chromosome 15 translocations (5%) 1. In the typical deletion group, the length of this deletion varies, such that two classes of individuals with the typical deletion have been identified: the longer Type I deletion and the shorter Type II deletion 2–5. As a whole, these different genetic changes result in developmental delay, learning disabilities, psychiatric problems, speech delay, physical anomalies, hyperphagia, and early-onset childhood obesity 2; 6. Of these, the most prominent characteristics in children are mental deficiency, hyperphagia and obesity 7. One of the consequences of unattended hyperphagia, or an insatiable appetite, is an over-consumption of calories and, in 1/3 of the PWS population, maintenance of over 200% ideal bodyweight. Moreover, there are behavioral differences between the genetic subtypes of PWS. For instance, individuals with the DEL subtype have more severe behavioral problems, such as compulsive and self-injurious behaviors, than individuals with maternal uniparental disomy (UPD), who generally demonstrate higher Verbal IQ and academic performance scores 8. However, individuals with UPD may also be at increased risk for symptoms of autism 9; 10 as well as psychiatric disorders 11; 12 Thus, further delineation of the distinctions between genetic subtypes will be important for understanding the pathophysiology of PWS.
There have been a limited number of studies characterizing the neuroanatomy in individuals with PWS. Reported morphological abnormalities include global cortical atrophy and smaller brainstems 13, anomalous Sylvian fissures14, partial cerebellar hyperplasia15, larger ventricles, parieto-occipital lobe abnormalities, and lack of insula closure 16; 17. While these initial studies used visual and radiological techniques to assess gross anatomical differences, a recent voxel-based morphometry (VBM) magnetic resonance imaging (MRI) study of gray matter detected small changes and further investigated frontal lobe volume. After controlling statistically for various factors, such as body mass index (BMI) and gray matter volume (GMV), the primary finding was lower gray matter volume in the orbitofrontal cortex of PWS compared to healthy weight controls 18. These reported abnormalities suggest that there may be neuroanatomical differences in individuals with PWS that underlie the neurobehavioral profile of the disease. However, no structural imaging studies of any sort have investigated differences in gray or white matter volume between genetic subtypes of PWS.
Our group recently completed a functional imaging study that showed possible divergent neural mechanisms associated with different behavioral phenotypes in genetic subtypes of PWS 19. For instance, individuals with the deletion subtype have more severe behavioral problems than those with UPD 20; 21, and in our functional magnetic resonance imaging (fMRI) study individuals with the DEL subtype had increased and more widespread brain activation before and after eating compared to the UPD group 19. While these findings begin to point to different gene-brain-behavior relationships, to date, there are no published MRI studies investigating brain volume differences between DEL and UPD subtypes and healthy weight controls (HWC). Therefore, we sought to characterize regional gray and white matter differences using VBM methodologies.
Materials and Methods
Subjects
This study was approved by the Human Subjects Committees at the University of Kansas Medical Center. We certify that all applicable institutional and governmental regulations concerning the ethical use of human volunteers were followed during this research. Written informed consent was obtained from parents/guardians and assent was obtained from 23 individuals with Prader-Willi syndrome (15 F/ 8 M), and 25 typically developing healthy weight control subjects (14 F/ 11 M; HWC Group). Individuals from this study were part of a larger study that investigated food reward motivation differences between genetic subgroups in PWS using fMRI 21. Diagnosis of PWS was confirmed through chromosomal and DNA molecular analysis as previously described 21. Concomitant psychotropic medications included (number of subjects in parentheses): UPD group: clonazepam (1), buspirone (1), trazodone (1), and lithium (1); DEL group: buspirone (1), lithium (1), and seroquel (1). Additionally, 1 DEL participant was being treated for hypothyroidism. Among the PWS participants, 6 (2 DEL, 4 UPD) were currently on growth hormone treatment; none had a history of appetite suppressant use. None were on sex hormone replacement. For adults with PWS in this study, IQ was obtained using the Wechsler Adult Intelligence Scale- Version 3 (WAIS-III)22; 23, and for children with PWS (under age 16), the Wechsler Intelligence Scale for Children version 3 (WISC-III)24. All HWC were tested with the Wechsler Abbreviated Scale of Intelligence (WASI).
Groups were matched on age [mean years of age (range) DEL = 25.2 (10–39); UPD = 17.4 (10–25); HWC = 22.3 (10–48); all t-tests n.s.; see Table 1 for group demographics]. The HWC group had a significantly lower BMI for age and sex as determined by standardized charts from the United States Centers for Disease Control than both PWS subgroups (HWC vs. DEL: p < .05; HWC vs. UPD: p < .05). The DEL and UPD groups were significantly different in IQ (p = .042), with the mean of the UPD group being slightly higher at 69.8 vs. the DEL group at 60.1. DEL and UPD groups did not differ in BMI. No subjects had a history of neurological illness.
Table 1.
Demographic Data
| PWS | Control | p value | ||||
|---|---|---|---|---|---|---|
| Mean (SD) | DEL | UPD | HWC | DEL vs HWC | UPD vs HWC | UPD vs DEL |
| N | 15 | 8 | 25 | |||
| Age (years) | 25.2 (13.6) | 17.4 (6.5) | 22.3 (10.8) | 0.465 | 0.233 | 0.143 |
| Sex (female: male) | 12:3 | 3:5 | 14:11 | 0.123 | 0.362 | 0.042 |
| Body mass index | 33.0 (8.6) | 29.8 (10.2) | 20.7 (2.8) | <.001 | <.001 | 0.425 |
| IQ | 60.1 (8.2) | 69.8 (13.1) | 118.4 (11.1)° | <.001 | <.001 | 0.042 |
|
| ||||||
| Global Brain Volumes, mean volume, ×103 mm3 (SD) | ||||||
|
| ||||||
| GMV | 646 (29) | 695 (67) | 719 (63) | <.001 | 0.36 | 0.025 |
| WMV | 458 (26) | 461 (41) | 511 (46) | <.001 | 0.012 | 0.832 |
| CSF | 286 (32) | 287 (39) | 298 (26) | 0.193 | 0.362 | 0.947 |
| TICV | ||||||
| (GM + WM + CSF) | 1391 (73) | 1444 (142) | 1529 (126) | <.001 | 0.115 | 0.249 |
IQ was only collected on 10 out of 25 HWC individuals
Three-Factor Eating Questionnaire (TFEQ)
Eating behavior was measured using a modified version of the TFEQ 25. The TFEQ assesses degree of dietary restriction, eating disinhibition, and hunger level. For the purposes of this study, only the 13 initial items on this questionnaire were used. These questions ask individuals to rate their behavior on a 4-point scale (with lower rating indicating lower dietary restriction, lower eating disinhibition, and lower hunger levels). For individuals who were children, parents or guardians completed the TFEQ on their child/ward. Individuals in the HWC group completed self-report versions of the TFEQ.
MRI acquisition
Scanning was performed on a 3 Tesla Siemens Allegra (Siemens, Erlangen, Germany) fitted with a quadrature head coil at the University of Kansas School of Medicine, Hoglund Brain Imaging Center. Participant’s heads were immobilized with head cushions. Coronal high-resolution T1-weighted anatomical images were acquired using 3D MPRAGE sequences with repetition time/echo time (TR/TE) = 23/4ms, flip angle = 8°, field of view (FOV) = 256 mm, matrix = 256 × 192, slice thickness = 1mm. Every scan was checked for image artifacts and gross anatomical abnormalities.
MRI Data Analysis
Data analysis for 47 subjects was performed using Statistical Parametric Mapping version 8 (SPM8) algorithms (Wellcome Department of Cognitive Neurology, London, UK) running under MATLAB 7.2 (The MathWorks, Natick, MA, USA) on Linux. Processing for VBM analysis was done by first creating a sample-specific DARTEL template (Diffeomorphic Anatomical Registration Through Exponentiated Lie algebra). DARTEL is a suite of tools for achieving more accurate inter-subject registration of brain images26, increasing localization as well as sensitivity for VBM studies. We then used high-dimensional spatial normalization with DARTEL to normalize images to the DARTEL template, and the unified segmentation (“New Segment”) model in SPM827 with priors to output warped, modulated, segmented images. For this study we were interested in gray and white matter volume differences between groups, so we used both linear and nonlinear normalizations. These final images were smoothed with a 10mm isotropic Gaussian kernel to accommodate inexact spatial normalization (8mm for white matter volume). Gray matter volume (GMV), white matter volume (WMV), and cerebrospinal fluid volumes (CSF) from the segmentations were used to calculate total-intracranial volume (TICV).
A General Linear Model (GLM) full factorial analysis with post hoc t tests was used to examine regional volume differences across PWS and HWC groups, including age, sex, and BMI as confounding variables, and gray matter volume as a global variable (WMV for white matter analyses). We first analyzed the PWS vs. HWC groups as a whole, then compared DEL vs. HWC, UPD vs. HWC, and UPD vs. DEL. Voxels are reported with reference to the Montreal Neurological Institute (MNI) standard space within SPM828. To avoid possible edge effects around the border between GM and WM and to include only relatively homogeneous voxels, we used an absolute threshold masking of .15 for each analyses. For all analyses, results were considered significant at p < .05 after correction for multiple comparisons (family wise error (FWE)) and had a minimum cluster size of 100 voxels (k > 100). In order to compare our data to previous publications, we also report GMV data at p < .001 uncorrected for multiple comparisons.
Statistical Analyses
SPSS 17.0 was used for all statistical analysis outside of imaging space. Continuous demographic, cognitive, and imaging variables were compared between the DEL, UPD, and HWC groups using ANOVA. Chi-square was used to compare categorical variables between groups. For all analyses, results were considered significant at p < .05.
Results
Subject Characteristics
The demographic data, including the BMI and differences in global tissue volumes are presented in Table 1. The global volumes of GMV, WMV, and TICV were significantly smaller in the DEL group than those in the control group (p < .001), but there were no group differences in CSF volume. UPD individuals had significantly less WMV than the HWC individuals (p < .001). Gray matter volume was significantly different between the PWS subgroups (p < .025) such that DEL groups had less GMV than UPD, however there were no global differences between DEL and UPD in WMV, CSF, or TICV.
TFEQ Scores
Group comparisons on TFEQ scores showed that mean scores for individuals in the HWC group were significantly lower than both PWS groups (HWC: 2.32 ± .25; DEL: 3.06 ± .37; UPD: 2.97 ± .49; p < .001 for both). The deletion and UPD groups did not differ in their mean TFEQ score.
VBM Data- Comparison of Gray and White Matter Volume Between Groups
PWS vs. HWC
Individuals in the combined PWS group showed regions of significantly smaller gray and white matter volume than the HWC group. At a corrected level of significance, the primary regions were the bilateral anterior cingulate gyrus, bilateral superior temporal cortex, and bilateral limbic cortex (hippocampus and parahippocampal gyrus) (Figure 1). Gray matter regions that were lower in PWS compared to HWC at an uncorrected level of significance spanned the frontal cortex (inferior and middle frontal gyri), precentral gyrus, and cerebellum (Table 2). White matter regions of less volume were the left inferior frontal, precentral, bilateral medial temporal, brainstem and cerebellum (Figure 1, Table 4). There were no regions where HWC individuals had significantly less regional GMV or WMV than PWS individuals.
Figure 1. Cortical regions show smaller gray and white matter volume in the PWS group compared to healthy-weight controls.
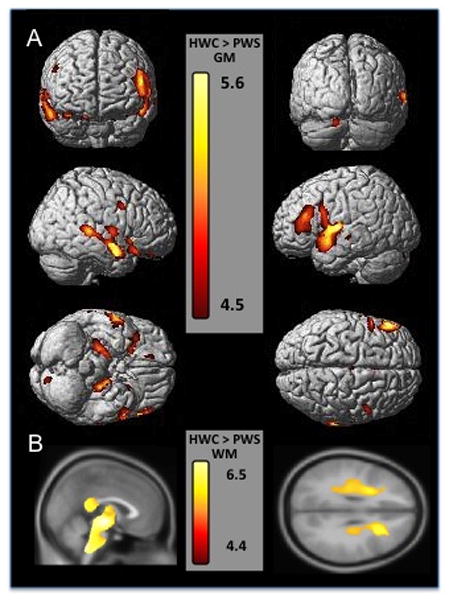
Gray matter regions are displayed on a 3-D surface-rendered standard brain and white matter regions are displayed on a 2-D standard brain. A. The top row of section A shows a frontal view on the left and posterior view on the right of the cortex, demonstrating bilateral frontal gray matter decreases. The middle row of section A shows left and right outer views of the cortex showing the temporal and frontal decreases in gray matter volume. The bottom row of section A shows a ventral view on the left and a dorsal view on the right, demonstrating orbitofrontal and medial temporal (limbic) decreases in gray matter volume. B. Section B shows sagittal and axial views of white matter volume decreases in PWS subjects, highlighting the midbrain, brainstem, thalamic and corpus callosum white matter decreases (all part of a large cluster) on the left, and on the right showing decreases in the inferior frontal and precentral cortices. Results are displayed at p<.05 FWE corrected, Z score range shown on the color bar.
Table 2.
GMV differences between Prader-Willi Group (combined) and Healthy Controls
| Talairach Region | Peak Coordinate | k | Z Score | p Value | |||
|---|---|---|---|---|---|---|---|
| HWC > PWS | x | y | z | FWE | uncor | ||
| R Inferior Frontal Gyrus (BA 45) | 56 | 39 | 8 | 3064 | 3.58 | 0.692 | 0.000 |
| R Middle Frontal Gyrus | 44 | 27 | 31 | 1080 | 3.92 | 0.330 | 0.000 |
| L Middle Frontal Gyrus (BA 8) | −26 | 22 | 51 | 895 | 3.9 | 0.348 | 0.000 |
| * L/R Anterior Cingulate Gyrus | 2 | 14 | 26 | 9319 | 4.84 | 0.012 | 0.000 |
| *L Superior Temporal Gyrus/ L Parahippocampal Gyrus/ L Hippocampus | −48 | 13 | −7 | 99130 | 5.53 | 0.001 | 0.000 |
| R Precentral Gyrus (BA 4) | 32 | −22 | 48 | 207 | 3.5 | 0.775 | 0.000 |
| *R Superior Temporal Gyrus (BA 22)/ R Parahippocampal Gyrus/ R Hippocampus | 66 | −35 | 6 | 75006 | 5.58 | 0.000 | 0.000 |
| L Cerebellum | −42 | −67 | −48 | 1480 | 3.63 | 0.636 | 0.000 |
Listed Rostral to Caudal for each analysis; R= right, L= left, BA= Brodmann’s Area, uncor = uncorrected, k=cluster size, FWE= family wise error
Significant at p < .05 FWE corrected in bold, clusters include all regions separated by a (/).
Table 4.
WM regional volume differences between Prader Willi Groups and Healthy Controls
| Talairach Region | Peak Coordinate | k | Z Score | p Value | |||
|---|---|---|---|---|---|---|---|
| HWC > PWS | mm | mm | mm | FWE | uncorr | ||
| * L Inferior Frontal White Matter | −48 | 30 | 11 | 63 | 4.75 | 0.010 | 0.000 |
| * L Precentral White Matter | −46 | 5 | 20 | 10 | 4.39 | 0.042 | 0.000 |
| * L Medial Temporal White Matter | −40 | −7 | −26 | 758 | 4.70 | 0.012 | 0.000 |
| * R Medial Temporal White Matter | 41 | −7 | −26 | 84 | 4.47 | 0.031 | 0.000 |
| * Brainstem (Medulla)/Cerebellum | −11 | −37 | −48 | 152963 | 6.57 | 0.000 | 0.000 |
|
| |||||||
| HWC > DEL | |||||||
|
| |||||||
| * R Inferior Frontal White Matter | 32 | 36 | 15 | 31 | 4.51 | 0.026 | 0.000 |
| * LInferior Frontal White Matter | −48 | 30 | 11 | 26 | 4.63 | 0.016 | 0.000 |
| * R Middle Temporal White Matter | 47 | −1 | −31 | 283 | 4.58 | 0.020 | 0.000 |
| * Cerebellum/Brainstem/Thalamus | 11 | −43 | −46 | 146327 | 6.46 | 0.000 | 0.000 |
|
| |||||||
| HWC > UPD | |||||||
|
| |||||||
| * R Anterior Cingulum | 9 | 39 | 5 | 56 | 4.49 | 0.028 | 0.000 |
| * R Middle Frontal White Matter/R Cingulum | 31 | 36 | 14 | 6336 | 5.42 | 0.000 | 0.000 |
| * L Inferior Frontal White Matter | −27 | 29 | 14 | 1751 | 4.76 | 0.010 | 0.000 |
| * L Inferior Frontal White Matter | −23 | 11 | 36 | 68 | 4.42 | 0.037 | 0.000 |
| * L Middle Temporal White Matter | −40 | −8 | −19 | 986 | 4.81 | 0.008 | 0.000 |
| * Thalamus/Brainstem/Cerebellum | −9 | −10 | 15 | 71864 | 5.99 | 0.000 | 0.000 |
|
| |||||||
| UPD > DEL | |||||||
|
| |||||||
| * L Inferior Parietal White Matter | −38 | −20 | 23 | 553 | 4.71 | 0.012 | 0.000 |
| * L Inferior Parietal White Matter | −34 | −32 | 37 | 152 | 4.54 | 0.024 | 0.000 |
| DEL> UPD | |||||||
| * L Medial Orbital Frontal White Matter | −5 | 27 | −10 | 75 | 4.57 | 0.021 | 0.000 |
Listed Rostral to Caudal for each analysis; R= right, L= left, uncorr = uncorrected, k=cluster size, FWE= family wise error
Significant at p < .05 FWE corrected, clusters include all regions separated by a (/).
DEL vs. HWC
Individuals in the DEL subgroup had significantly less gray matter volume than the HWC group in the left inferior/middle frontal gyrus (Brodmann’s Area (BA) 8, BA 46), bilateral anterior cingulate (BA 24), left precentral gyrus (BA 6), right superior temporal gyrus (BA 22), and middle temporal gyrus (Table 3, Figure 2). Regions at an uncorrected level of significance included the bilateral inferior and superior frontal gyri, orbitofrontal gyrus (BA 11), left putamen, left inferior temporal gyrus, and the left inferior parietal cortex. Individuals in the DEL subgroups had significantly less white matter volume than the HWC group in the bilateral inferior frontal cortex, right middle temporal cortex, thalamus (inferior and/or superior colliculus), brainstem, and cerebellum (Table 4, Figure 2). There were no regions where HWC individuals had significantly less regional GMV or WMV than DEL individuals.
Table 3.
GM regional volume differences between DEL, UPD, and Healthy Weight Controls
| Talairach Region | Peak Coordinate | k | Z Score | p Value | |||
|---|---|---|---|---|---|---|---|
| HWC > Del | x | y | z | FWE | uncor | ||
| L Middle Frontal Gyrus | −29 | 49 | 29 | 138 | 3.390 | 0.868 | 0.000 |
| R Inferior Frontal Gyrus | 42 | 48 | 2 | 4592 | 3.870 | 0.379 | 0.000 |
| R Superior Frontal Gyrus | 33 | 44 | 35 | 544 | 3.750 | 0.498 | 0.000 |
| L Orbitofrontal Gyrus (BA 11) | −13 | 43 | −22 | 401 | 3.460 | 0.811 | 0.000 |
| * L Middle Frontal Gyrus (BA 8) | −26 | 22 | 51 | 2101 | 4.520 | 0.045 | 0.000 |
| * Anterior Cingulate Gyrus (BA 24) | 4 | 14 | 26 | 4981 | 5.120 | 0.003 | 0.000 |
| L Putamen | −20 | 12 | 10 | 975 | 4.060 | 0.225 | 0.000 |
| *L Precentral Gyrus (BA 6)/ L Middle Frontal Gyrus (BA 46) | −49 | −7 | 8 | 119362 | 5.500 | 0.001 | 0.000 |
| L Superior Frontal Gyrus | −22 | −10 | 56 | 342 | 3.450 | 0.822 | 0.000 |
| R Precentral Gyrus | 30 | −27 | 51 | 158 | 3.420 | 0.843 | 0.000 |
| L Medial Frontal Gyrus (BA 6) | −5 | −28 | 55 | 1024 | 3.890 | 0.365 | 0.000 |
| *R Superior Temporal Gyrus (BA 22)/ Middle Temporal Gyrus | 66 | −35 | 7 | 85553 | 5.910 | 0.000 | 0.000 |
| R Inferior Temporal Gyrus | 63 | −35 | −27 | 177 | 3.380 | 0.877 | 0.000 |
| L Inferior Parietal | −27 | −57 | 40 | 517 | 3.610 | 0.662 | 0.000 |
|
| |||||||
| HWC > UPD | |||||||
|
| |||||||
| * R Rectal Gyrus/ Superior Orbitofrontal Gyrus (BA 11) | 2 | 41 | −26 | 5680 | 4.47 | 0.055 | 0.000 |
| R Inferior Orbital Gyrus | 19 | 18 | −26 | 180 | 3.56 | 0.711 | 0.000 |
| R Caudate | 22 | 17 | 9 | 105 | 3.24 | 0.952 | 0.001 |
| L Caudate | −20 | 15 | 10 | 611 | 3.7 | 0.554 | 0.000 |
| * L Inferior Frontal Gyrus (BA 47)/ Middle Frontal Gyrus (BA 46) | −48 | 14 | −7 | 6926 | 4.65 | 0.027 | 0.000 |
| L Inferior Frontal Gyrus | −54 | 11 | 25 | 627 | 3.6 | 0.675 | 0.000 |
| L Anterior Cingulate (BA 33) | −6 | 10 | 27 | 238 | 3.53 | 0.746 | 0.000 |
| L Hypothalamus | −3 | −2 | −11 | 557 | 3.4 | 0.863 | 0.000 |
| L Middle Cingulate Gyrus (BA 24) | −2 | −16 | 40 | 5476 | 4.14 | 0.172 | 0.000 |
| * L Parahippocampal Gyrus/ Hippocampus | −22 | −18 | −22 | 12551 | 5.35 | 0.001 | 0.000 |
| * R Hippocampus | 25 | −22 | −18 | 5514 | 5.04 | 0.005 | 0.000 |
| R Middle Temporal Gyrus (BA 22) | 70 | −34 | 2 | 216 | 3.36 | 0.888 | 0.000 |
|
| |||||||
| UPD > Del | |||||||
|
| |||||||
| R Superior Frontal Gyrus | 17 | 49 | 37 | 1194 | 4.030 | 0.244 | 0.000 |
| L Superior Frontal Gyrus (BA 10) | −27 | 48 | 30 | 112 | 3.290 | 0.926 | 0.000 |
| L Middle Frontal Gyrus | −48 | 44 | 12 | 233 | 3.280 | 0.935 | 0.001 |
| L Middle Frontal Gyrus | −33 | 32 | 22 | 658 | 4.410 | 0.067 | 0.000 |
| L Middle Frontal Gyrus (BA 8) | −27 | 23 | 50 | 928 | 3.840 | 0.414 | 0.000 |
| R Inferior Frontal Gyrus | 25 | 19 | −15 | 687 | 3.720 | 0.533 | 0.000 |
| Anterior Cingulate Gyrus | 8 | 16 | 24 | 322 | 3.770 | 0.485 | 0.000 |
| L Superior Frontal Gyrus (BA 10) | −3 | 14 | 67 | 111 | 3.290 | 0.927 | 0.000 |
| R Middle Temporal Gyrus | 36 | 8 | −43 | 586 | 3.240 | 0.949 | 0.001 |
| R Superior Frontal Gyrus | 20 | 2 | 58 | 507 | 3.710 | 0.552 | 0.000 |
| R Middle Temporal Gyrus | 54 | 0 | −19 | 2156 | 3.690 | 0.569 | 0.000 |
| L Middle Temporal Gyrus | −51 | −6 | −16 | 677 | 3.480 | 0.795 | 0.000 |
| *R Superior Temporal Gyrus (BA 41/22) | 55 | −20 | 7 | 14938 | 4.830 | 0.013 | 0.000 |
| L Middle Temporal Gyrus | −49 | −28 | −16 | 218 | 4.300 | 0.100 | 0.000 |
| L Superior Temporal Gyrus | −68 | −40 | 20 | 10107 | 3.970 | 0.292 | 0.000 |
| L Middle Temporal Gyrus | −54 | −43 | −7 | 297 | 3.610 | 0.660 | 0.000 |
| R Superior Temporal Gyrus | 51 | −53 | 17 | 2238 | 4.220 | 0.134 | 0.000 |
| * L Inferior Parietal | −35 | −57 | 45 | 2783 | 5.180 | 0.003 | 0.000 |
| R Middle Temporal Gyrus | 38 | −75 | 20 | 238 | 3.500 | 0.770 | 0.000 |
| L Middle Temporal Gyrus | −32 | −77 | 16 | 1911 | 4.400 | 0.070 | 0.000 |
| Cerebellum | −16 | −87 | −27 | 8662 | 4.300 | 0.100 | 0.000 |
| Cuneus (BA 19) | −16 | −96 | 20 | 402 | 3.400 | 0.859 | 0.000 |
|
| |||||||
| Del > UPD | |||||||
|
| |||||||
| No Clusters in Statistical Threshold | |||||||
Listed Rostral to Caudal for each analysis; R= right, L= left, BA= Brodmann’s Area, uncor = uncorrected, k=cluster size, FWE= family wise error
Significant at p < .05 FWE corrected, regions in bold with no * are a trend at p<.08 FWE corrected. Clusters include all regions separated by a (/).
Figure 2. Cortical regions from genetic subtype comparison of HWC to the deletion group (A, C) and the UPD group (B, D).
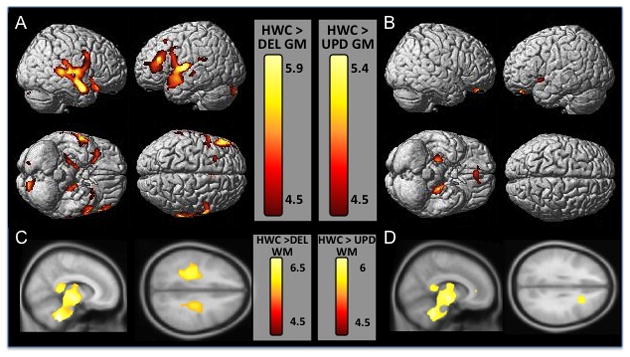
Gray matter regions are displayed on a 3-D surface-rendered standard brain (A, B) and white matter regions are displayed on a 2-D standard brain (C,D). A. The top row of section A shows left and right lateral views of gray matter volume decreases in DEL subjects compared to HWC, highlighting the temporal and frontal decreases in this group. The bottom row of section A shows ventral and dorsal views, displaying decreases in hippocampal and prefrontal gray matter. C. Row C shows sagittal and axial views of white matter volume decreases in HWC subjects. B. The top row of section B shows left and right lateral views of gray matter volume decreases in UPD subjects compared to HWC. The bottom row of section B shows ventral and dorsal views, displaying decreases in hippocampal and orbitofrontal cortical gray matter. D. Row D shows sagittal and axial views of white matter volume decreases in UPD subjects. Results are displayed at p<.05 FWE corrected, Z score range shown on the color bar.
UPD vs. HWC
Individuals in the UPD subgroup had significantly less GMV than the HWC group in the orbitofrontal (BA 11), left inferior and middle frontal (BA 46, 47) and bilateral limbic regions (parahippocampal and hippocampal cortices) (Table 3, Figure 2). Regions at an uncorrected level of significance included the bilateral caudate, left anterior and middle cingulate (BA 33), left hypothalamus, right middle temporal gyrus. Individuals in the UPD subgroups had significantly less WMV than the HWC group in the cingulum, right middle frontal, left inferior frontal, middle temporal, thalamus, brainstem, and cerebellum (Table 4, Figure 2). There were no regions where HWC had less regional GMV or WMV than the UPD individuals.
DEL vs. UPD
Individuals in the DEL subgroup had significantly less GMV in the left middle frontal and right superior temporal gyri (BA 41, 42), left middle temporal gyrus, and left inferior parietal cortex (Table 3, Figure 3) compared to the UPD group. At an uncorrected level, regions of lower gray matter volumes spanned the prefrontal (superior, inferior, and middle frontal gyri) and temporal cortices (middle and superior temporal gyri) as well as the anterior cingulate, cerebellum, and precuneus. Individuals in the DEL subgroup had significantly less WMV in the left inferior parietal cortex compared to the UPD group (Table 4). There were no regions where individuals with the UPD subtype had less GMV than the DEL subtype; however they had significantly less WMV in the orbitofrontal cortex when compared to UPD (Table 4).
Figure 3. Cortical regions of gray matter volume decreases in the deletion group compared to the UPD group.
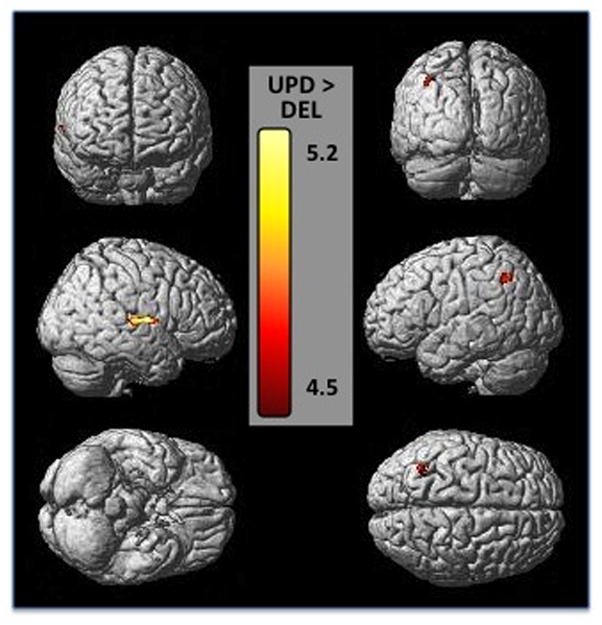
Gray matter regions are displayed on a 3-D surface-rendered standard brain. The top row shows a frontal view on the left and posterior view on the right of the cortex, demonstrating posterior parietal gray matter decreases. The middle row shows left and right outer views of the cortex showing right temporal and left parietal decreases in gray matter volume. The bottom shows a ventral view on the left and a dorsal view on the right. Results are displayed at p<.05 FWE corrected, Z score range shown on the color bar.
Finally, we did several secondary analyses to address issues of uneven variables within groups. For instance, 4 individuals in the DEL group and 2 individuals in the UPD group were on growth hormone. We did additional analyses of the HWC vs. DEL, HWC vs. UPD, and UPD vs. DEL contrasts with a variable controlling for presence of growth hormone. We found that there were no changes in the results between HWC vs. UPD, and UPD vs. DEL. We found that the decrease in GMV in the precentral gyrus in the DEL group compared to the HWC group had increased in significance, and that the DEL group had additional regions of less GMV in the bilateral parahippocampal gyrus and the left middle temporal gyrus (p<.05 FWE corrected), with all other regions remaining the same (Data upon request). To control for IQ differences between DEL and UPD groups in our primary analysis of GMV, we did an additional analysis including IQ as a covariate along with age, sex, and BMI. As before, there were no regions where the DEL group had significantly more regional GMV than the UPD group. The DEL subgroup had lower GMV compared to the UPD group in the same regions as in the previous analysis without IQ, the left middle frontal and right superior temporal gyri (BA 41, 42), left middle temporal gyrus, and left inferior parietal cortex at p<.001 uncorrected. However, these regions did not reach corrected significance at p<.05 FWE corrected.
Discussion
We report a neuroanatomical profile of individuals with PWS that presents a unique pattern of regional brain volumes in each genetic subtype of this complex syndrome. These preliminary findings are the first structural neuroimaging findings to support potentially separate mechanisms underlying the behavioral differences seen in these genetic subtypes. Compared to HWC, PWS participants as a whole had lower GMV localized to the prefrontal, orbitofrontal, and temporal cortices, as well as the caudate, hippocampus, and parahippocampus, even when controlling for absolute gray matter volume differences between these groups. We also show, for the first time in a group of PWS subjects, less WMV in the brainstem, cerebellum, and white matter surrounding the thalamus, as well as frontal white matter. In addition, consistent with previous fMRI reports, we found that individuals with the DEL subtype of PWS had lower GMV primarily in the prefrontal, medial frontal, and temporal cortices compared to HWC, while individuals in the UPD subtype had lower gray matter volumes primarily orbitofrontal and limbic gray matter compared to HWC. These findings remained significant even when controlling for age, sex, BMI, and total GM volume as covariates in the analysis.
Overall, individuals with PWS in our study had less gray matter volume in the prefrontal cortex, orbitofrontal cortex, limbic, and temporal cortices than HWC. These confirm and extend reports from a recent VBM study which reported less gray matter volume in the orbitofrontal cortex (OFC) in PWS individuals compared to healthy-weight controls 18. The OFC is a key brain structure for incorporating reward information from food-related sensory and visceral networks 29; 30. Studies on food-related behavior in both obese 31 and PWS 32 individuals have characterized dysfunction within the satiety system 32; 33 in the prefrontal cortex, namely the OFC. In addition, our structural findings of gray matter differences overlap with our functional neuroimaging results from a previous study in which we found that the PWS group exhibited greater activation to food pictures in the post-meal condition compared with the pre-meal condition in the orbitofrontal cortex, medial PFC, insula, hippocampus, and parahippocampal gyrus 34. In PWS there is an onset of insatiable appetite relatively early in life, with the resultant risk of severe and life-threatening obesity 35. Thus, less local gray and white matter volume in the prefrontal and limbic regions may underlie hyperfunction of the limbic and prefrontal cortex and may be associated with hyperphagia specific to PWS individuals; however the relationship between structural and functional differences between these PWS groups remains unclear. The PWS group had significantly less GMV in the medial prefrontal cortex (BA 6, 46), a region important in attentional control and executive function. Previous research has reported an association between specific cognitive deficits in task switching (attentional control) and PWS behaviors including repetitive questions and temper tantrums 36–38. It may be that less gray matter volume in the medial prefrontal cortex underlies some of the cognitive deficits and corresponding behavioral deficits dependent on prefrontal networks. Overall, individuals with PWS have less temporal, frontal, and limbic gray matter volume compared to individuals with HWC that, taken in light of other functional imaging studies, may give neuroantomical basis for the behavioral deficits.
This is the first study to use VBM to study genetic subgroups of PWS individuals compared to HWC individuals. Overall, we found more extensive GMV decreases in the DEL group compared to the UPD group. These were primarily in the prefrontal cortex (BA 6, 46), the anterior cingulate cortex (BA 24) and the superior and middle temporal gyri (BA 22). Medial frontal and prefrontal regions have been associated with food processing as well as reward and affect-driven motivation 19; 34. In a previous fMRI study of food motivation, we found that individuals in the DEL group showed a more robust, abnormal response than the UPD group in overlapping regions, namely the prefrontal cortex, anterior cingulated, and superior temporal gyri. Moreover, PET studies have documented hypermetabolism in the prefrontal, orbitofrontal, and temporal regions (primarily in the deletion subgroup)39; 40, as well as reduced [11C] FMZ binding to GABAA receptors in deletion adults in the prefrontal, temporal, and cingulate cortices 41. Although it is not possible to measure the overlap between structures in these PET studies compared to our MRI study, it must be noted that regional hypermetabolism alongside less gray matter volume is unexpected. It may be that, despite less gray matter in these frontal and temporal networks, individuals with PWS, and more often DEL individuals, may have synaptic compensatory mechanisms maintaining neuronal activity in the face of structural alterations. That said, not all studies have reported hypermetabolism in PWS; Kim et al found hypometabolism in the orbitofrontal cortex, and Lucignani et al. report a loss of GABAA receptors in the prefrontal cortex in individuals with PWS41; 40. Overall, reports from multiple neuroimaging modalities point towards an abnormal cortical network of food motivation circuitry in PWS, especially in the DEL subgroup.
In the present study, the UPD genetic subgroup had less GMV and WMV in the OFC, and less GMV in the head of the caudate and medial temporal cortex compared to HWC individuals. Previous fMRI data revealed that individuals with UPD had abnormal an BOLD response in the medial temporal cortex, which, taken in light of our structural finding in the UPD group, may suggesting that regions involved in memory and learning may be both structurally and functionally abnormal in this subgroup. In addition, individuals in the UPD subgroup had less GMV in the head of the caudate than HWC individuals. The caudate nucleus, part of the basal ganglia, is highly innervated by dopamine neurons, and also is involved in learning and memory, particularly feedback processing. It has been theorized that the caudate nucleus may be dysfunctional in persons with obsessive-compulsive disorder (OCD) through inability to regulate information from the OFC.
Individuals with PWS appear to have a compulsive disorder with behaviors seen in other conditions such as autism, specifically repetitive and ritualistic behavior 42. Moreover, a large structural imaging study in typically developing school-aged children found that there was a significant relationship between general cognitive ability (IQ) and the volume of the cerebellum and caudate 43. Thus lower gray matter in the basal ganglia specifically in UPD individuals may explain both their obsessive-compulsive symptoms as well as play a role in the decreased cognitive abilities in this group of young and old individuals.
As a whole, we also found that PWS subjects had significantly less regional WMV in the ventral midbrain, brainstem, cerebellum, medial temporal cortex and surrounding the thalamus, along with regionally less white matter in the inferior frontal cortex. Genetic subgroups were more similar in WMV differences than they were GMV differences (Figure 3) compared to HWC, with the only differences between subgroups being less orbitofrontal white matter volume in the UPD group, and less parietal cortex white matter in the DEL subgroup. Gross white matter abnormalities in PWS have been reported in post-mortem studies in the brainstem 13 and cerebellum 15. Moreover, a recent study used diffusion tensor imaging (DTI), a type of imaging that characterizes the quality of white matter tracts, in 8 PWS individuals and identified regional abnormalities in white matter development in PWS, specifically in frontal and thalamic white matter, along with the posterior limb of the internal capsule and the splenium of the corpus callosum 44. Similar to this DTI study, fronto-thalamic regional white matter volumes were decreased in both DEL and UPD subgroups in our analysis. Fronto-thalamic white matter tracts have close connection to the limbic system through the prefrontal and cingulate cortices, and abnormalities in these regions have been linked to psychiatric dysfunction; thus, abnormalities in these regions might contribute to clinically observed psychiatric manifestations in PWS 45. Moreover, our PWS individuals had decreased WMV in the central and posterior white matter tracts coming up through the midbrain, brainstem, and cerebellum, which may underlie some of the motor dysfunction in PWS, as similar white matter dysfunctions in these regions have been shown to play a role in motor neuron dysfunction in diseases like amyotropic lateral schlerosis 46. Future DTI studies using larger groups of subjects might clarify tract-specific changes among in PWS subgroups.
Neuroanatomical differences between genetic subtypes of PWS may be due to several genetic mechanisms. Individuals with the DEL subtype may have a more severe phenotype due to haploinsufficiency of genes in the PWS region, resulting in a reduced expression of non-imprinted genes in these individuals. As a contrast, individuals with the UPD subtype may have a less severe neuroanatomical phenotype because they inherit two copies of maternally expressed genes, resulting in a gene dosage effect with elevated expression of these genes. Moreover, imprinted genes distal to 15q11-q13 are possibly impacted in individuals with UPD but not in individuals with a deletion. Thus, these mechanisms may lead to variability in both the patterns of neural activation we have seen in these subgroups, as well as differences in the underlying smaller regional GMV between UPD and DEL individuals.
Limitations
Individuals with PWS have smaller congenital brain volume compared to normal volunteers, possibly owing to lack of paternally-expressed genes on chromosome 15q11-q13. To control for brain size differences, we included total GMV and WMV volume as a covariate where appropriate, however this may have underestimated the difference between the three groups derived from this disease. There were also differences in the numbers of males and females between the groups, and considering that sex influences gray matter volume, we can not rule out the contributing factor of sex to lower gray matter volumes in the DEL group. Despite this, our analyses account statistically for overall size differences; thus, we can more clearly interpret results, such that regions where DEL had significantly lower regional GMV compared to UPD and HWC were not just due to proportionally smaller brains. We also controlled for gender in all of our imaging analyses. Moreover, our use of a study-specific template further compensates for the gender differences among the sample, as all images are normalized to a mixed-gender template. Because our data was collected as part of several separate studies, this study lacked more detailed neurocognitive tests for 10 of our PWS subjects. Thus, we did not attempt to correlate various types of tests with our morphological data, nor could we control for IQ in our imaging analysis of HWC. For instance, individuals with the DEL subtype had a lower mean IQ than those with the UPD subtype, and had in general had less local gray matter volume compared to HWC than the UPD subtype, with a trend for lower gray matter volume in the cerebellum, which has been noted to be related to IQ in school-aged children 43. In addition, in our secondary analysis of UPD vs. DEL subgroups we were able to control for IQ and found that the DEL subgroup had frontal and temporal gray matter volume differences similar to the original analyses; however, this did not reach a corrected threshold. Therefore, there may be differences in cognitive functioning that may further explain the differences between genetic subtypes that this study could not clarify. However, fMRI data on IQ-matched individuals (PWS and HWC) does suggest that there are neural mechanisms of hyperphagia in PWS that are not accounted for by cognitive differences between these populations 47.
Conclusions
We report a neuroanatomical profile of individuals with Prader-Willi syndrome that presents a unique gray matter volume pattern in each genetic subtype of this complex genetic syndrome. Compared to healthy-weight controls, Prader-Willi subjects as a whole had widespread gray matter decreases in the prefrontal, temporal and limbic cortices. Moreover, individuals with the DEL subtype of Prader-Willi syndrome had primarily prefrontal, medial frontal, and temporal decreases in gray matter volume, while individuals in the UPD subtype had primarily orbitofrontal and limbic gray matter decreases compared to healthy controls. These preliminary findings are the first structural neuroimaging findings to support potentially separate neural mechanisms mediating the behavioral differences seen in these genetic subtypes. Future studies on this unique group of individuals will aid in clarifying the underlying biological mechanisms of varying genetic dysfunction that contributes to Prader-Willi syndrome, especially those in maternally imprinted or paternally expressed genes in the 15q11-q13 region.
Acknowledgments
This study was supported by grants from the National Institutes of Health (HD041672), the Hall Family Foundation, and the Heartland Genetics and Newborn Screening Collaborative (HRSA U22MC03962-02). The Hoglund Brain Imaging Center is supported by a generous gift from Forrest and Sally Hoglund and by NIH (HD002528). The authors are grateful to Phil Lee, Allan Schmitt, Muriel Williams and Pat Weber for technical assistance and Stacey Ward, Jean Reeves, and Jean Guadagnino for help in project coordination.
References
- 1.Glenn CC, Driscoll DJ, Yang TP, Nicholls RD. Genomic imprinting: potential function and mechanisms revealed by the Prader-Willi and Angelman syndromes. Mol Hum Reprod. 1997;3:321–332. doi: 10.1093/molehr/3.4.321. [DOI] [PubMed] [Google Scholar]
- 2.Bittel DC, Butler MG. Prader-Willi syndrome: clinical genetics, cytogenetics and molecular biology. Expert Rev Mol Med. 2005;7:1–20. doi: 10.1017/S1462399405009531. [DOI] [PMC free article] [PubMed] [Google Scholar]
- 3.Nicholls RD, Knepper JL. Genome organization, function, and imprinting in Prader-Willi and Angelman syndromes. Annu Rev Genomics Hum Genet. 2001;2:153–175. doi: 10.1146/annurev.genom.2.1.153. [DOI] [PubMed] [Google Scholar]
- 4.Ungaro P, Christian SL, Fantes JA, Mutirangura A, Black S, Reynolds J, Malcolm S, Dobyns WB, Ledbetter DH. Molecular characterisation of four cases of intrachromosomal triplication of chromosome 15q11-q14. J Med Genet. 2001;38:26–34. doi: 10.1136/jmg.38.1.26. [DOI] [PMC free article] [PubMed] [Google Scholar]
- 5.Butler MG, Fischer W, Kibiryeva N, Bittel DC. Array comparative genomic hybridization (aCGH) analysis in Prader-Willi syndrome. Am J Med Genet A. 2008;146:854–860. doi: 10.1002/ajmg.a.32249. [DOI] [PMC free article] [PubMed] [Google Scholar]
- 6.Butler MG. Prader-Willi syndrome: current understanding of cause and diagnosis. Am J Med Genet. 1990;35:319–332. doi: 10.1002/ajmg.1320350306. [DOI] [PMC free article] [PubMed] [Google Scholar]
- 7.Butler MG, PDKLBYW . Management of Prader-Willi Syndrome. New York, NY: Springer-Verlag Publishers; 2006. Clinical findings and natural history of Prader-Willi syndrome; pp. 3–48. [Google Scholar]
- 8.Roof E, Stone W, MacLean W, Feurer ID, Thompson T, Butler MG. Intellectual characteristics of Prader-Willi syndrome: comparison of genetic subtypes. J Intellect Disabil Res. 2000;44 (Pt 1):25–30. doi: 10.1046/j.1365-2788.2000.00250.x. [DOI] [PMC free article] [PubMed] [Google Scholar]
- 9.Milner KM, Craig EE, Thompson RJ, Veltman MW, Thomas NS, Roberts S, Bellamy M, Curran SR, Sporikou CM, Bolton PF. Prader-Willi syndrome: intellectual abilities and behavioural features by genetic subtype. J Child Psychol Psychiatry. 2005;46:1089–1096. doi: 10.1111/j.1469-7610.2005.01520.x. [DOI] [PubMed] [Google Scholar]
- 10.Veltman MW, Craig EE, Bolton PF. Autism spectrum disorders in Prader-Willi and Angelman syndromes: a systematic review. Psychiatr Genet. 2005;15:243–254. doi: 10.1097/00041444-200512000-00006. [DOI] [PubMed] [Google Scholar]
- 11.Boer H, Holland A, Whittington J, Butler J, Webb T, Clarke D. Psychotic illness in people with Prader Willi syndrome due to chromosome 15 maternal uniparental disomy. Lancet. 2002;359:135–136. doi: 10.1016/S0140-6736(02)07340-3. [DOI] [PubMed] [Google Scholar]
- 12.Vogels A, De Hert M, Descheemaeker MJ, Govers V, Devriendt K, Legius E, Prinzie P, Fryns JP. Psychotic disorders in Prader-Willi syndrome. Am J Med Genet A. 2004;127A:238–243. doi: 10.1002/ajmg.a.30004. [DOI] [PubMed] [Google Scholar]
- 13.Hashimoto T, Mori K, Yoneda Y, Yamaue T, Miyazaki M, Harada M, Miyoshi H, Kuroda Y. Proton magnetic resonance spectroscopy of the brain in patients with Prader-Willi syndrome. Pediatr Neurol. 1998;18:30–35. doi: 10.1016/s0887-8994(97)00139-2. [DOI] [PubMed] [Google Scholar]
- 14.Leonard CM, Williams CA, Nicholls RD, Agee OF, Voeller KK, Honeyman JC, Staab EV. Angelman and Prader-Willi syndrome: a magnetic resonance imaging study of differences in cerebral structure. Am J Med Genet. 1993;46:26–33. doi: 10.1002/ajmg.1320460107. [DOI] [PubMed] [Google Scholar]
- 15.Titomanlio L, De Brasi D, Romano A, Genesio R, Diano AA, Del Giudice E. Partial cerebellar hypoplasia in a patient with Prader-Willi syndrome. Acta Paediatr. 2006;95:861–863. doi: 10.1080/08035250500527307. [DOI] [PubMed] [Google Scholar]
- 16.Miller JL, Couch JA, Leonard CM, Schwenk K, Towler SD, Shuster J, Goldstone AP, He G, Driscoll DJ, Liu Y. Sylvian fissure morphology in Prader-Willi syndrome and early-onset morbid obesity. Genet Med. 2007;9:536–543. doi: 10.1097/gim.0b013e31812f720d. [DOI] [PubMed] [Google Scholar]
- 17.Miller JL, Couch JA, Schmalfuss I, He G, Liu Y, Driscoll DJ. Intracranial abnormalities detected by three-dimensional magnetic resonance imaging in Prader-Willi syndrome. Am J Med Genet A. 2007;143:476–483. doi: 10.1002/ajmg.a.31508. [DOI] [PubMed] [Google Scholar]
- 18.Ogura K, Fujii T, Abe N, Hosokai Y, Shinohara M, Takahashi S, Mori E. Small gray matter volume in orbitofrontal cortex in Prader-Willi syndrome: A voxel-based MRI study. Hum Brain Mapp. 2010 doi: 10.1002/hbm.21089. Epub ahead of print. [DOI] [PMC free article] [PubMed] [Google Scholar]
- 19.Holsen LM, Zarcone JR, Chambers R, Butler MG, Bittel DC, Brooks WM, Thompson TI, Savage CR. Genetic subtype differences in neural circuitry of food motivation in Prader-Willi syndrome. Int J Obes (Lond) 2009;33:273–283. doi: 10.1038/ijo.2008.255. [DOI] [PMC free article] [PubMed] [Google Scholar]
- 20.Hartley SL, Maclean WE, Jr, Butler MG, Zarcone J, Thompson T. Maladaptive behaviors and risk factors among the genetic subtypes of Prader-Willi syndrome. Am J Med Genet A. 2005;136:140–145. doi: 10.1002/ajmg.a.30771. [DOI] [PMC free article] [PubMed] [Google Scholar]
- 21.Butler MG, Bittel DC, Kibiryeva N, Talebizadeh Z, Thompson T. Behavioral differences among subjects with Prader-Willi syndrome and type I or type II deletion and maternal disomy. Pediatrics. 2004;113:565–573. doi: 10.1542/peds.113.3.565. [DOI] [PMC free article] [PubMed] [Google Scholar]
- 22.Wechsler D. Manual: Wechsler Adult Intelligence Scale. New York: Psychological Corporation; 1955. [Google Scholar]
- 23.Wechsler D, Matarazzo JD. Wechsler’s Measurement and appraisal of adult intelligence. Baltimore: Williams & Wilkins; 1972. [Google Scholar]
- 24.Wechsler D. Wechsler Intelligence Scale for Children. San Antonio, TX: The Psychological Corporation; 1991. [Google Scholar]
- 25.Stunkard AJ, Messick S. The three-factor eating questionnaire to measure dietary restraint, disinhibition and hunger. J Psychosom Res. 1985;29:71–83. doi: 10.1016/0022-3999(85)90010-8. [DOI] [PubMed] [Google Scholar]
- 26.Ashburner J. A fast diffeomorphic image registration algorithm. Neuroimage. 2007;38:95–113. doi: 10.1016/j.neuroimage.2007.07.007. [DOI] [PubMed] [Google Scholar]
- 27.Ashburner J, Friston KJ. Unified segmentation. Neuroimage. 2005;26:839–851. doi: 10.1016/j.neuroimage.2005.02.018. [DOI] [PubMed] [Google Scholar]
- 28.Honea RA, Meyer-Lindenberg A, Hobbs KB, Pezawas L, Mattay VS, Egan MF, Verchinski B, Passingham RE, Weinberger DR, Callicott JH. Is gray matter volume an intermediate phenotype for schizophrenia? A voxel-based morphometry study of patients with schizophrenia and their healthy siblings. Biol Psychiatry. 2008;63:465–474. doi: 10.1016/j.biopsych.2007.05.027. [DOI] [PMC free article] [PubMed] [Google Scholar]
- 29.Rolls ET. The orbitofrontal cortex and reward. Cereb Cortex. 2000;10:284–294. doi: 10.1093/cercor/10.3.284. [DOI] [PubMed] [Google Scholar]
- 30.Rolls ET. Taste, olfactory,and food texture processing in the brain, and the control of food intake. Physiol Behav. 2005;85:45–56. doi: 10.1016/j.physbeh.2005.04.012. [DOI] [PubMed] [Google Scholar]
- 31.Bruce AS, Holsen LM, Chambers RJ, Martin LE, Brooks WM, Zarcone JR, Butler MG, Savage CR. Obese children show hyperactivationto food pictures in brain networks linked to motivation, reward and cognitive control. Int J Obes (Lond) 34:1494–1500. doi: 10.1038/ijo.2010.84. [DOI] [PMC free article] [PubMed] [Google Scholar]
- 32.Hinton EC, Holland AJ, Gellatly MS, Soni S, Patterson M, Ghatei MA, Owen AM. Neural representations of hunger and satiety in Prader-Willi syndrome. Int J Obes (Lond) 2006;30:313–321. doi: 10.1038/sj.ijo.0803128. [DOI] [PubMed] [Google Scholar]
- 33.Holland AJ, Treasure J, Coskeran P, Dallow J, Milton N, Hillhouse E. Measurement of excessive appetite and metabolic changes in Prader-Willi syndrome. Int J Obes Relat Metab Disord. 1993;17:527–532. [PubMed] [Google Scholar]
- 34.Holsen LM, Zarcone JR, Brooks WM, Butler MG, Thompson TI, Ahluwalia JS, Nollen NL, Savage CR. Neural mechanisms underlying hyperphagia in Prader-Willi syndrome. Obesity (Silver Spring) 2006;14:1028–1037. doi: 10.1038/oby.2006.118. [DOI] [PMC free article] [PubMed] [Google Scholar]
- 35.Whittington J, Holland A. Neurobehavioral phenotype in Prader-Willi syndrome. Am J Med Genet C Semin Med Genet. 154C:438–447. doi: 10.1002/ajmg.c.30283. [DOI] [PubMed] [Google Scholar]
- 36.Woodcock KA, Oliver C, Humphreys GW. A specific pathway can be identified between genetic characteristics and behaviour profiles in Prader-Willi syndrome via cognitive, environmental and physiological mechanisms. J Intellect Disabil Res. 2009;53:493–500. doi: 10.1111/j.1365-2788.2009.01167.x. [DOI] [PubMed] [Google Scholar]
- 37.Woodcock KA, Oliver C, Humphreys GW. Task-switching deficits and repetitive behaviour in genetic neurodevelopmental disorders: data from children with Prader-Willi syndrome chromosome 15 q11-q13 deletion and boys with Fragile X syndrome. Cogn Neuropsychol. 2009;26:172–194. doi: 10.1080/02643290802685921. [DOI] [PubMed] [Google Scholar]
- 38.Woodcock KA, Humphreys GW, Oliver C. Dorsal and ventral stream mediated visual processing in genetic subtypes of Prader-Willi syndrome. Neuropsychologia. 2009;47:2367–2373. doi: 10.1016/j.neuropsychologia.2008.09.019. [DOI] [PubMed] [Google Scholar]
- 39.Mantoulan C, Payoux P, Diene G, Glattard M, Roge B, Molinas C, Sevely A, Zilbovicius M, Celsis P, Tauber M. PET scan perfusion imaging in the Prader-Willi syndrome: new insights into the psychiatric and social disturbances. J Cereb Blood Flow Metab. doi: 10.1038/jcbfm.2010.87. [DOI] [PMC free article] [PubMed] [Google Scholar]
- 40.Kim SE, Jin DK, Cho SS, Kim JH, Hong SD, Paik KH, Oh YJ, Kim AH, Kwon EK, Choe YH. Regional cerebral glucose metabolic abnormality in Prader-Willi syndrome: A 18F-FDG PET study under sedation. J Nucl Med. 2006;47:1088–1092. [PubMed] [Google Scholar]
- 41.Lucignani G, Panzacchi A, Bosio L, Moresco RM, Ravasi L, Coppa I, Chiumello G, Frey K, Koeppe R, Fazio F. GABA A receptor abnormalities in Prader-Willi syndrome assessed with positron emission tomography and [11C]flumazenil. Neuroimage. 2004;22:22–28. doi: 10.1016/j.neuroimage.2003.10.050. [DOI] [PubMed] [Google Scholar]
- 42.Greaves N, Prince E, Evans DW, Charman T. Repetitive and ritualistic behaviour in children with Prader-Willi syndrome and children with autism. J Intellect Disabil Res. 2006;50:92–100. doi: 10.1111/j.1365-2788.2005.00726.x. [DOI] [PubMed] [Google Scholar]
- 43.Pangelinan MM, Zhang G, Vanmeter JW, Clark JE, Hatfield BD, Haufler AJ. Beyond age and gender: Relationships between cortical and subcortical brain volume and cognitive-motor abilities in school-age children. Neuroimage. 2010 doi: 10.1016/j.neuroimage.2010.11.021. Epub ahead of print. [DOI] [PMC free article] [PubMed] [Google Scholar]
- 44.Yamada K, Matsuzawa H, Uchiyama M, Kwee IL, Nakada T. Brain developmental abnormalities in Prader-Willi syndrome detected by diffusion tensor imaging. Pediatrics. 2006;118:e442–448. doi: 10.1542/peds.2006-0637. [DOI] [PubMed] [Google Scholar]
- 45.Steinhausen HC, Eiholzer U, Hauffa BP, Malin Z. Behavioural and emotional disturbances in people with Prader-Willi Syndrome. J Intellect Disabil Res. 2004;48:47–52. doi: 10.1111/j.1365-2788.2004.00582.x. [DOI] [PubMed] [Google Scholar]
- 46.Graham JM, Papadakis N, Evans J, Widjaja E, Romanowski CA, Paley MN, Wallis LI, Wilkinson ID, Shaw PJ, Griffiths PD. Diffusion tensor imaging for the assessment of upper motor neuron integrity in ALS. Neurology. 2004;63:2111–2119. doi: 10.1212/01.wnl.0000145766.03057.e7. [DOI] [PubMed] [Google Scholar]
- 47.Dimitropoulos A, Schultz RT. Food-related neural circuitry in Prader-Willi syndrome: response to high-versus low-calorie foods. J Autism Dev Disord. 2008;38:1642–1653. doi: 10.1007/s10803-008-0546-x. [DOI] [PubMed] [Google Scholar]