Abstract
Laser-assisted killing of gold nanoparticle targeted macrophages was investigated. Using pressure transient detection, flash photography and transmission electron microscopy (TEM) imaging, we studied the mechanism of single cell damage by vapor bubble formation around gold nanospheres induced by nanosecond laser pulses. The influence of the number of irradiating laser pulses and of particle size and concentration on the threshold for acute cell damage was determined. While the single pulse damage threshold is independent of the particle size, the threshold decreases with increasing particle size when using trains of pulses. The dependence of the cell damage threshold on the nanoparticle concentration during incubation reveals that particle accumulation and distribution inside the cell plays a key role in tissue imaging or cell damaging.
OCIS codes: (170.0170) Medical optics and biotechnology, (170.5180) Photodynamic therapy, (170.5120) Photoacoustic imaging
1. Background
Gold nanoparticles have extraordinary optical properties and excellent biocompatibility resulting in substantial interest in their application to bioanalysis [1–3], diagnosis [4,5], and medical therapy [6–13]. The optical properties of gold nanoparticles, determined by the surface plasmon resonance which results in strong optical absorption in a narrow wavelength range, can be selected via the particle size and shape [14]. For bioanalysis, proposed biomolecular assays suggest detection of slight shifts of the nanoparticles’ resonance wavelength due to changes of the refractive index in their immediate surroundings [1] or their use in surface-enhanced Raman scattering (SERS) to improve assay sensitivity [2]. The strong absorption of the particles at the resonance wavelength appears to improve contrast in optoacoustic imaging [15,16], an emerging technique depending on ultrasound transients generated by the heating of tissue using nanosecond laser pulses. Functionalizing nanoparticles with antibodies or proteins to target specific tumor cell types, increases signal amplitude from these areas and, thus, creates possible new methods for early cancer detection [4]. Continuous-wave (CW) laser heating of tissue via gold nanorods increases the reflection of a scanning THz beam used for two-dimensional imaging in a microscopic setup enabling detection of cells containing the particles [5].
Besides using nanoparticles for diagnostic purposes, they are increasingly used in the development of novel medical therapies. For example, a CW laser can selectively heat nanoparticle-targeted cells and induce hyperthermia [6,7,9]. On the other hand, pulsed lasers, which deliver the energy on too short a time scale to heat an entire cell, generate nano- or microscale transient vapor bubbles around internalized nanoparticles when operated at sufficiently high radiant exposures. These vapor bubbles may cause cell death upon collapse [10–12]. Smaller bubbles can be used to control the release of liposome contents [8,13].
Although an increasing number of medical applications make use of laser-induced vapor bubble formation for damaging cell or liposome membranes, the exact mechanism of when and how damage occurs remains controversial. For example, current literature includes a wide variation of radiant exposure thresholds for cell damage ranging from 0.1 to 1 J/cm2 [10,17–20] without a detailed explanation in terms of the damage mechanism. Furthermore, the question of if and under what conditions a single bubble is sufficient for effective cell killing [19,20] remains open. On the other hand, it seems clear that the effectiveness of vapor bubble cell damage depends on the nanoparticle localization, which, in turn, depends on the incubation time as well as other factors including the particle functionalization or coating, cell type, degree of nanoparticle clustering and mechanisms of nanoparticle uptake in the cell [21–25]. Understanding these aspects is, however, crucial to development of routine clinical applications.
In both our previous [26] and our current work we address this gap and develop a more complete understanding of the effects that laser induced vapor bubbles around gold nanoparticles have on cells. The earlier article focused on vapor bubble formation around single spherical gold nanoparticles and described our preliminary study of the behavior of nanoparticles in cells. This earlier study demonstrated that an accumulation of nanoparticles leads to lower bubble formation thresholds. The current work presents a more detailed study of the cell damage caused by laser induced vapor bubbles around internalized nanoparticles without specific targeting in macrophages. The choice to use non-targeted particles in combination with macrophages is based on two considerations. In contrast to targeted particles, which tend to stay at the surface of the cell, untargeted particles are integrated rather deeply into lysosomes inside the cell. Moreover, macrophages may, in future clinical applications, be used as conduit cells to deliver the untargeted particles to specific places in the body. A combination of microscope images taken during the bubble formation process, pressure signals and transmission electron microscopy (TEM) yielded a vast amount of information leading to greater insight into the actual damage mechanism both under a single laser pulse and multiple pulse irradiation. We determined the influence of the particle size and concentration in the incubation suspension on the damage threshold and suggest a two-step damage mechanism occurs during the irradiation with multiple pulses.
2. Methods
2.1. Microscope set-up
An upright, bright-field microscope was used to irradiate target cells with pulsed laser light, to measure laser-induced pressure transients and to image the cells during vapor bubble generation. As shown schematically in Fig. 1 , pulsed laser light was coupled through an optical fiber (core diameter 430 µm) whose distal tip was imaged onto the sample using a lens and a microscope objective resulting in an approximate top-hat irradiance profile. A beamsplitter picked off a portion of the laser beam to allow measurement of the pulse energy. The laser light source for these experiments was an optical parametric oscillator (OPO), emitting laser light with a pulse duration of 5 ns and a wavelength of 532 nm, close to the surface plasmon resonance of the gold nanoparticles. The radiant exposure was adjusted by inserting neutral density filters in the beam prior to coupling the beam into the optical fiber.
Fig. 1.
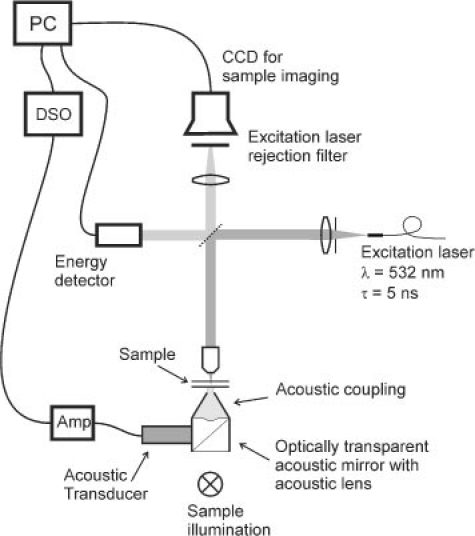
Microscope setup for cell irradiation with simultaneous imaging and pressure transient measurement.
We used a range of spot sizes (40 to 370 μm diameter) to allow irradiation of either single cells or groups of cells. Single cell irradiation allowed us to study the laser-induced pressure transients generated by vapor bubble formation and collapse. Irradiating groups of cells provided better statistics in the determination of cell damage thresholds within the same measurement time and resulted in more uniform irradiation of the individual cells. The different spot sizes were produced by changing the magnification of the microscope objective and confirmed by measuring the irradiance profile using a scanned knife-edge technique. In all measurements, the fluence of each pulse was monitored and the fluence per cell was calculated.
Our microscope setup also provided the means to image the cells either in white light or using flash photography during vapor bubble formation. The sample was illuminated from below using a broadband light source for white light imaging. For flash imaging, a 700 ps dye laser illuminated the sample from the same direction. The timing of the flash was selectable via an electronic delay relative to the firing of the OPO pulse. All images were recorded with a CCD camera.
Pressure transients in the sample were detected via an acoustic lens focused on the sample and a 45 degree acoustic mirror below the sample using an ultrasonic transducer. Both the acoustic lens and mirror were optically transparent to enable illumination of the sample. The signal from the 2.25 MHz central-frequency pressure transducer (Olympus-Panametrics, 60% bandwidth) was amplified and digitized for subsequent analysis.
2.2. Measurement procedure
Macrophages were chosen as host cells because of the important role they play in the development of atherosclerosis [27] and the associated interest in using them as a target in new anti-macrophage therapeutic strategies [28–30]. The macrophage cell line Bac-1 was cultured in alpha MEM (Biochrom, Berlin, Germany) supplemented with 15% fetal bovine serum (FBS) (Biochrom) and 8000 U/ml macrophage colony-stimulating factor-1 (CSF-1, kindly provided by Cetus Corporation, CA). Cells were plated in 3 cm diameter Petri dishes and grown for 1-2 days before incubation with colloidal gold nanoparticles of different sizes (40 nm, 60 nm, both obtained from BBInternational, UK, and 90 nm diameter, obtained from Nanopartz Inc., USA). DLS [31] and extinction measurements using a spectrophotometer (Perkin Elmer lambda-9) verified particle size and concentration. The particles were suspended in phosphate-buffered saline (PBS) with 1% bovine serum albumin (BSA) at 37°C and 5% CO2. A constant incubation time of 3.5 hours was used to assure complete penetration of the nanoparticles into the cells (as expected by previous experiments and confirmed by TEM images). Sufficiently long incubation times result in the number of ingested particles being independent of the concentration due to the engulfment saturation of the macrophages [32,33]. However, PBS/1%BSA is not suited for long term incubation due to the lack of growth factor. The nourishing medium, on the other hand, was poorly suited for use with nanoparticles. To study the effect of particle size, we elected to prepare suspensions whose mass of gold per unit volume was constant to within 10%. The resulting particle concentrations were 6.2∙1010 part/ml for 40 nm, 1.8∙1010 part/ml for 60nm and 4.5∙109 part/ml for 90 nm particles. To study the influence of the concentration particles of one single size (90nm) were used in concentrations from 0.6∙109 to 4.5∙109 part/ml. After incubation the particle suspension was gently removed and replaced by PBS.
To determine the threshold radiant exposure for acute cell damage, a few hundred individual cells were irradiated at a range of radiant exposures. Images of the irradiated cells were taken before, immediately after irradiation, and after staining with trypan blue. To ensure the same cells were imaged, the dish was mounted on an automated translation stage to repeatably return to the same imaging positions. Figures 2 (A-C) shows examples of such image series for cells incubated with 90 nm gold nanoparticles at a concentration of 4.5∙109 particles/ml and irradiated with different radiant exposures (45mJ/cm2, 80mJ/cm2 and 330mJ/cm2 respectively). The images taken before the laser irradiation (marked I) clearly show the accumulated internalized nanoparticles or nanoparticle clusters visible as dark spots in the cells. As revealed by comparison with the bubble images (marked II) these particle accumulations act as centers for vapor bubble formation. Within 10 minutes after irradiation, the cell sample was treated with trypan blue for 3 minutes to stain cells that had suffered acute membrane damage. After rinsing the sample with PBS to remove the excess dye, images of all irradiated locations were taken again (III) and visually assessed. Figure 2A, panel III shows a typical example in which the cell was not stained and thus has not suffered acute cell damage. Figure 2B, panel III exhibits staining by trypan blue indicating cell membrane damage. In Fig. 2C, the bubble destroying the cell was much larger than the cell itself. Immediately after the laser pulse, only debris and possibly some nanoparticles remained visible, while the cell was detached from the Petri dish by the large mechanical force.
Fig. 2.
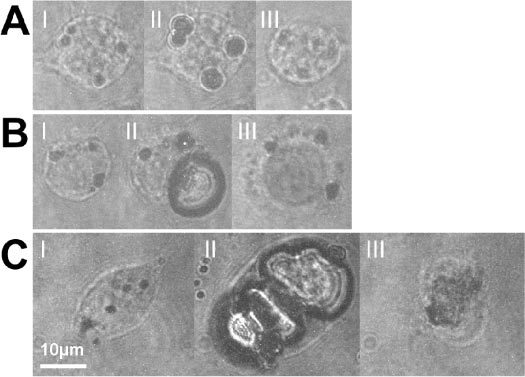
Bac-1 cells incubated with 90 nm gold spheres at 4.5∙109 part/ml and irradiated at 532 nm: (I) before irradiation, (II) with a delay equal to half the bubble lifetime after irradiation with a single laser pulse and after the trypan blue staining procedure. (A) Radiant exposure = 45 mJ/cm2, Δt = 300 ns. Absence of staining after application of trypan blue (III) suggests an intact cell membrane. (B) Radiant exposure = 80 mJ/cm2, Δt = 500 ns. The staining (III) indicates acute membrane damage. (C) Radiant exposure = 330 mJ/cm2, Δt = 190 ns. The cell is destroyed beyond recognition (III). Note that this cell was not stained. The staining procedure washes away the remnants of the cell. Scale bar: 10 μm, applicable to all images.
The data was expressed in terms of the fraction of cells stained by trypan blue as a function of the radiant exposure. Although cells as depicted in Fig. 2C could not be stained, they were counted as stained for this calculation. The resulting damaged cell fraction vs. radiant exposure data were fit to a logistic distribution and the cell damage threshold was taken from the fit as the radiant exposure causing a 50% of the irradiated cells to be stained [26]. As a reference, cells without nanoparticles were irradiated with laser pulses of twice the maximum radiant exposure. No cell damage was found in these cells.
Measurement of the pressure transients related to bubble formation and collapse provided a means to determine the bubble lifetime. Figure 3 represents a typical pressure signal recorded during a measurement such as the one shown in Fig. 2B. The pressure signal exhibits two distinct transients of almost equal shape resulting from a cell with one large bubble, possibly with some significantly smaller bubbles. The fact that both transients have the same polarity and shape shows that they result from nucleation and final collapse of the vapor bubble [34] and not from volumetric changes of the bubble. The measured delay time of τ = 1.28 μs between the two pressure transients is used as the lifetime of the vapor bubble. When several bubbles of varying sizes are formed in a cell, superposition of the individual pressure transients impedes correct lifetime determination. The multiple transients representing bubble formation occur at the same time and therefore add up constructively. However, superposition of the transients resulting from the collapse of these bubbles does not lead to a single distinguishable second transient because of size and lifetime differences. For lifetime determination, such pressure signals from multiple bubble collapse were excluded.
Fig. 3.
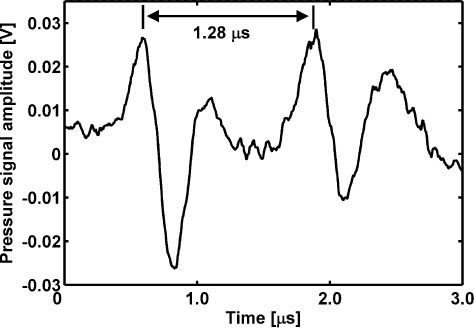
Pressure signal (raw data) recorded during measurements such as the one shown in Fig. 2B, panel II. Pressure signal of one large bubble. The two transients stem from vapor bubble formation and collapse; their relative delay indicating the vapor bubble lifetime is 1.28 μs.
By timing the delay of the flash photography bubble images such that they are acquired at approximately half the bubble lifetime, the maximal bubble size can be measured from the resulting image. Because of the statistical nature of bubble formation in cells this timing of the flash is not exact. To set the flash photography delay, we rely on the average half lifetime obtained from previous pressure measurements. Flash photography and pressure measurement are then simultaneously applied on the next identically irradiated cells. Comparison of the half lifetime measured using the pressure signal from the imaged cell and the chosen delay for the bubble photograph ensures the photograph was indeed taken at approximately the right time.
To study the influence of the number of applied laser pulses on the cell damage threshold, pulse trains of 10, 30, 50, and 90 pulses were used at a repetition rate of 5 Hz. The applied radiant exposure was always chosen to be well below the single pulse damage threshold. From each pulse train length a multiple-pulse cell damage threshold was measured using the same technique of imaging trypan blue stained cells described above. This was repeated for the three different particle sizes.
Finally, the long-term cell death after irradiation and the influence of temperature were investigated. The possibility that cells die a significant time after irradiation was examined by irradiating cells below the damage threshold and incubating the dish for 1 to 3 days before staining. To evaluate the importance of apoptosis both cells that had been irradiated and untreated cells were kept in the incubator and stained after incubation. The difference in staining rate of these cells was then compared to the staining rate of cells that had been stained immediately after irradiation. All detailed results described below were collected at room temperature (22 ± 2°C), but some experiments were repeated at 37 °C to investigate the influence of temperature.
2.3. TEM imaging
To obtain further insight in the position of the particles in the cells, TEM images were taken of groups of irradiated and non-irradiated cells. Cells that had not suffered damage but had shown clear signs of vapor bubble formation were selected using the flash photography images and pressure transient measurements. For TEM imaging the cells were prepared as described in [35]. Briefly, the cells were fixed in 2.5% glutaraldehyde in 0.03 M potassium phosphate buffer for at least 24 h. After washing with potassium phosphate buffer, the cells were post-fixed with 1% osmium tetroxide in sodium cacodylate buffer, washed with maleate buffer, and stained with 0.5% uranyl acetate in maleate buffer. Afterwards, the cells were dehydrated in ascending ethanol series and embedded in epon. The embedded cells were removed from the Petri dish using liquid nitrogen. Ultrathin slices (60 ± 10 nm) were cut parallel to the cell layer, mounted on copper grids and stained with lead citrate and uranyl acetate. Images were acquired with a Morgani TEM (FEI Co Philips Electron Optics, Zürich, Switzerland).
3. Results
3.1. Single pulse irradiation: influence of the concentration
Using the pressure measurements, the bubble lifetime as a function of radiant exposure was determined for different concentrations of 90 nm particles. The results are shown in Fig. 4 for incubation with two concentrations, 0.6∙109 and 4.5∙109 particles/ml, referred to here after as high concentration and low concentration respectively. The graph reveals an almost linear dependence of the bubble lifetime on the radiant exposure within the measured range. The scattering of the data points results from the statistical nature of nanoparticle internalization. By extrapolating the lifetime measurements to very small lifetimes using a linear fit (see dashed lines in Fig. 4), we determined bubble formation thresholds of 20 mJ/cm2 and 40 mJ/cm2 for high and low concentrations respectively. Simultaneously, pressure signals and flash photography images confirmed the existence of bubbles starting from these threshold radiant exposures. However, bubbles whose lifetimes are shorter than 0.5 μs generate the two pressure transients indicating bubble generation and collapse so close together in time that they cannot be resolved due to the bandwidth and noise level limitations of the detection system. These measurements, therefore, don’t appear in Fig. 4.
Fig. 4.
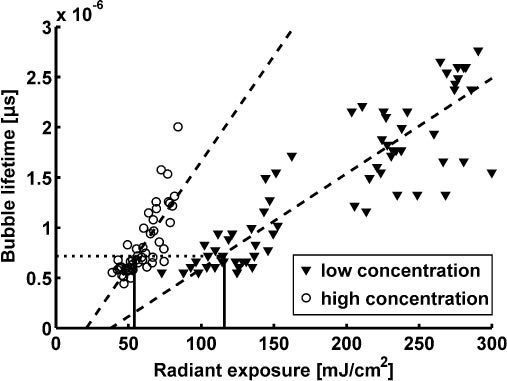
Bubble lifetimes in Bac-1 cells incubated with 90nm gold spheres at 0.6 and 4.5∙109 particles/ml as a function of the radiant exposure (532 nm) for two different particle concentrations during incubation as derived from pressure measurements. Dashed lines show the linear fits to the two data sets. Both measurements yield almost the same vapor bubble lifetime of 0.7 µs (dotted line) at the respective damage thresholds (per Table 1, solid vertical lines).
The damage threshold for each particle concentration was then determined as described above. As illustrated by the results presented in Table 1 , the threshold decreases significantly when increasing the particle concentration from 0.6 to 2.4∙109 part/ml but does not change upon further increase. It is noteworthy that the damage threshold occurs at the same vapor bubble lifetime of 0.7 μs, independent of particle concentration (dotted line in Fig. 4).
Table 1. Single-pulse staining threshold for samples incubated with different concentrations of 90 nm particles.
| Concentration [particles/ml] | 0.6∙109 | 2.4∙109 | 4.5∙109 |
| Acute damage threshold [mJ/cm2] | 116 ± 8 | 53 ± 4 | 54 ± 13 |
3.2. Single pulse irradiation: influence of the particle size
To study the influence of the particle size, the Bac-1 cells were incubated with different sized gold colloids at concentrations yielding about equal amounts of gold per volume in the incubation suspension. The threshold for acute damage after single pulse irradiation of these cells was found to be independent of the particle size (54 ± 13, 55 ± 9 and 54 ± 12 mJ/cm2 for 90, 60 and 40 nm diameter respectively), which may be the result of clustering of the nanoparticles.
3.3. Irradiation with multiple pulses
We determined lower damage thresholds for cells irradiated with multiple pulses. As shown in Fig. 5 , the lowest damage threshold was found for a pulse train of 50 pulses while further increase of the number of pulses had no additional effect. The lowest threshold was found for cells incubated with 90 nm particles at 4.5∙109 part/ml. Note that the damage threshold decreased less for smaller particles.
Fig. 5.
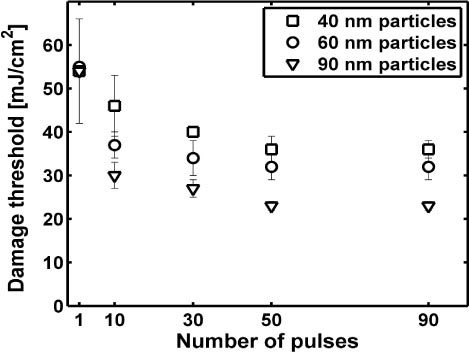
Damage threshold in mJ/cm2 as a function of the applied number of pulses for 40, 60 and 90 nm particles. Only the error bar for 40 nm particles is shown for a single pulse for clarity. The omitted error bars are nearly identical.
The simultaneously performed pressure measurements revealed a successive decrease of the pressure amplitude from pulse to pulse. This decrease in pressure amplitude was found to be strongest over the first few pulses whereas little change could be observed after ten pulses.
TEM images taken before and after irradiation of the cell reveal that the nanoparticles, initially confined to lysosomes, become distributed through the cell. Prior to irradiation, as shown in Fig. 6 , no particles are observed in the cytosol or nucleus and are clustered in the lysosomes. After irradiation with one laser pulse having a fluence between the bubble formation and cell damage thresholds (30 mJ/cm2), as shown in the images of Fig. 7 , substantially fewer lysosomes remain. Only a few lysosomes with a small number of enclosed particles remain intact. Light microscopy images that were taken in between the laser pulses initially show clearly distinguishable dark areas, which become more and more blurred after each pulse.
Fig. 6.
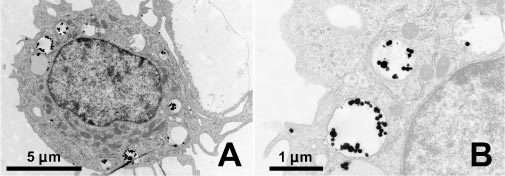
Transmission electron microscopy image of a Bac-1 cell after incubation for 3.5 hours with 90 nm gold spheres at 4.5∙109 particles/ml. A) The particles are accumulated in lysosomes throughout the cell but are not found within the nucleus or in the cytosol. B) Magnification of the upper left lysosomes in figure A.
Fig. 7.
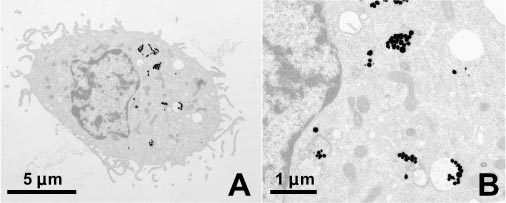
A) Bac-1 cell with 90 nm Au particles after single pulse irradiation with 30 mJ/cm2 at 532 nm; B) the magnified image shows that unlike prior to irradiation (Fig. 6) the lysosomes are mostly destroyed and the particles are more widely distributed in the cytosol.
4. Discussion
4.1. Single pulse damage mechanism
The measurements of the single pulse damage threshold clearly demonstrate that allowing cells to accumulate nanoparticles enhances the effect of vapor bubble formation. Experimentally, the bubble lifetime was found to be linearly dependent on the radiant exposure with different slopes depending on the applied nanoparticle concentration. The intersection of the linear fit with the horizontal axis reveals the threshold for bubble formation. For the data depicted in Fig. 4 these thresholds are 20 mJ/cm2 and 40 mJ/cm2 for the high and the low concentration of nanoparticles respectively. These thresholds are significantly lower than the threshold of vapor bubble formation around single nanoparticles of 60 mJ/cm2, that we found in our previous work [26]. This demonstrates that the clusters of nanoparticles inside the cell substantially increase the efficiency of vapor bubble formation.
The single pulse cell killing mechanism appears to be the growth of one or more vapor bubbles in the cell which rupture the cell membrane. According to Rayleigh [36], the bubble lifetime τ is proportionally related to the maximum bubble expansion:
| (1) |
Rayleigh’s equation was derived for free spherical bubbles and may slightly overestimate the size of the bubbles inside a cell [26]. Regardless, analysis of the average bubble lifetime at the threshold for acute damage revealed nearly the same lifetime was for all single-pulse experiments, typically 0.7 ± 0.1 µs which corresponds via Eq. (1) to a maximum bubble diameter of 7.6 ± 1.1 µm. This maximum bubble radius was confirmed within ± 20% by measurements of the bubble radius in images taken at about half the bubble lifetime. Since the measured average cell diameter is about 16 to 18 µm, bubbles of about half the cell size appear to instantaneously kill the cells. This rule of thumb likely applies to cells in which clusters of nanoparticles have been well integrated inside the cell.
When, for a given incubation time, the concentration of nanoparticles in the incubation suspension is sufficiently high, the cell damage threshold depends only on the amount of ingested gold. At low concentrations, fewer particles are taken up in the lysosomes, leading to smaller bubbles at the same radiant exposure. Increasing the concentration by a factor four from 0.6·109 particles/ml to 2.4·109 particles/ml halves the threshold for acute cell damage (Table 1). At higher concentrations both the engulfment saturates, as mentioned in the method section, and the damage threshold reaches a plateau. These results indicate that the irradiation effects are governed by accumulated nanoparticle volume inside the cell, whereas the size of the individual particles constituting the accumulation seems to be irrelevant.
Laser induced apoptosis is very unlikely at the irradiaton levels explored. No increased cell damage was found for cells that were kept in the incubator after irradiation with laser pulses just below the damage threshold. In addition, the comparison with experiments performed at 37°C showed that the temperature during pulsed irradiation neither influences the acute cell damage nor the long-term effects. Our observation that cells are either killed immediately upon vapor bubble formation or remain viable when irradiated with a single laser pulse corresponds to the results reported by Pistillides et al. [11].
4.2. Multiple pulse damage mechanism
Although the formation of small bubbles inside the cell does not cause immediate cell destruction, it does lead to the disruption of the lysosomes. Subsequent pulses distribute the nanoparticles inside the cell leading to a significant reduction of the cell damage threshold. The decrease in the pressure amplitude from pulse to pulse indicates a concomitant decrease in bubble diameter. Since the maximum size of the laser-induced vapor bubble depends on the absorbed energy density, the pressure amplitude decrease also reflects the wider distribution of the nanoparticles. Because cell damage occurs at significantly lower radiant exposures by significantly smaller vapor bubbles, the damage mechanism must have been modified. Membrane damage might be supported by repetitive stress from a number of small vapor bubbles or be induced via biochemical effects such as oxidative stress from generation of reactive oxygen species or release of intracellular Ca2+. Such biochemical effects have been reported for ultrasound exposure [37] and fs-pulse irradiation [38,39] and may occur upon exposure to ns-pulse induced vapor bubble formation in the immediate vicinity of cell organelles. However, we believe that the most important reason for the lower damage threshold under multiple pulse exposure is related to the change in position of the nanoparticles. During repetitive irradiation particles drift closer to the plasma membrane allowing smaller vapor bubbles to ultimately be sufficient for membrane destruction. This agrees with previously reported results for cells targeted with conjugated nanoparticles [20]. The weaker decrease in cell damage threshold observed upon multi-pulse irradiation of cells incubated with 60 and 40 nm particles compared to the larger 90 nm particles results from a much faster spreading of the smaller particles inside the cell. The minimum cell damage threshold found for multiple pulses was 23 ± 1 mJ/cm2 which corresponds well with the threshold for bubble formation inside the cell (Fig. 4) and is therefore most likely the lower limit for cell damage thresholds with these particles.
4.3. Implications
When irradiating cells with a single laser pulse, pressure transients were measured and bubble formation was seen at radiant exposures starting from 20 mJ/cm2. This indicates that pressure transients detected when irradiating a single cell only result from vapor bubble formation and collapse and not by thermoelastic expansion. In general, the threshold for bubble formation was about one third of the cell damage threshold. The vapor bubble induced pressure transients generated in this window between the bubble formation threshold and the cell destruction threshold are significantly stronger than thermoelastic transients and are, therefore, critical to the enhancement of optoacoustic imaging of nanoparticle targeted cells. When using multiple pulses, the window between bubble formation and cell damage, with its excellent properties for imaging, becomes even narrower. This has the further implication that optoacoustic imaging with contrast enhancing nanoparticles must be undertaken with care as the creation of the imaging signal may very well result in cell destruction. However, this same reduction of the cell damage threshold improves the outlook for therapeutic applications of nanoparticles for targeted cell destruction to be applied within the established laser safety standards. The measured lower limit for acute cell damage of 20-25 mJ/cm2 is close to the ANSI Z136.1 limit for skin exposure to 5 ns pulses at 532 nm, which is 15 mJ/cm2. Taking into account that gold nanoparticle aggregation or accumulation causes a broadening and red-shift in the absorption spectrum [40], we expect that the cell damage threshold can further be decreased by using longer laser wavelengths.
Single pulse irradiation below the cell damage threshold could also be used for active drug delivery into the cytosol of the cell when using gold nanoparticles functionalized with small molecules, peptides or proteins [41–43]. In this process the plasmonic heating and the formation of the vapor bubble ensure both the release of the payload from its carrier and the release into the cytosol from the encapsulation in the lysosome after uptake by the cell.
Although nanospheres themselves appear unsuitable for in vivo imaging applications due to the short radiation penetration depth and low multiple-pulse damage threshold, other options for in vivo applications remain viable. At short penetration depths, functionalized nanospheres may be useful for simultaneous imaging and phototherapeutic applications where the low threshold for cell destruction is acceptable. However, the majority of in vivo imaging applications require greater illumination penetration depth which can easily be achieved by using nanorods since their absorption spectrum can be shifted to longer wavelengths by adapting the particles aspect ratio [44]. In addition, recent work has demonstrated that such nano particles can be stabilized against surface melting [45], which should further improve their suitability. As these applications are explored, the mechanisms for laser induced cell damage presented in this work should transfer to other types of nanoparticles such as nanorods.
5. Conclusion
Damaging of cells by transient vapor bubbles generated around nanoparticle accumulations within Bac-1 cells was investigated. Accumulation of particles inside the lysosomes significantly reduces the threshold for vapor bubble formation and, therefore, the threshold of acute cell killing. Independent of the applied particle concentration, acute cell damage upon single pulse exposure occurred when the induced maximum bubble diameter exceeded about half the diameter of the cell. The experimental observations also indicate a saturation of the nanoparticle uptake in macrophages, which resulted in an equal single pulse damage threshold for nanoparticles of different size when available in similar mass concentration during incubation. Our study has further shown that repetitive irradiation of accumulated particles in cells lowers the damage threshold, which for 90 nm particles is a value close to the threshold of bubble formation in the cell. The resulting window between the threshold for multiple-pulse acute cell damage and vapor bubble creation appears exceedingly small. Since nanospheres resonance adsorption occurs at a relatively short wavelength, the substantial majority of in vivo applications will want to consider the use of nanorods to allow for greater tissue penetration depth. The mechanisms for nanoparticle-mediated laser induced cell damage will apply to other types of nanoparticles and serve as useful insight in the development of these in vivo applications.
Acknowledgments
The authors thank A. Stokes-Luginbühl for her assistance with embedding cells for TEM imaging. This research was supported in part by the Swiss National Science Foundation (Grant No. 205320-103872) and the 6th Framework Program of the European Commission within the Specific Targeted Research Project No. LSHC-CT-2006-018858 PROMET.
References and links
- 1.Raschke G., Kowarik S., Franzl T., Sönnichsen C., Klar T. A., Feldmann J., Nichtl A., Kürzinger K., “Biomolecular recognition based on single gold nanoparticle light scattering,” Nano Lett. 3(7), 935–938 (2003). 10.1021/nl034223+ [DOI] [Google Scholar]
- 2.Li T., Guo L., Wang Z., “Gold nanoparticle-based surface enhanced Raman scattering spectroscopic assay for the detection of protein-protein interactions,” Anal. Sci. 24(7), 907–910 (2008). 10.2116/analsci.24.907 [DOI] [PubMed] [Google Scholar]
- 3.Liu X., Dai Q., Austin L., Coutts J., Knowles G., Zou J., Chen H., Huo Q., “A one-step homogeneous immunoassay for cancer biomarker detection using gold nanoparticle probes coupled with dynamic light scattering,” J. Am. Chem. Soc. 130(9), 2780–2782 (2008). 10.1021/ja711298b [DOI] [PubMed] [Google Scholar]
- 4.Li P.-C., Wang C.-R. C., Shieh D.-B., Wei C.-W., Liao C.-K., Poe C., Jhan S., Ding A. A., Wu Y. N., “In vivo photoacoustic molecular imaging with simultaneous multiple selective targeting using antibody-conjugated gold nanorods,” Opt. Express 16(23), 18605–18615 (2008). 10.1364/OE.16.018605 [DOI] [PubMed] [Google Scholar]
- 5.Oh S. J., Kang J., Maeng I., Suh J.-S., Huh Y.-M., Haam S., Son J. H., “Nanoparticle-enabled terahertz imaging for cancer diagnosis,” Opt. Express 17(5), 3469–3475 (2009). 10.1364/OE.17.003469 [DOI] [PubMed] [Google Scholar]
- 6.Huff T. B., Tong L., Zhao Y., Hansen M. N., Cheng J.-X., Wei A., “Hyperthermic effects of gold nanorods on tumor cells,” Nanomedicine (Lond) 2(1), 125–132 (2007). 10.2217/17435889.2.1.125 [DOI] [PMC free article] [PubMed] [Google Scholar]
- 7.Huang X., Jain P. K., El-Sayed I. H., El-Sayed M. A., “Plasmonic photothermal therapy (PPTT) using gold nanoparticles,” Lasers Med. Sci. 23(3), 217–228 (2008). 10.1007/s10103-007-0470-x [DOI] [PubMed] [Google Scholar]
- 8.Anderson L. J. E., Hansen E., Lukianova-Hleb E. Y., Hafner J. H., Lapotko D. O., “Optically guided controlled release from liposomes with tunable plasmonic nanobubbles,” J. Control. Release 144(2), 151–158 (2010). 10.1016/j.jconrel.2010.02.012 [DOI] [PMC free article] [PubMed] [Google Scholar]
- 9.Tong L., Cheng J.-X., “Gold nanorod-mediated photothermolysis induces apoptosis of macrophages via damage of mitochondria,” Nanomedicine (Lond) 4(3), 265–276 (2009). 10.2217/nnm.09.4 [DOI] [PubMed] [Google Scholar]
- 10.Lapotko D., Lukianova E., Potapnev M., Aleinikova O., Oraevsky A., “Method of laser activated nano-thermolysis for elimination of tumor cells,” Cancer Lett. 239(1), 36–45 (2006). 10.1016/j.canlet.2005.07.031 [DOI] [PubMed] [Google Scholar]
- 11.Pitsillides C. M., Joe E. K., Wei X., Anderson R. R., Lin C. P., “Selective cell targeting with light-absorbing microparticles and nanoparticles,” Biophys. J. 84(6), 4023–4032 (2003). 10.1016/S0006-3495(03)75128-5 [DOI] [PMC free article] [PubMed] [Google Scholar]
- 12.Zharov V. P., Letfullin R. R., Galitovskaya E. N., “Microbubbles-overlapping mode for laser killing of cancer cells with absorbing nanoparticle clusters,” J. Phys. D Appl. Phys. 38(15), 2571–2581 (2005). 10.1088/0022-3727/38/15/007 [DOI] [Google Scholar]
- 13.Wu G., Mikhailovsky A., Khant H. A., Fu C., Chiu W., Zasadzinski J. A., “Remotely triggered liposome release by near-infrared light absorption via hollow gold nanoshells,” J. Am. Chem. Soc. 130(26), 8175–8177 (2008). 10.1021/ja802656d [DOI] [PMC free article] [PubMed] [Google Scholar]
- 14.Kelly K. L., Coronado E., Zhao L. L., Schatz G. C., “The optical properties of metal nanoparticles: the influence of size, shape, and dielectric environment,” J. Phys. Chem. B 107(3), 668–677 (2003). 10.1021/jp026731y [DOI] [Google Scholar]
- 15.Manohar S., Vaartjes S. E., van Hespen J. C. G., Klaase J. M., van den Engh F. M., Steenbergen W., van Leeuwen T. G., “Initial results of in vivo non-invasive cancer imaging in the human breast using near-infrared photoacoustics,” Opt. Express 15(19), 12277–12285 (2007). 10.1364/OE.15.012277 [DOI] [PubMed] [Google Scholar]
- 16.Hu S., Wang L. V., “Photoacoustic imaging and characterization of the microvasculature,” J. Biomed. Opt. 15(1), 011101 (2010). 10.1117/1.3281673 [DOI] [PMC free article] [PubMed] [Google Scholar]
- 17.Lapotko D. O., “Laser-induced bubbles in living cells,” Lasers Surg. Med. 38(3), 240–248 (2006). 10.1002/lsm.20284 [DOI] [PubMed] [Google Scholar]
- 18.Zharov V. P., Mercer K. E., Galitovskaya E. N., Smeltzer M. S., “Photothermal nanotherapeutics and nanodiagnostics for selective killing of bacteria targeted with gold nanoparticles,” Biophys. J. 90(2), 619–627 (2006). 10.1529/biophysj.105.061895 [DOI] [PMC free article] [PubMed] [Google Scholar]
- 19.Zharov V. P., Galitovskaya E. N., Johnson C., Kelly T., “Synergistic enhancement of selective nanophotothermolysis with gold nanoclusters: potential for cancer therapy,” Lasers Surg. Med. 37(3), 219–226 (2005). 10.1002/lsm.20223 [DOI] [PubMed] [Google Scholar]
- 20.Lapotko D., “Plasmonic nanobubbles as tunable cellular probes for cancer theranostics,” Cancers (Basel) 3(1), 802–840 (2011). 10.3390/cancers3010802 [DOI] [PMC free article] [PubMed] [Google Scholar]
- 21.Tong L., Wei Q., Wei A., Cheng J.-X., “Gold nanorods as contrast agents for biological imaging: optical properties, surface conjugation and photothermal effects,” Photochem. Photobiol. 85(1), 21–32 (2009). 10.1111/j.1751-1097.2008.00507.x [DOI] [PMC free article] [PubMed] [Google Scholar]
- 22.Tong L., Zhao Y., Huff T. B., Hansen M. N., Wei A., Cheng J. X., “Gold nanorods mediate tumor cell death by compromising membrane integrity,” Adv. Mater. (Deerfield Beach Fla.) 19(20), 3136–3141 (2007). 10.1002/adma.200701974 [DOI] [PMC free article] [PubMed] [Google Scholar]
- 23.Shukla R., Bansal V., Chaudhary M., Basu A., Bhonde R. R., Sastry M., “Biocompatibility of gold nanoparticles and their endocytotic fate inside the cellular compartment: a microscopic overview,” Langmuir 21(23), 10644–10654 (2005). 10.1021/la0513712 [DOI] [PubMed] [Google Scholar]
- 24.Chithrani D. B., Dunne M., Stewart J., Allen C., Jaffray D. A., “Cellular uptake and transport of gold nanoparticles incorporated in a liposomal carrier,” Nanomedicine 6(1), 161–169 (2010). 10.1016/j.nano.2009.04.009 [DOI] [PubMed] [Google Scholar]
- 25.Lapotko D. O., Lukianova-Hleb E. Y., Oraevsky A. A., “Clusterization of nanoparticles during their interaction with living cells,” Nanomedicine (Lond) 2(2), 241–253 (2007). 10.2217/17435889.2.2.241 [DOI] [PubMed] [Google Scholar]
- 26.Kitz M., Preisser S., Wetterwald A., Jaeger M., Thalmann G. N., Frenz M., “Vapor bubble generation around gold nano-particles and its application to damaging of cells,” Biomed. Opt. Express 2(2), 291–304 (2011). 10.1364/BOE.2.000291 [DOI] [PMC free article] [PubMed] [Google Scholar]
- 27.Jaffer F. A., Libby P., Weissleder R., “Molecular and cellular imaging of atherosclerosis: emerging applications,” J. Am. Coll. Cardiol. 47(7), 1328–1338 (2006). 10.1016/j.jacc.2006.01.029 [DOI] [PubMed] [Google Scholar]
- 28.Li A. C., Glass C. K., “The macrophage foam cell as a target for therapeutic intervention,” Nat. Med. 8(11), 1235–1242 (2002). 10.1038/nm1102-1235 [DOI] [PubMed] [Google Scholar]
- 29.McCarthy J. R., Jaffer F. A., Weissleder R., “A macrophage-targeted theranostic nanoparticle for biomedical applications,” Small 2(8-9), 983–987 (2006). 10.1002/smll.200600139 [DOI] [PubMed] [Google Scholar]
- 30.Lim Y. T., Cho M. Y., Choi B. S., Noh Y.-W., Chung B. H., “Diagnosis and therapy of macrophage cells using dextran-coated near-infrared responsive hollow-type gold nanoparticles,” Nanotechnology 19(37), 375105 (2008). 10.1088/0957-4484/19/37/375105 [DOI] [PubMed] [Google Scholar]
- 31.Gisler T., Rüger H., Egelhaaf S. U., Tschumi J., Schurtenberger P., Rička J., “Mode-selective dynamic light scattering: theory versus experimental realization,” Appl. Opt. 34(18), 3546–3553 (1995). 10.1364/AO.34.003546 [DOI] [PubMed] [Google Scholar]
- 32.Chithrani B. D., Ghazani A. A., Chan W. C. W., “Determining the size and shape dependence of gold nanoparticle uptake into mammalian cells,” Nano Lett. 6(4), 662–668 (2006). 10.1021/nl052396o [DOI] [PubMed] [Google Scholar]
- 33.Werb Z., Cohn Z. A., “Plasma membrane synthesis in the macrophage following phagocytosis of polystyrene latex particles,” J. Biol. Chem. 247(8), 2439–2446 (1972). [PubMed] [Google Scholar]
- 34.Asshauer T., Delacrétaz G., Jansen E. D., Welch A. J., Frenz M., “Pulsed holmium laser ablation of tissue phantoms: correlation between bubble formation and acoustic transients,” Appl. Phys. B 65(4-5), 647–657 (1997). 10.1007/s003400050327 [DOI] [Google Scholar]
- 35.Mühlfeld C., Rothen-Rutishauser B., Vanhecke D., Blank F., Gehr P., Ochs M., “Visualization and quantitative analysis of nanoparticles in the respiratory tract by transmission electron microscopy,” Part. Fibre Toxicol. 4(1), 11 (2007). 10.1186/1743-8977-4-11 [DOI] [PMC free article] [PubMed] [Google Scholar]
- 36.Rayleigh L., “On the pressure developed in a liquid during the collapse of a spherical cavity,” Philos. Mag. 34, 94–98 (1917). [Google Scholar]
- 37.Basta G., Venneri L., Lazzerini G., Pasanisi E., Pianelli M., Vesentini N., Del Turco S., Kusmic C., Picano E., “In vitro modulation of intracellular oxidative stress of endothelial cells by diagnostic cardiac ultrasound,” Cardiovasc. Res. 58(1), 156–161 (2003). 10.1016/S0008-6363(02)00665-X [DOI] [PubMed] [Google Scholar]
- 38.Baumgart J., Bintig W., Ngezahayo A., Lubatschowski H., Heisterkamp A., “Fs-laser-induced Ca2+ concentration change during membrane perforation for cell transfection,” Opt. Express 18(3), 2219–2229 (2010). 10.1364/OE.18.002219 [DOI] [PubMed] [Google Scholar]
- 39.Baumgart J., Kuetemeyer K., Bintig W., Ngezahayo A., Ertmer W., Lubatschowski H., Heisterkamp A., “Repetition rate dependency of reactive oxygen species formation during femtosecond laser-based cell surgery,” J. Biomed. Opt. 14(5), 054040 (2009). 10.1117/1.3253382 [DOI] [PubMed] [Google Scholar]
- 40.Khlebtsov B., Zharov V. P., Melnikov A., Tuchin V., Khlebtsov N. G., “Optical amplification of photothermal therapy with gold nanoparticles and nanoclusters,” Nanotechnology 17(20), 5167–5179 (2006). 10.1088/0957-4484/17/20/022 [DOI] [Google Scholar]
- 41.Ghosh P., Han G., De M., Kim C. K., Rotello V. M., “Gold nanoparticles in delivery applications,” Adv. Drug Deliv. Rev. 60(11), 1307–1315 (2008). 10.1016/j.addr.2008.03.016 [DOI] [PubMed] [Google Scholar]
- 42.Lévy R., Shaheen U., Cesbron Y., Sée V., “Gold nanoparticles delivery in mammalian live cells: a critical review,” Nano Rev 1(0), 4889–4907 (2010). 10.3402/nano.v1i0.4889 [DOI] [PMC free article] [PubMed] [Google Scholar]
- 43.Pissuwan D., Valenzuela S. M., Cortie M. B., “Therapeutic possibilities of plasmonically heated gold nanoparticles,” Trends Biotechnol. 24(2), 62–67 (2006). 10.1016/j.tibtech.2005.12.004 [DOI] [PubMed] [Google Scholar]
- 44.Link S., Mohamed M. B., El-Sayed M. A., “Simulation of the optical absorption spectra of gold nanorods as a function of their aspect ratio and the effect of the medium dielectric constant,” J. Phys. Chem. B 103(16), 3073–3077 (1999). 10.1021/jp990183f [DOI] [Google Scholar]
- 45.Chen Y.-S., Frey W., Kim S., Homan K., Kruizinga P., Sokolov K., Emelianov S., “Enhanced thermal stability of silica-coated gold nanorods for photoacoustic imaging and image-guided therapy,” Opt. Express 18(9), 8867–8878 (2010). 10.1364/OE.18.008867 [DOI] [PMC free article] [PubMed] [Google Scholar]


