Abstract
Serine hydroxymethyltransferase (SHMT) catalyzes the transfer of a beta carbon from serine to tetrahydrofolate (THF) to form glycine and 5,10-methylene-THF. This reaction plays an important role in neurotransmitter synthesis and metabolism. We set out to resequence SHMT1 and SHMT2, followed by functional genomic studies. We identified 87 and 60 polymorphisms in SHMT1 and SHMT2, respectively. We observed no significant functional effect of the 13 nonsynonymous SNPs in these genes, either on catalytic activity or protein quantity. We imputed additional variants across the two genes using “1000 Genomes” data, and identified 14 variants that were significantly associated (p-value < 1.0E-10) with SHMT1 mRNA expression in lymphoblastoid cell lines. Many of these SNPs were also significantly correlated with basal SHMT1 protein expression in 268 human liver biopsy samples. Reporter gene assays suggested that the SHMT1 promoter SNP, rs669340, contributed to this variation. Finally, SHMT1 and SHMT2 expression were significantly correlated with those of other Folate and Methionine Cycle genes at both the mRNA and protein levels. These experiments represent a comprehensive study of SHMT1 and SHMT2 gene sequence variation and its functional implications. In addition, we obtained preliminary indications that these genes may be co-regulated with other Folate and Methionine Cycle genes.
Keywords: Serine hydroxymethyltransferase 1 and 2, SHMT1, SHMT2, genetic polymorphisms, gene resequencing, single nucleotide polymorphisms, SNPs, functional genomics, one carbon metabolism
Introduction
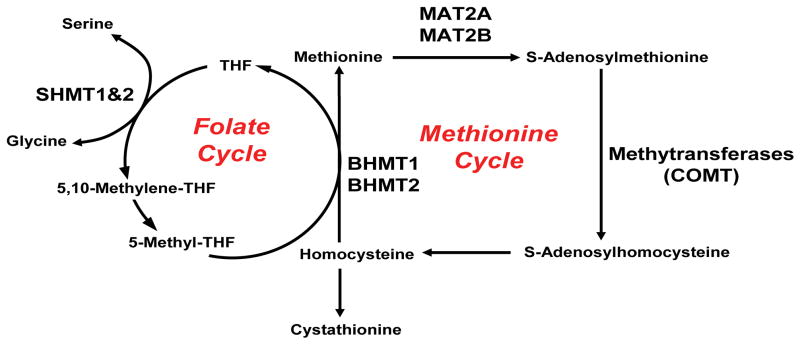
Serine hydroxymethyltransferase (SHMT) catalyzes the transfer of the beta carbon of serine to tetrahydrofolate (THF) to form glycine and 5,10-methylene-THF (Fig. 1). Glycine is an inhibitory neurotransmitter in the central nervous system, and both glycine and serine are N-methyl D-aspartate (NMDA) receptor modulators (Schell 2004). NMDA receptor agonists, including serine and glycine, have been reported to be decreased in both plasma and cerebrospinal fluid of patients with schizophrenia (Neeman et al. 2005, Sumiyoshi et al. 2004, Bendikov et al. 2007, Hashimoto et al. 2005, Hashimoto et al. 2003). In addition to the neurological implications of the SHMT substrate and product, serine and glycine, 5,10-methylene-THF is involved in serotonin synthesis, and low circulating folate levels have been associated with major depressive disorder (Miller 2008, Gilbody et al. 2007). Finally, 5,10-methylene-THF is a source of the one-carbon units that are required for neurotransmitter synthesis and metabolism (Miller 2008). However, even though SHMT1 and SHMT2 catalyze the same reaction, they play different biological roles.
Figure 1.
SHMT1, SHMT2, COMT, BHMT, GNMT, CBS, MAT2A and MAT2B and their roles in the Folate and Methionine Cycles.
SHMT2 maps to 12q13 (Garrow et al. 1993) and is expressed predominately in the mitochondrian, but it has also been reported to be present in the cytoplasm and nucleus (Anderson & Stover 2009). The GlyA Chinese hamster ovary cell line, which lacks SHMT2 activity, exhibits glycine auxotrophy (Pfendner & Pizer 1980). This phenotype can be rescued by SHMT2 transfection, suggesting that SHMT2 is essential for the formation of glycine in these cells in vivo (Stover et al. 1997, Anderson & Stover 2009). SHMT1 maps to 17p11.2 (Garrow et al. 1993) and is expressed in the cytoplasm, but it can be transported to the nucleus during S-phase (Anderson & Stover 2009). SHMT1 knockout mice are viable (MacFarlane et al. 2008) but, when they are crossed with a neural tube defect mouse model in which Pax3 is inactivated, the incidence of neural tube defects in the offspring is increased when pregnant mice are fed a low folate diet (Beaudin et al. 2011). Sequence variation in these genes, specifically the SHMT1 Lys474Phe variant allozyme, has been associated with decreased human red blood cell folate levels (Relton et al. 2004, Heil et al. 2001).
Although SHMT1 and SHMT2 encode important enzymes, no comprehensive attempt has been made to identify and functionally characterize common genetic variants in these genes. Therefore, we resequenced both SHMT1 and SHMT2 using DNA extracted from the Coriell Institute “Human Variation Panel” of lymphoblastoid cell lines (LCLs) obtained from 288 healthy subjects of three ethnicities. Functional genomic studies were then performed to determine whether sequence variation in these genes had an effect on transcription or, for nonsynonymous (ns) SNPs, protein quantity or enzyme activity of variant allozymes. Finally, we compared the relative expression of SHMT1 and SHMT2 mRNA expression in the “Human Variation Panel” LCLs to genotypes for these two genes. We also compared hepatic SHMT1/2 protein levels with previously published data for the protein expression for other Folate and Methionine Cycle proteins as well as SNP genotypes in those same liver samples. In summary, this study provides the first comprehensive overview of common genetic variation and the functional consequences of that variation for SHMT1 and SHMT2. We also obtained preliminary data which suggested the possible co-regulation of SHMT1 and SHMT2 with other Folate and Methionine Cycle genes.
Materials and Methods
DNA and tissue samples
Two hundred and eighty-eight “Human Variation Panel” DNA samples were obtained from the Coriell Cell Repository (Camden, NJ) [(96 European-American (EA), 96 African-American (AA), and 96 Han Chinese-American (HCA)]. These samples were collected from healthy subjects by the National Institute of General Medical Sciences. They were then anonymized and deposited in the Coriell Institute. Written informed consent had been obtained from all of these subjects for the use of their DNA for research purposes. We had previously generated and acquired genotype data for over 1.3 million SNPs in each of these 288 cell lines using both Affymetrix 6.0 SNP arrays (Santa Clara, CA) and Illumina (San Diego, CA) 550, 650, and 510s SNP arrays. In addition, we generated expression array data for 54,000 probesets for each cell line using Affymetrix U133 Plus2 microarrays, as described elsewhere (Li et al. 2008, Niu et al. 2010).
Two hundred sixty-eight adult liver surgical biopsy samples from which DNA and cytosol had been isolated were obtained from EA women undergoing clinically-indicated surgery at the Mayo Clinic, predominantly for the treatment of metastatic carcinoma. These samples were also anonymized, and their characteristics have been reported previously (Zhang et al. 2009, Feng et al. 2011, Hebbring et al. 2007). All of our studies were reviewed and approved by the Mayo Clinic Institutional Review Board
Gene resequencing and genotyping
PCR primers for the gene resequencing studies were designed to amplify all exons and splice junctions, 5′ and 3′-UTR sequences, and approximately 1 kb of 5′ and 3′-flanking sequences for SHMT1 and SHMT2. For SHMT2, a smaller gene than SHMT1, intronic sequences were also amplified and sequenced. PCR and sequencing primers were designed based on NCBI Build 36.1. Sequences for all of the primers are listed in Supplemental Table 1.
The 268 human liver biopsy samples were used as a source of both DNA and cytosol. The hepatic DNA was genotyped for 768 tag SNPs across SHMT1 and SHMT2 as well as other Folate and Methionine Cycle genes (see Fig. 1). Additional SNPs across SHMT1 and SHMT2 were then imputed using “1000 Genomes” pilot data (The 1000 Genomes Project Consortium 2010). The tag SNPs were selected to tag across 20 kb of flanking sequence with an r2 ≥ 0.8 and a minor allele frequency (MAF) ≥ 0.025. Tagging was accomplished utilizing LDselect (Carlson et al. 2004). Genotyping of the hepatic DNA was performed in the Mayo Genotyping Shared Resource utilizing Illumina Golden Gate chemistry. Of the 768 SNPs genotyped, 42 failed and 37 were monomorphic, leaving 689 SNPs for use in the association analysis.
SHMT1 and SHMT2 expression in COS-1 cells
cDNA clones for SHMT1 (NM_004169) and SHMT2 (NM_005412) in pCMB-XL5 were purchased from OriGene (Rockville, MD), and the open reading frames (ORFs) were sequenced and cloned into pcDNA 3.1D/V5-His-TOPO (Invitrogen, Carlsbad, CA). To create expression constructs for variant allozymes, site-directed mutagenesis was performed using the Stratagene QuikChange II kit (La Jolla, CA). All variant sequences were validated by bi-directional sequencing of the ORF. These constructs were co-transfected into COS-1 cells with the pSV-beta-galactosidase construct (Promega, Madison, WI) at a 4:1 ratio using Lipofectamine LTX Reagent (Invitrogen). After 48 h, the cells were harvested in 5 mM potassium phosphate buffer (pH 7.4); were homogenized with a Brinkmann Polytron homogenizer (Westbury, NY); and the homogenates were centrifuged at 1000 × g for 15 min. Supernatant containing both cytosol and mitochondria was aliquoted for storage at −80°C. These preparations were also used to assay beta-galactosidase activity to make it possible to correct for possible variation in transfection efficiency. All transfections were performed in triplicate.
SHMT enzyme activity assay
The SHMT activity assay was a modification of that published by Taylor and Weissbach as modified by Zhang et al (Taylor & Weissback 1965, Zhang et al. 2008). Specifically, 100 μl reaction mixtures contained 14 mM 6[R/S]-H4 pentaglutamate-Na2 (gift from Merk), 0.25 mM pyridoxal 5′-phosphotate hydrate, 2 mM serine, 1 nCi L-[3-14C]serine, 50 mCi/mmol (American Radiolabeled Chemicals, St Louis, MO), 0.07% beta-mercaptoethanol and cell extract. Cell extracts were added on the basis of the co-transfected beta-galactosidase activity. Reactions were incubated at 37oC for 1 h and were then placed on ice. The reaction was terminated by the addition of 75 μL 1 M Na acetate, followed by 50 μL of 0.1 M formaldehyde and 75 μL of 0.4 M dimedon in 50% ethanol. Samples were then incubated at 95oC for 5 min, chilled on ice for 5 min, and 1 mL of toluene was added. After vortexing and centrifugation at 10,000 x g for 15 min, 800 μL of the organic solvent was removed, added to 3 mL of liquid scintillation counting fluid, and radioactivity was measured in a Beckman Coulter CS6500 liquid scintillation counter (Brea, CA). For every transfection—with three independent transfections per allozyme—supernatant was assayed in triplicate. Each assay also included an “empty vector” control, a COS-1 cell control extract, a “no THF” blank and a “no protein” blank, all of which were also assayed in triplicate.
Western blot analysis
Cytosol preparations were subjected to electrophoresis performed with a 15 well 15% Tris HCl denaturing gel (BioRad; Hercules, CA). Protein extracts from COS-1 cells in 5 mM potassium phosphate buffer (pH 7.4) were loaded on the basis of co-transfected beta-galactosidase activity. For liver samples, 30 ng aliquots of cytosolic protein were loaded in triplicate, as determined by Bradford protein assays (Bradford 1976). The gels were stained overnight at 4°C with rabbit polyclonal antibodies (1/20,000). These antibodies were directed against amino acids 397–419 for SHMT1 and 474–494 for SHMT2. The peptides used to generate the antibodies were synthesized in the Mayo Proteomics Facility, and rabbit polyclonal antibodies to these peptides were generated by Cocalico Biologicals, Inc. (Reamstown, PA). Following primary antibody staining, the gels were stained with goat anti-rabbit HRP conjugate (BioRad) (1/20,000) for 1 h at room temperature. Bound antibody was detected using the Immun-Star WesternC Kit (BioRad) and were quantified with a Molecular Imager ChemiDoc XRS (BioRad). For the COS-1 cell extracts, all variant allozymes were quantitated relative to a single standard preparation of wild type (WT) allozyme assayed on the same gel. For the liver samples, WT recombinant SHMT1 expressed in COS-1 cells was also assayed in triplicate on every gel as a positive control and to make it possible to express the protein quantity relative to recombinant protein.
Dual luciferase reporter assays
To study the possible effect of the two top SHMT1 SNPs that were associated with expression in the LCLs (rs669340 and rs7207306) as well as 2 SHMT1 promoter SNPs (rs638416 and rs643333) on transcription, luciferase reporter gene constructs were created. For the promoter SNPs, 1kb of SHMT1 5′-flanking sequence that contained the two promoter SNPs was cloned into pGL3 basic (Promega, Fitchburg, WI) upstream of the luciferase ORF. For rs669340 and rs7207306, both which map to SHMT1 introns, approximately 200 bp of appropriate intron sequence was cloned upstream of the WT SHMT1 promoter. Sequences of the primers used to perform these amplifications are listed in Supplemental Table 1. Reporter gene constructs (1 μg) were cotransfected in triplicate into HepG2 cells with 20 ng of the pRL-TK vector, followed by dual luciferase assays performed 24 h after transfection (Promega). Two separate transfection experiments were performed for each pGL3 construct and each construct was used to perform 3 separate transfections per experiment.
Data analysis
Basal expression array data for the 288 LCLs, the cell lines used to extract the DNA used in the resequencing studies, have been reported previously (Li et al. 2008, Niu et al. 2010). Each SNP studied was associated with SHMT1 and SHMT2 mRNA expression as described previously (Niu et al. 2010). Relative quantities of hepatic SHMT1 protein were associated with SNP genotypes (modeled as count of rare allele) using Spearman rank correlations. Similarly, the 3 pairwise associations of age adjusted COMT activity (since age was associated with COMT activity, but not BHMT or SHMT1 protein), BHMT protein and SHMT1 protein were quantified using Spearman (partial) correlations. Age adjusted COMT activity was constructed by regressing COMT activity on age and obtaining the residuals. For SNP tagging and fine mapping, “1000 Genomes” pilot data (The 1000 Genomes Project Consortium 2010) were used as a reference for imputation performed with Mach 1.0 software package (Li et al. 2006). To account for the three racial groups represented in the LCLs, each racial group was imputed individually with the appropriate “1000 Genomes” reference set. Estimated allele dosage values for the imputed genotypes were used to perform association analysis, and the most probable genotype was used during SNP tagging.
Results
SHMT1 and SHMT2 gene resequencing
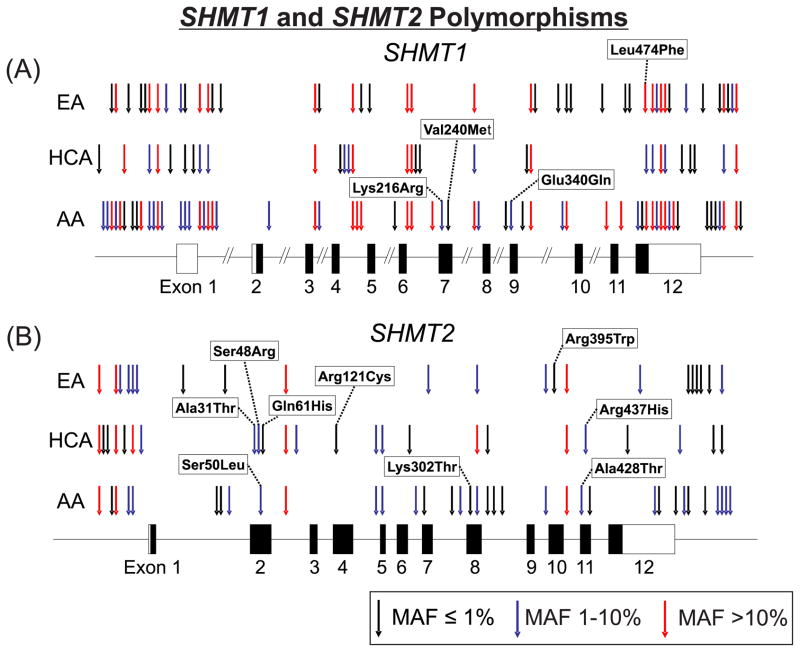
Resequencing of SHMT1 resulted in the identification of 87 polymorphisms, including 4 indels and 4 nsSNPs (Fig. 2). As expected, more variants were identified in the AA (N=60) than in EA (N=30) or HCA (N=30) samples, with 17 variants that were shared among all three populations. Most of the variants were rare, with 32, 18 and 9 having MAFs > 5% in AA, EA and HCA samples, respectively. Of the nsSNPs, all but the common Leu474Phe (1420C>T), were rare and were observed only in AA subjects: Lys216Arg (647A>G), Val240Met (718G>A), and Glu340Gln (1018G>C), with MAFs in AA subjects of 3%, 0.5% and 2%, respectively. Resequencing of SHMT2 resulted in the identification of 60 variants, including 8 indels and 9 nsSNPs (Fig. 2). Once again, the largest number of variants was identified in the AA population (N=35), with 21 and 24 in EA and HCA subjects, respectively. Most of the SHMT2 variants were also rare, with 6, 5 and 10 variants with MAFs of > 5% identified in AA, EA, and HCA subjects, respectively. Of the nsSNPs, all but Ser50Leu (149C>T) (AA MAF = 5%), Ala428Thr (1282G>A) (AA MAF = 1%), and Arg437His (1310G>A) (HCA MAF = 3%) had MAFs less than 1%, and all were specific to a single race. Of the 147 variants observed in this study, 73 were novel, including eight nsSNPs, based on dbSNP build 33 and “1000 Genomes” data. A summary of our SHMT1 and SHMT2 polymorphisms, compared with “1000 Genomes” data, is listed in Supplementary Table 2. Linkage disequilibrium (LD) plots for both genes based on our gene resequencing data and generated with Haploview are shown in Supplementary Fig. 1, and predicted haplotypes observed during gene resequencing are listed in Supplementary Tables 3 and 4.
Figure 2.
SHMT1 and SHMT2 genetic polymorphisms. Arrows indicate the locations of polymorphisms identified during the resequencing of (A) SHMT1 and (B) SHMT2 for each of the three populations studied. MAFs are indicated by the color of the arrows. Black rectangles indicate exons that include coding sequence, while white rectangles are exons or portions of exons that encode 5′- and 3′-UTR sequence.
Allozyme activity and protein quantity
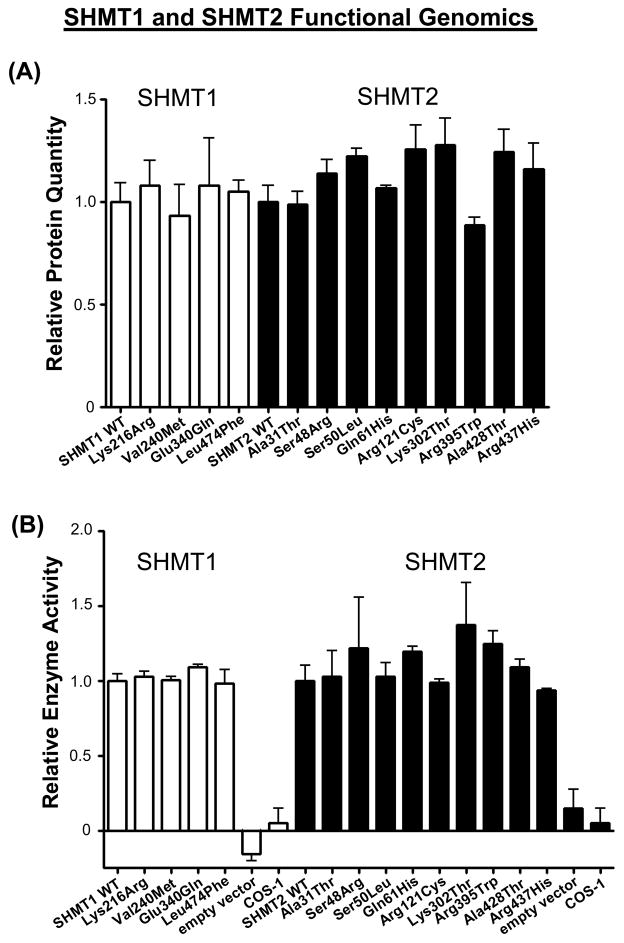
Expression constructs for all 13 nsSNPs identified during our resequencing studies, as well as WT constructs for SHMT1 and SHMT2, were transfected into COS-1 cells to ensure that mammalian systems for post-translational modification and protein degradation would be present. Quantitative protein and enzyme activity levels, relative to WT for the appropriate gene, are shown graphically in Fig. 3. Although there was more variability in both protein quantity and enzyme activity for SHMT2 than for SHMT1 allozymes, none of the variant allozymes for either gene differed significantly from their respective WT allozyme in either protein quantity or enzyme activity.
Figure 3.
SHMT1 and SHMT2 functional genomics. (A) Protein quantity and (B) enzyme activity results relative to WT are shown for the variant allozymes for the two genes after expression in COS-1 cells. White bars represent values for SHMT1, while black bars represent SHMT2 data. Values are mean ± SEM for three independent determinations.
SNP expression associations
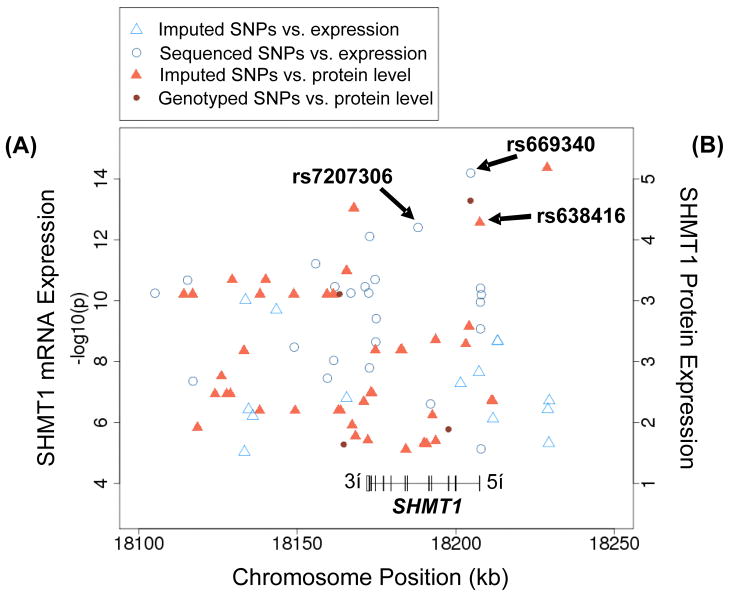
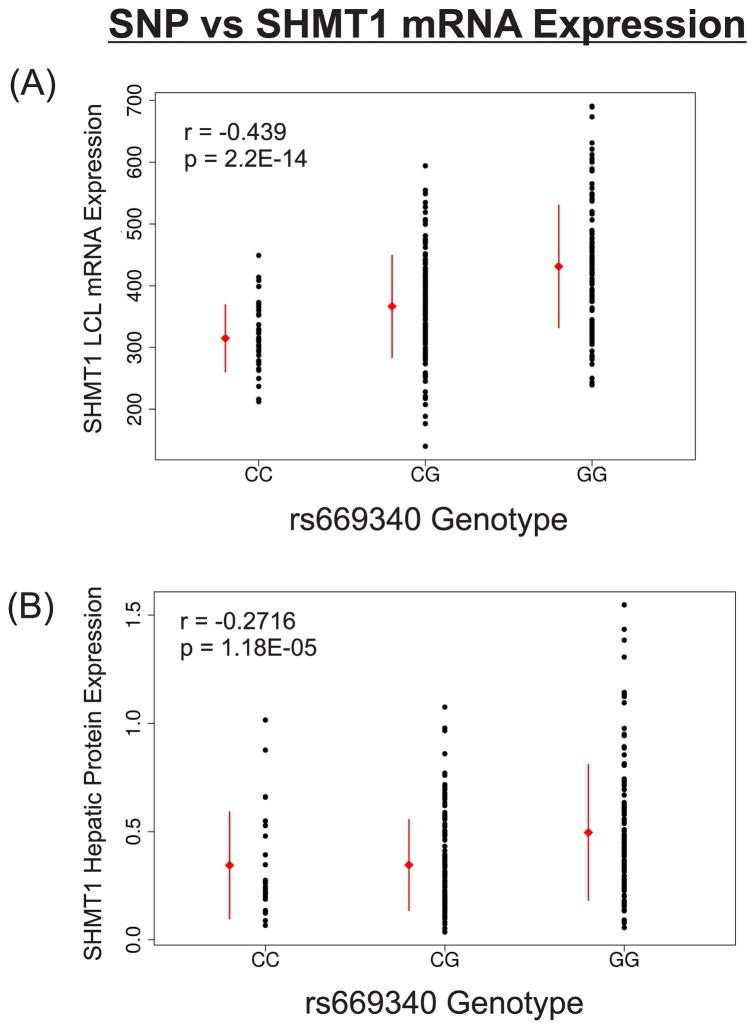
Significant associations between SNP genotypes and SHMT1 mRNA levels, as determined by expression array analysis for the LCLs from which the DNA for gene resequencing had been extracted, were observed across SHMT1, with the strongest associations for rs669340 in intron 1 and rs7207306 in intron 5, with p-values of 2.2E-14 and 5.4E-13, respectively (Fig. 4). With 415 association tests in the region defined by Fig. 4 (including imputed and genotyped SNPs), p-values less than 1.2E-04 were significant even after Bonferroni correction for multiple comparisons. The association of genotype for the rs669340 with mRNA expression in the LCLs is shown graphically in Fig. 5A. All other highly significant variants (p<E-05) were in tight linkage disequilibrium (LD) with one of these two SNPs. To verify the mRNA microarray values, 33 EA samples were selected randomly to perform RT-PCR. The r2 value for the correlation between SHMT1 mRNA expression measured by RT-PCR and by Affymetrix expression microarray was 0.55 (p = 4.3E-07) (data not shown). Our correlations of SNP genotypes with SHMT1 mRNA expression are similar to results reported during previous studies. For example, the rs669340 SNP was strongly associated with SHMT1 mRNA expression in 1,490 monocytes in a German population (Zeller et al. 2010), while the rs7207306 SNP was associated with SHMT1 mRNA expression in 210 HapMap LCLs (Stranger et al. 2007). Based on our results, these two SHMT1 SNPs with the lowest p-values for association with SHMT1 mRNA expression were in only weak LD, with r2 values of 0.20, 0.03, and 0.18 in EA, HCA and AA samples, respectively. This might indicate that each of these SNPs is in partial LD with a single causative variant. To evaluate that possibility, haplotype analysis was performed, but no haplotype explained variation beyond what we observed during the univariant analysis (data not shown). In addition, even after adjusting the association of one of these two SNPs for the other, strong associations remained (data not shown). Finally, imputation across SHMT1 did not identify any additional variants that were more significant than those measured directly by either sequencing or genotyping (Fig. 4), suggesting there might be two or more functional variants which were associated—independently—with SHMT1 mRNA expression. No SNPs in SHMT2, either sequenced or imputed, were strongly associated with SHMT2 mRNA expression in the LCLs (lowest p-value=0.008 for an imputed SNP, rs74429938, located 30 kb 5′-upstream of SHMT2).
Figure 4.
SHMT1 SNPs associated with (A) SHMT1 mRNA expression (p<1E-05) and (B) SHMT1 hepatic liver protein expression (p<0.01). Circles represent genotyped or sequenced SNPs, while triangles represent imputed SNPs. The location and structure of the SHMT1 gene is also shown.
Figure 5.
Correlation of SHMT1 rs669340 genotypes with (A) LCL mRNA expression or (B) human hepatic cytosol SHMT1 protein concentrations. Red error bars represent mean +/-standard deviation.
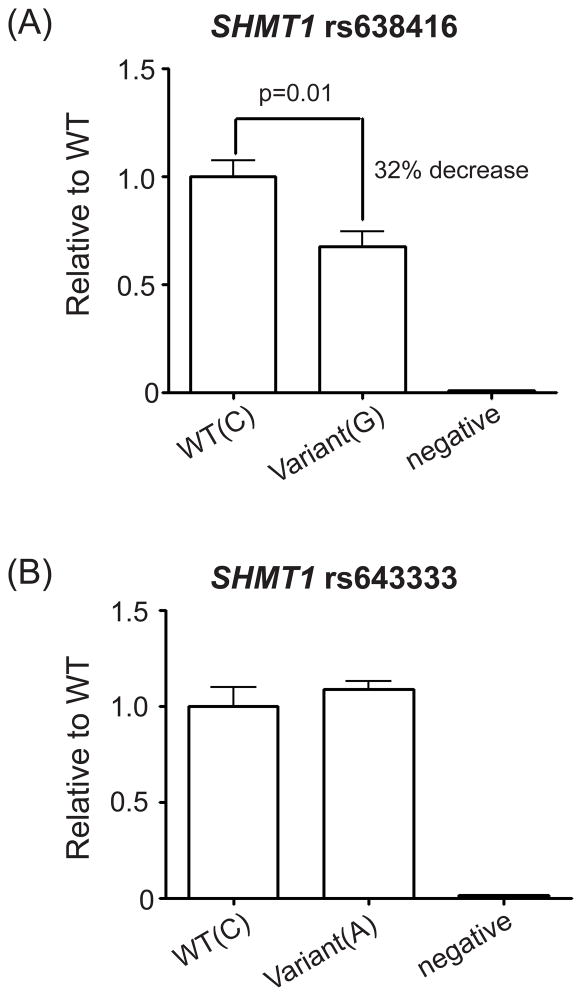
The two SNPs with the lowest p-values for association with SHMT1 expression (rs669340 and rs7207306), as well as two common SHMT1 promoter SNPs, rs643333 and rs638416 located directly upstream of the transcription start site, were selected for functional study. The two promoter SNPs were selected based on their strong associations with mRNA expression (rs643333, p=9.8E-10 and rs638416, p=1.00E-08), their location in or near the core promoter, and their strong LD with the two most significant SNPs that were associated with mRNA expression. However, these two promoter SNPs were not in LD with each other (r2 for AA=0.03, for EA=0.22 and HCA=0.07). To perform the functional studies, approximately 200 bp surrounding each of the intron SNPs and approximately 1 kb of the SHMT1 5′-flanking region sequence were cloned into the pGL3 reporter gene construct, followed by reporter gene assays performed in HepG2 cells, resulting in a 130 to 230-fold induction of luciferase activity for the promoter SNPs when compared to “empty” vector, suggesting that the SHMT1 core promoter was present within the cloned segment. Expression of a construct with the rs638416 variant allele in HepG2 cells resulted in a 32% reduction in luciferase activity as compared to the WT sequence (p=0.01) (Fig. 6A). However, there was no significant change in luciferase activity in reporter gene constructs carrying either of the rs643333 alleles (Fig. 6B). Finally, inclusion of the intron SNPs rs7207306 or rs669340 upstream of the apparent core promoter failed to show a significant change in luciferase activity in reporter gene constructs (Supplementary Fig. 2).
Figure 6.
Dual reporter assay results for (A) rs638416 and (B) rs643333 in HepG2 cells. Error bars indicate mean ± SEM for three independent assays.
Association of SHMT1 SNPs and human liver protein levels
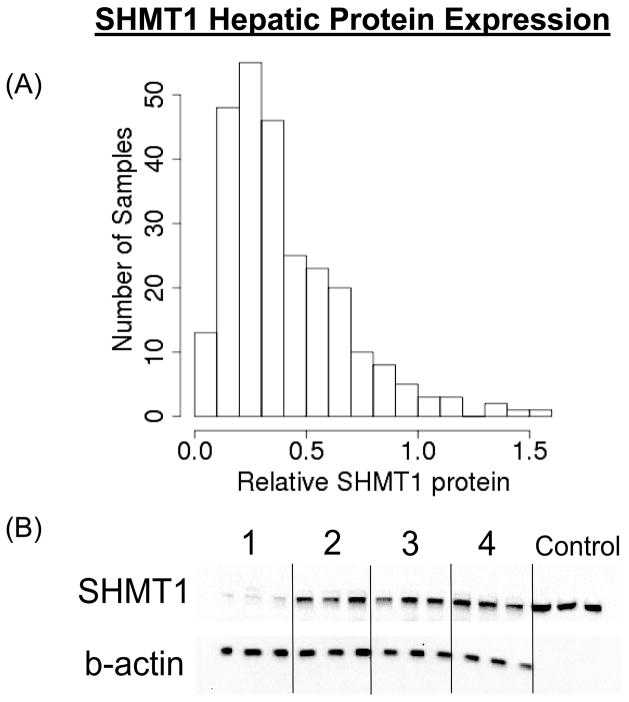
We followed our studies of SNP associations with mRNA expression in LCLs with studies of human liver biopsy cytosol samples. Because these biopsy samples had been obtained during clinically-indicated surgery, we were unable to assay mRNA because of its instability in these clinical samples, but we were able to compare genotype with protein quantity in the hepatic cytosol preparations. It should be emphasized that these studies were performed with the clear understanding that transcription regulation is tissue-specific and that mRNA expression is not always directly correlated with protein expression. Relative SHMT1 protein levels, measured by quantitative Western blot analysis in the 268 human liver cytosol preparations, showed significant individual variation (Fig. 7A). Specifically, the level of protein varied 5-fold within mid 95% of the protein level distribution. An example of Western blots is shown in Fig. 7B. A total of 689 tag SNPs for the Folate and Methionine Cycle genes shown in Fig. 1 were genotyped using DNA from these same hepatic surgical biopsy samples and were then analyzed for their possible association with SHMT1 protein levels. For SHMT1 itself, a total of 16 SNPs were selected to tag 84 common variants (MAF > 0.025) across the gene. The rs669340 SNP in intron 1 that was highly associated with SHMT1 mRNA levels in the LCLs showed the most significant association with hepatic SHMT protein levels (p=1.18E-05) (see Fig. 4). The rs669340 SNP remained significant after Bonferroni correction (Bonferroni adjusted p=0.0081). The association of genotypes for this SNP with hepatic protein levels is shown graphically in Fig. 5B. No other SNP displayed a significant correlation after correction for multiple comparisons. We did not observe a significant association of the SHMT1 intron 5 SNP with protein quantity in the liver samples using the rs8074444 (r2 = 0.88) and rs2461838 (r2 =0.98) tag SNPs to “tag” rs7207306 (p-value = 0.95 and 0.82, respectively)
Figure 7.
Human hepatic cytosol SHMT1 protein concentrations. (A) Distribution of relative hepatic cytosolic SHMT1 protein levels in 268 human liver biopsy samples as well as (B) a representative gel including four liver samples and a recombinant SHMT1 reference standard.
Methionine and Folate Cycle analysis
In order to take advantage of as much of the available data as possible, we also analyzed previously reported LCL mRNA data for these 288 LCLs as well as hepatic protein/enzyme activity levels for other Methionine Cycle enzymes (COMT, BHMT, MAT2A and MAT2B) (Fig. 1) that had been published for these same 286 liver biopsy samples (Nordgren et al. 2011, Feng et al. 2011, Zhang et al. 2009). BHMT was not expressed in the LCLs, but mRNA expression for the important methyltransferase enzyme COMT was significantly correlated with SHMT2 mRNA expression in those cells (p=3.20E-11, r=0.38). COMT mRNA expression was also associated with that for SHMT1 (p=0.0003, r=0.21) (Table 1). Also striking was the correlation between SHMT1 and SHMT2 mRNA levels in the LCLs (p=2.32E-12, r=0.40) and that between SHMT1 and MAT2A mRNA in those same cells (p=5.02E-11, r=0.38) (Table 1). We also observed a significant correlation between SHMT1 protein quantity and COMT enzyme activity in the liver cytosol preparations (p=0.003, r=0.18). Hepatic SHMT1 protein level was also associated with hepatic BHMT protein level (p=0.018, r=0.15), and BHMT protein concentrations in those samples was correlated with COMT activity (p=0.003, r=0.18) (Table 1B). In both datasets shown in Table 1 (i.e. mRNA and protein), both nominal p-values and p-values adjusted to correct for multiple comparisons are listed. After applying conservative Bonferroni correction, only the correlation between BHMT protein and SHMT1 protein was no longer statistically significant (Bonferroni adjusted p=0.216). These results, taken as a whole, strongly suggest the possibility of coordinated regulation of at least some of the Folate and Methionine Cycle genes at the levels of transcription and/or protein expression.
Table 1.
(A) Pearson correlations for mRNA expression values measured in 288 LCLs. The “top half” of the table contains nominal p-values as well as Bonferroni adjusted p-values in parentheses, while the “bottom half” lists r values. Shaded and bolded values represent significant correlations (nominal p-value<0.05). (B) Spearman correlations, nominal p-values and Bonferroni adjusted p-values as shown in (A) for protein concentrations measured in 268 human hepatic biopsy samples
| (A) Human LCL mRNA expression correlations. | |||||
|---|---|---|---|---|---|
| SHMT1 | SHMT2 | COMT | MAT2A | MAT2B | |
| SHMT1 | ------------ | 2.32E-12 | 2.97E-04 | 5.02E-11 | 1.22E-06 |
| (2.78E-11) | (3.56E-03) | (6.02E-10) | (1.46E-05) | ||
| SHMT2 | 0.40 | ------------ | 3.20E-11 | 7.05E-04 | 0.125 |
| (3.84E-10) | (8.46E-03) | ||||
| COMT | 0.21 | 0.38 | ------------ | 2.52E-03 | 0.137 |
| (3.02E-02) | |||||
| MAT2A | 0.38 | 0.20 | 0.18 | ------------ | 5.16E-05 |
| (6.19E-04) | |||||
| MAT2B | -0.28 | −0.09 | −0.09 | 0.24 | ------------ |
| (B) Human hepatic biopsy cytosol protein expression correlations. | |||
|---|---|---|---|
| SHMT1 | BHMT | COMT | |
| SHMT1 | ------------- | 0.018 | 0.003 |
| (0.216) | (0.036) | ||
| BHMT | 0.15 | ------------- | 0.003 |
| (0.036) | |||
| COMT | 0.18 | 0.18 | ------------- |
Discussion
The Folate Cycle plays an important role in neurological development, as demonstrated by the link between folate intake and risk for NTDs. SHMT1 and SHMT2 represent an important component of the Folate Cycle (see Fig. 1). Substrates and products for these enzymes are neurotransmitter receptor modulators (glycine and serine), inhibitory neurotransmitters (glycine), and precursors for monoamine neurotransmitter biosynthesis (5,10-methylene-THF). The SHMT enzymes also provide single carbon units that can be used for homocysteine remethylation (Miller 2008). Genetic variation in SHMT1 and SHMT2 has been associated with a wide variety of human phenotypes, including risk for neural tube defects (Relton et al. 2004, Heil et al. 2001), childhood acute leukemia (Vijayakrishnan & Houlston 2010), rectal carcinoma (Komlosi et al. 2010), and prostate cancer (Collin et al. 2009). Most of those studies focused on the SHMT1 Leu474Phe variant allozyme. However, we failed to detect significant differences in either enzyme activity or protein quantity, as compared to WT, for any of the 9 nsSNPs in SHMT2 or the 4 nsSNPs in SHMT1, including Leu474Phe (Fig. 3). Therefore, our results suggest that these 13 nsSNPs, including that encoding Lys474Phe, might not themselves be biologically relevant, a conclusion that agrees, in part, with previous substrate kinetic studies (Fu et al. 2005). Obviously, we can not rule out the possibility that these variants might have a significant effect on other activities catalyzed by SHMT1 that we did not measure (Schirch & Szebenyi 2005).
Although none of the nsSNPs that we observed was associated with significant functional consequences, we did identify very strong relationships between SHMT1 mRNA expression in LCLs and SNP genotypes (Fig. 4). The strongest associations were observed for rs669340 in intron 1 (p = 2.2E-14) and rs7207306 in intron 5 (p = 5.4E-13). It might be useful to point out that rs1979277, which encodes the Leu474Phe variant allozyme, was also strongly associated mRNA expression in the LCLs (p-value=6.29E-06), and that it is in LD with rs7207306, which might explain, in part, the clinical associations reported previously for this SNP (Collin et al. 2009, Heil et al. 2001, Komlosi et al., Relton et al. 2004, Vijayakrishnan & Houlston 2010). However, rs669340 and rs7207306 in introns 1 and 5, respectively, were not in LD with one another (r2=0.03–0.20), suggesting there might be two or more SNPs that regulate SHMT1 expression. In an attempt to validate and extend associations that we observed in LCLs at the mRNA level, with a clear understanding that transcription regulation is tissue-specific, we also assayed variation in SHMT1 protein concentrations in cytosolic preparations obtained from human liver biopsy samples. Of the SNPs that were genotyped, rs669340 in intron 1 showed the strongest association with protein quantity (p=1.18E-05) (Figs. 4 and 5B). That association remained significant even after correcting for multiple comparisons. However, the intron 5 SNP (rs7207306) was not significantly associated with hepatic cytosol SHMT1 protein levels–serving to emphasize the tissue-specific nature of transcription regulation.
In an attempt to identify functional candidates that might regulate transcription and/or translation, we considered all SNPs with strong associations to either SHMT1 mRNA expression in LCLs and/or protein expression in human hepatic tissue as possible candidates for further functional follow-up. Although rs7207306 and rs669340 had the lowest p-values, 14 additional SNPs had significant associations with SHMT1 mRNA expression (p<1E-10) that could potentially be functional (Fig. 4). Therefore, we studied the function of rs7207306 and rs669340, the SNPs with the lowest p-values, as well as two promoter SNPs, rs638416 and rs643333. The rs638416 SNP is located (−119) bp from the site of transcription initiation and is in strong LD with rs669340, while rs643333 is located (−283) bp from the transcription start site and is in LD with rs7207306. These two SNPs, as well as approximately 1 kb of 5′-flanking sequence, a region that we had resequenced, were cloned into luciferase reporter gene constructs and expressed in HepG2 cells. Both rs638416 and rs643333 map to a region of SHMT1 that contains many experimentally characterized transcription factor binding sites based on the “ENCODE Integrated Regulation” track on the UCSC genome browser (http://genome.ucsc.edu). For example, the rs638416 variant allele disrupts a WT1 transcription factor binding site, while the variant allele for rs643333 introduces a putative SRF transcription factor binding site (http://gene-regulation.com/pub/programs/alibaba2/index.html). The results of our dual luciferase assays suggested that rs638416 might be functional (Fig. 6). However, rs643333 did not appear to be functional in HepG2 cells, although we cannot rule out the possibility that the effect of this SNP on SHMT1 transcription is specific to LCLs. In addition, the two most significant SNPs associated with mRNA expression, rs7207306 and rs669340, also failed to show a significant effect on transcriptional activity as determined by reporter gene assay (Supplementary Fig. 2), although we cannot exclude the possibility that these variants might be functional through other mechanisms (e.g., epigenetics).
Finally, in an attempt to take a broader approach that extended beyond SHMT1 and SHMT2, we compared previously published mRNA expression data for the same LCLs that were used in our studies as well as previously published hepatic protein expression data for the same hepatic biopsy samples that we studied for four other Folate and Methionine Cycle genes, COMT, BHMT, MAT2A and MAT2B (Fig. 1). Strong correlations were observed between mRNA expression levels among SHMT1, SHMT2, COMT, MAT2A and MAT2B in the LCLs (Table 1). BHMT was not expressed in these cells. At the protein level, SHMT1 was significantly correlated with both COMT enzyme activity and BHMT protein levels in cytosol preparations from the same set of hepatic biopsy samples (Table 1). These observations raise the possibility that genes encoding proteins within the Folate and Methinone Cycles might be regulated in a “coordinated fashion”. These associations will obviously require replication and the mechanism(s) responsible will require functional pursuit in the course of future experiments.
In summary, the results of the present study indicate that nsSNPs—SNPs that alter the encoded amino acid—in SHMT1 and SHMT2 may not have a major effect on the biological function of these enzymes, but multiple SNPs within SHMT1 are associated with SHMT1 mRNA expression, which could help explain some of the clinical association results that have been reported (Collin et al. 2009, Heil et al. 2001, Komlosi et al. 2010, Relton et al. 2004, Vijayakrishnan & Houlston 2010). Finally, SHMT1 and SHMT2, as well as other Folate and Methionine Cycle genes, might be regulated in a coordinated but complex fashion. Therefore, the present study not only describes individual genetic variation that directly affects SHMT1 and SHMT2 activity, but may also provide insight into the overall regulation of the Folate and Methionine Cycles.
Supplementary Material
Acknowledgments
This work was supported in part by National Institutes of Health grants R01 GM28157, U19 GM61388 (The Pharmacogenomics Research Network), R21 CA140879, and R21 GM86689, and by a PhRMA Foundation “Center of Excellence Award in Clinical Pharmacology”. We thank Luanne Wussow for her assistance with the preparation of this manuscript. We have no conflicts of interest to report.
Abbreviations
- AA
African-American
- BHMT
betaine-homocysteine methyltransferase
- CBS
cystathionine beta synthase
- COMT
catechol O-methyltransferase
- DNA
deoxyribonucleic acid
- EA
European-American
- ENCODE
encyclopedia of DNA elements consortium
- GlyA
glycine auxotrophy
- GNMT
glycine N-methyltransferase
- HCA
Han Chinese-American
- LCL
lymphoblastoid cell line
- LD
linkage disequilibrium
- MAF
minor allele frequency
- MAT2A/2B
methionine adenosyltransferase 2A or 2B
- mRNA
messenger ribonucleic acid
- NMDA
N-methyl D-aspartate
- ORF
open reading frame
- RT-PCR
reverse transcriptase polymerase chain reaction
- SHMT1/2
serine hydroxymethyltransferase 1 or 2
- SNP
single nucleotide polymorphism
- nsSNP
nonsynonymous single nucleotide polymorphism
- SRF
serum response factor
- THF
tetrahydrofolate
- UTR
untranslated region
- V
variant
- WT
wild type
- WT1
Wilms tumor 1
References
- Anderson DD, Stover PJ. SHMT1 and SHMT2 are functionally redundant in nuclear de novo thymidylate biosynthesis. PLoS One. 2009;4:e5839. doi: 10.1371/journal.pone.0005839. [DOI] [PMC free article] [PubMed] [Google Scholar]
- Beaudin AE, Abarinov EV, Noden DM, Perry CA, Chu S, Stabler SP, Allen RH, Stover PJ. Shmt1 and de novo thymidylate biosynthesis underlie folate-responsive neural tube defects in mice. Am J Clin Nutr. 2011;93:789–798. doi: 10.3945/ajcn.110.002766. [DOI] [PMC free article] [PubMed] [Google Scholar]
- Bendikov I, Nadri C, Amar S, Panizzutti R, De Miranda J, Wolosker H, Agam G. A CSF and postmortem brain study of D-serine metabolic parameters in schizophrenia. Schizophr Res. 2007;90:41–51. doi: 10.1016/j.schres.2006.10.010. [DOI] [PubMed] [Google Scholar]
- Bradford MM. A rapid and sensitive method for the quantitation of microgram quantities of protein utilizing the principle of protein-dye binding. Anal Biochem. 1976;72:248–254. doi: 10.1016/0003-2697(76)90527-3. [DOI] [PubMed] [Google Scholar]
- Carlson CS, Eberle MA, Rieder MJ, Yi Q, Kruglyak L, Nickerson DA. Selecting a maximally informative set of single-nucleotide polymorphisms for association analyses using linkage disequilibrium. Am J Hum Genet. 2004;74:106–120. doi: 10.1086/381000. [DOI] [PMC free article] [PubMed] [Google Scholar]
- Collin SM, Metcalfe C, Zuccolo L, et al. Association of folate-pathway gene polymorphisms with the risk of prostate cancer: a population-based nested case-control study, systematic review, and meta-analysis. Cancer Epidemiol Biomarkers Prev. 2009;18:2528–2539. doi: 10.1158/1055-9965.EPI-09-0223. [DOI] [PubMed] [Google Scholar]
- Feng Q, Kalari K, Fridley BL, et al. Betaine-homocysteine methyltransferase: human liver genotype-phenotype correlation. Mol Genet Metab. 2011;102:126–133. doi: 10.1016/j.ymgme.2010.10.010. [DOI] [PMC free article] [PubMed] [Google Scholar]
- Fu TF, Hunt S, Schirch V, Safo MK, Chen BH. Properties of human and rabbit cytosolic serine hydroxymethyltransferase are changed by single nucleotide polymorphic mutations. Arch Biochem Biophys. 2005;442:92–101. doi: 10.1016/j.abb.2005.07.018. [DOI] [PubMed] [Google Scholar]
- Garrow TA, Brenner AA, Whitehead VM, Chen XN, Duncan RG, Korenberg JR, Shane B. Cloning of human cDNAs encoding mitochondrial and cytosolic serine hydroxymethyltransferases and chromosomal localization. J Biol Chem. 1993;268:11910–11916. [PubMed] [Google Scholar]
- Gilbody S, Lightfoot T, Sheldon T. Is low folate a risk factor for depression? A meta-analysis and exploration of heterogeneity. J Epidemiol Community Health. 2007;61:631–637. doi: 10.1136/jech.2006.050385. [DOI] [PMC free article] [PubMed] [Google Scholar]
- Hashimoto K, Engberg G, Shimizu E, Nordin C, Lindstrom LH, Iyo M. Reduced D-serine to total serine ratio in the cerebrospinal fluid of drug naive schizophrenic patients. Prog Neuropsychopharmacol Biol Psychiatry. 2005;29:767–769. doi: 10.1016/j.pnpbp.2005.04.023. [DOI] [PubMed] [Google Scholar]
- Hashimoto K, Fukushima T, Shimizu E, et al. Decreased serum levels of D-serine in patients with schizophrenia: evidence in support of the N-methyl-D-aspartate receptor hypofunction hypothesis of schizophrenia. Arch Gen Psychiatry. 2003;60:572–576. doi: 10.1001/archpsyc.60.6.572. [DOI] [PubMed] [Google Scholar]
- Hebbring SJ, Adjei AA, Baer JL, Jenkins GD, Zhang J, Cunningham JM, Schaid DJ, Weinshilboum RM, Thibodeau SN. Human SULT1A1 gene: copy number differences and functional implications. Hum Mol Genet. 2007;16:463–470. doi: 10.1093/hmg/ddl468. [DOI] [PubMed] [Google Scholar]
- Heil SG, Van der Put NM, Waas ET, den Heijer M, Trijbels FJ, Blom HJ. Is mutated serine hydroxymethyltransferase (SHMT) involved in the etiology of neural tube defects? Mol Genet Metab. 2001;73:164–172. doi: 10.1006/mgme.2001.3175. [DOI] [PubMed] [Google Scholar]
- Komlosi V, Hitre E, Pap E, et al. SHMT1 1420 and MTHFR 677 variants are associated with rectal but not colon cancer. BMC Cancer. 2010;10:525. doi: 10.1186/1471-2407-10-525. [DOI] [PMC free article] [PubMed] [Google Scholar]
- Li L, Fridley B, Kalari K, et al. Gemcitabine and cytosine arabinoside cytotoxicity: association with lymphoblastoid cell expression. Cancer Res. 2008;68:7050–7058. doi: 10.1158/0008-5472.CAN-08-0405. [DOI] [PMC free article] [PubMed] [Google Scholar]
- Li Y, Ding J, Abecasis GR. Mach 1.0: rapid haplotype reconstruction and missing genotype inference. Am J Hum Genet. 2006:S79. [Google Scholar]
- MacFarlane AJ, Liu X, Perry CA, Flodby P, Allen RH, Stabler SP, Stover PJ. Cytoplasmic serine hydroxymethyltransferase regulates the metabolic partitioning of methylenetetrahydrofolate but is not essential in mice. J Biol Chem. 2008;283:25846–25853. doi: 10.1074/jbc.M802671200. [DOI] [PMC free article] [PubMed] [Google Scholar]
- Miller AL. The methylation, neurotransmitter, and antioxidant connections between folate and depression. Altern Med Rev. 2008;13:216–226. [PubMed] [Google Scholar]
- Neeman G, Blanaru M, Bloch B, Kremer I, Ermilov M, Javitt DC, Heresco-Levy U. Relation of plasma glycine, serine, and homocysteine levels to schizophrenia symptoms and medication type. Am J Psychiatry. 2005;162:1738–1740. doi: 10.1176/appi.ajp.162.9.1738. [DOI] [PubMed] [Google Scholar]
- Niu N, Qin Y, Fridley BL, et al. Radiation pharmacogenomics: a genome-wide association approach to identify radiation response biomarkers using human lymphoblastoid cell lines. Genome Res. 2010;20:1482–1492. doi: 10.1101/gr.107672.110. [DOI] [PMC free article] [PubMed] [Google Scholar]
- Nordgren KK, Peng Y, Pelleymounter L, et al. Methionine adenosyltransferase 2A/2B and methylation: gene sequence variation and functional genomics. Drug Metab Dispos. 2011;39:2135–2147. doi: 10.1124/dmd.111.040857. [DOI] [PMC free article] [PubMed] [Google Scholar]
- Pfendner W, Pizer LI. The metabolism of serine and glycine in mutant lines of Chinese hamster ovary cells. Arch Biochem Biophys. 1980;200:503–512. doi: 10.1016/0003-9861(80)90382-3. [DOI] [PubMed] [Google Scholar]
- Relton CL, Wilding CS, Laffling AJ, Jonas PA, Burgess T, Binks K, Tawn EJ, Burn J. Low erythrocyte folate status and polymorphic variation in folate-related genes are associated with risk of neural tube defect pregnancy. Mol Genet Metab. 2004;81:273–281. doi: 10.1016/j.ymgme.2003.12.010. [DOI] [PubMed] [Google Scholar]
- Schell MJ. The N-methyl D-aspartate receptor glycine site and D-serine metabolism: an evolutionary perspective. Philos Trans R Soc Lond B Biol Sci. 2004;359:943–964. doi: 10.1098/rstb.2003.1399. [DOI] [PMC free article] [PubMed] [Google Scholar]
- Schirch V, Szebenyi DM. Serine hydroxymethyltransferase revisited. Curr Opin Chem Biol. 2005;9:482–487. doi: 10.1016/j.cbpa.2005.08.017. [DOI] [PubMed] [Google Scholar]
- Stover PJ, Chen LH, Suh JR, Stover DM, Keyomarsi K, Shane B. Molecular cloning, characterization, and regulation of the human mitochondrial serine hydroxymethyltransferase gene. J Biol Chem. 1997;272:1842–1848. doi: 10.1074/jbc.272.3.1842. [DOI] [PubMed] [Google Scholar]
- Stranger BE, Nica AC, Forrest MS, et al. Population genomics of human gene expression. Nat Genet. 2007;39:1217–1224. doi: 10.1038/ng2142. [DOI] [PMC free article] [PubMed] [Google Scholar]
- Sumiyoshi T, Anil AE, Jin D, Jayathilake K, Lee M, Meltzer HY. Plasma glycine and serine levels in schizophrenia compared to normal controls and major depression: relation to negative symptoms. Int J Neuropsychopharmacol. 2004;7:1–8. doi: 10.1017/S1461145703003900. [DOI] [PubMed] [Google Scholar]
- Taylor RT, Weissback H. Radioactive assay for serine transhydroxymethylase. Anal Biochem. 1965;13:80–84. [Google Scholar]
- The 1000 Genomes Project Consortium. A map of human genome variation from population-scale sequencing. Nature. 2010;467:1061–1073. doi: 10.1038/nature09534. [DOI] [PMC free article] [PubMed] [Google Scholar]
- Vijayakrishnan J, Houlston RS. Candidate gene association studies and risk of childhood acute lymphoblastic leukemia: a systematic review and meta-analysis. Haematologica. 2010;95:1405–1414. doi: 10.3324/haematol.2010.022095. [DOI] [PMC free article] [PubMed] [Google Scholar]
- Zeller T, Wild P, Szymczak S, et al. Genetics and beyond--the transcriptome of human monocytes and disease susceptibility. PLoS One. 2010;5:e10693. doi: 10.1371/journal.pone.0010693. [DOI] [PMC free article] [PubMed] [Google Scholar]
- Zhang J, Ji Y, Moon I, et al. Catechol O-methyltransferase pharmacogenomics: human liver genotype-phenotype correlation and proximal promoter studies. Pharmacogenet Genomics. 2009;19:577–587. doi: 10.1097/FPC.0b013e32832c15c6. [DOI] [PMC free article] [PubMed] [Google Scholar]
- Zhang Y, Sun K, Roje S. An HPLC-based fluorometric assay for serine hydroxymethyltransferase. Anal Biochem. 2008;375:367–369. doi: 10.1016/j.ab.2007.12.015. [DOI] [PubMed] [Google Scholar]
Associated Data
This section collects any data citations, data availability statements, or supplementary materials included in this article.


