

Abstract
Objective
Leptin is anorexigenic, and levels are markedly decreased in women with low body weight and high in obesity. Ghrelin opposes leptin effects on appetite and is negatively associated with body mass index. These appetite regulating hormones may have opposing effects on mood and stress pathways. Women with anorexia nervosa (AN), hypothalamic amenorrhea (HA) and obesity are at increased risk of depression and anxiety. It is unknown whether dysregulation of leptin or ghrelin contribute to the development of depression and/or anxiety in these disorders. We investigated the relationship between leptin and ghrelin levels and symptoms of depression, anxiety and perceived stress in women across the weight spectrum.
Design
Cross-sectional.
Patients
64 women: 15 with AN, 12 normal-weight with HA, 17 overweight or obese (OB), and 20 normal-weight in good health (HC).
Measurements
Fasting serum leptin and plasma ghrelin levels were measured. Hamilton Rating Scales for Depression (HAM-D) and Anxiety (HAM-A) and the Perceived Stress Scale were administered.
Results
Leptin levels were inversely associated with HAM-D, HAM-A, and Perceived Stress scores. The negative relationships between leptin and severity of symptoms of both depression and anxiety remained significant after controlling for body fat or weight. There was no relationship between ghrelin and symptoms of depression or anxiety. Although ghrelin levels were positively associated with the degree of perceived stress, this relationship was not significant after controlling for body fat or weight.
Conclusions
Leptin may mediate depressive symptoms across the weight spectrum. Further investigation of the role of leptin in modulating mood will be important.
Keywords: Anorexia Nervosa, Hypothalamic Amenorrhea, Obesity, Leptin, Depression
Introduction
Levels of leptin, a fat-derived hormone that signals satiety, are markedly decreased in women with low body mass index and high in obesity 1, while levels of ghrelin, an orexigenic hormone produced in the stomach, are negatively associated with weight and body fat 2. In addition to hypothalamic satiety centers, receptors for leptin and ghrelin have been identified in limbic areas of the brain that regulate emotion. Recent data suggest that leptin may have antidepressant and anxiolytic properties. In rat models of depression, leptin levels are low and both peripheral and hippocampal administration of leptin improve symptoms 3. In mice, intraperitoneal administration of leptin ameliorates experimentally induced anxiety-like behaviors 4. In contrast, acute stress increases ghrelin secretion in rats, and central administration of ghrelin results in anxiety and depression-like behaviors 5-9.
Depression and anxiety are common in women with anorexia nervosa (AN) 10-13, an illness associated with low weight, body fat and leptin levels 14 and increased secretion of ghrelin 15, 16. Similarly, there is an increased prevalence of depression and anxiety in normal-weight women with functional hypothalamic amenorrhea (HA) 17, a disorder also characterized by hypoleptinemia 18, 19 and high ghrelin levels 20. Recently, obesity has been linked to increased risk of depression and anxiety 21, 22. It is unknown whether low leptin levels or increased ghrelin secretion contribute to the development of depressive or anxiety disorders in these populations. We performed a cross-sectional study to investigate the relationship between levels of leptin and ghrelin and symptoms of depression and anxiety in these women.
Subject and Methods
Subjects
We studied 64 women: 15 with anorexia nervosa (AN), 12 normal-weight with hypothalamic amenorrhea (HA), 17 overweight or obese (OB), and 20 normal-weight in good health (HC). All subjects were recruited from the community through advertisements and referrals from healthcare providers. Subject characteristics, hormone levels, and in AN, HA and HC, HAM-D and HAM-A scores have been previously reported 23-25. However, the relationships between levels of leptin and ghrelin and HAM-D, HAM-A and Perceived Stress scores have not been described.
Subjects with AN met DSM-IV criteria, including intense fear of gaining weight, body image disturbance, weight less than 85% of ideal body weight (IBW) as determined by the 1983 Metropolitan Life tables 26, and amenorrhea for at least three consecutive months.
HA were 90 to 110% of IBW with a BMI less than 25 and reported amenorrhea for at least three consecutive months. Exclusion criteria included polycystic ovarian syndrome, hyperprolactinemia, premature ovarian failure, and history of anorexia nervosa.
OB had a BMI of 25 to 40 and reported regular menstrual periods. OB reported no significant medical problems or history of amenorrhea, disordered eating, or significant anxiety or depression.
HC were at least 90% of IBW with a BMI less than 25 and reported regular menstrual cycles. HC reported no significant medical problems or history of amenorrhea, disordered eating, or significant anxiety or depression.
All subjects had normal thyroid function tests. Subjects were excluded if they had diabetes mellitus. Additional exclusion criteria included active abuse of drugs or alcohol, use of estrogen, use of depot medroxyprogesterone within six months, and pregnancy or breastfeeding within six months of the study.
Methods
This study was approved by the Institutional Review Boards of Partners Health Care, Inc. Written informed consent was obtained from all subjects prior to any procedures. All subjects were admitted to the Clinical Research Center of Massachusetts General Hospital for a screening visit and a main study visit.
At the screening visit, height, weight and elbow breadth were measured by research dietitians, blood was drawn for screening laboratory tests, and a comprehensive history and physical exam were performed. Exercise patterns and alcohol intake were assessed. Percent ideal body weight was calculated as described above. Body mass index was obtained by dividing the weight in kilograms by the square of height in meters. Frame size was determined by comparing elbow breadth to race-specific norms derived from the US Health and Nutritional Examination Survey-I 26.
During the main study visit, % IBW and BMI were reevaluated. Medical history and physical exam were performed. HAM-D and HAM-A assessments were administered by trained study personnel, and the Perceived Stress Scale was self-administered. Body composition was assessed by dual-energy X-ray absorptiometry (Hologic 4500, Hologic, Inc., Waltham, MA). This technique has a precision of 3% for fat mass 27. Fasting leptin and ghrelin levels were obtained at 7:45 am. HC and OB presented for this visit during the follicular phase of the menstrual cycle.
Psychological Measures
The HAM-D is a well-validated, 17-item semi-structured interview that is widely used to measure depressive symptoms in clinical trials and has excellent internal reliability 28. The HAM-A is a 14-item semi-structured interview with excellent validity and reliability, widely used in clinical trials to assess severity of anxiety symptoms 29. The Perceived Stress Scale is a validated, reliable 10-item self-administered instrument to assess the level of experienced stress 30. On all of the psychological measures, higher scores indicate increased symptomatology.
Biochemical Analysis
Serum and plasma samples were stored at -80° C until analysis. Serum leptin levels were measured using a radioimmunoassay (RIA) kit from LINCO Research, a division of Millipore Inc. (St. Charles, MO). The intra-assay CV ranged from 3.4% to 8.3% and the inter-assay CV ranged from 3.6% to 6.3%. The sensitivity was 0.5 ng/mL. Plasma ghrelin levels were measured using an RIA kit from LINCO research, a division of Millipore Inc. The intra-assay CV ranged from 10.0% to 14.4% and the inter-assay CV ranged from 14.7% to 16.7%. The sensitivity was 93 pg/mL.
Data Analysis
JMP Statistical Discoveries (version 5.01; SAS Institute, Inc., Cary, NC) was used for statistical analyses. The log or square root was taken for variables that were not normally distributed. Clinical characteristics, hormone levels, and psychiatric measures were compared using analysis of variance; variables that were significantly different were then compared by Fisher’s Least Significant Difference Test. Multiple comparisons were controlled for using Tukey-Kramer. Linear regression analyses were used to investigate the associations between hormone levels and body composition and psychiatric measures. Multivariate least-square analyses were constructed to control for potential confounders. Stepwise regression analyses were performed to further investigate determinants of psychiatric symptoms. Statistical significance was defined as a two-tailed P-value < 0.05. Data are reported as mean ± SEM.
Results
Subject Characteristics
Subject characteristics are presented in Table 1. The mean age was 27.7±0.9 yrs and did not differ between groups. As expected, mean weight, BMI, %IBW and %fat were lowest in AN, intermediate in HA and HC, and highest in OB. The total months of amenorrhea did not differ between HA and AN. Two subjects with AN reported current depression, three reported anxiety and four reported both depression and anxiety. One subject with HA reported current depression, one reported anxiety, and one reported both anxiety and depression. Three subjects with AN were taking psychiatric medications: one was taking sertraline; one was taking bupropion, clonazepam, buspirone, and topiramate; and one was taking fluoxetine. One subject with HA was taking psychiatric medications (escitalopram, bupropion). By design, HC and OB did not have any psychiatric diagnoses and were not taking psychiatric medications.
Table 1.
Clinical characteristics, psychiatric measures and hormone levels
| AN | HA | OB | HC | |
|---|---|---|---|---|
| N=15 | N=12 | N=17 | N=20 | |
| Clinical Characteristics | ||||
| Age (years) | 26.1±1.6 | 27.3±1.8 | 29.9±2.0 | 27.4±1.6 |
| Weight (kg) | 51.4±1.3c,d | 58.9±1.8c | 85.8±4.0a,b,d | 61.2±1.4a,c |
| Body mass index (kg/m2) | 18.3±0.3b,c,d | 20.9±0.4a,c | 31.1±1.1a,b,d | 22.3±0.3a,c |
| Ideal body weight (%) | 79.6±0.8b,c,d | 92.9±1.4a,c | 131.0±4.3a,b,d | 98.3±1.5a,c |
| Total body fat (g) | 9.2±0.6c,d | 14.2±0.7c | 32.6±2.5a,b,d | 16.8±0.8a,c |
| Body fat (%) | 17.4±0.9b,c,d | 23.6±0.8a,c | 36.9±1.2a,b,d | 26.7±1.1a,c |
| Age of menarche | 13.1±0.4 | 12.9±0.3 | 12.3±0.4 | 12.8±0.3 |
| Months of amenorrhea | 66.2±17.2c,d | 34.9±9.6c,d | 0a,b | 0a,b |
| Psychiatric Measures | ||||
| HAM-D* | 13.5±1.4b,c,d | 6.9±1.2a,c,d | 3.2±0.8a,b,d | 1.1±0.4a,b,c |
| HAM-A** | 11.4±1.5b,c,d | 7.8±1.1a,c,d | 3.5±0.8a,b,d | 1.5±0.5a,b,c |
| Perceived Stress Scale*** | 19.9±1.4c,d | 14.5±1.6d | 9.7±1.2a | 7.2±1.6a,b |
| Hormone Levels | ||||
| Leptin (ng/ml) | 2.8±0.5b,c,d | 6.3±0.8a,c | 23.8±2.8a,b,d | 8.8±0.7a,c |
| Ghrelin (pg/ml) | 1132±106c | 1004 ±88c | 528±48 a,b,d | 1057±108c |
Means±SEM. NS, non-significant. After correcting for multiple comparisons, p<0.05 vs.
AN,
HA,
OB,
HC.
Normal range:
HAM-D (Hamilton Rating Scale for Depression)<8,
HAM-A (Hamilton Rating Scale for Anxiety)<18,
Perceived Stress Scale <27.
AN, subjects with anorexia nervosa; HA, subjects with hypothalamic amenorrhea; OB, overweight or obese controls; HC, normal-weight healthy controls.
Psychological Measures and Hormone Levels
Results of psychiatric testing and hormone levels are presented in Table 1. Mean HAM-D and HAM-A scores were increased in AN compared to the other groups, and higher in HA than both OB and HC. Mean Perceived Stress scores were higher in both AN and HA than HC. Scores were considered normal if they were below eight on the HAM-D 31 or below 18 on the HAM-A. For the Perceived Stress Scale, where there is no widely accepted cutoff, we considered scores below 27 to be normal based on normative data in women (within 2 SD of the mean) 30. HAM-D scores were abnormal in 87% of AN, 33% of HA, 12% of OB and 0% of HC. HAM-A scores were in the normal range in all subjects other than two AN. Perceived Stress scores were normal in all but one AN and one HA. Mean leptin levels were lowest in AN, higher in HC than HA, and highest in OB. Mean ghrelin levels were lower in OB than the other groups.
Associations: Hormone Levels and Psychological Measures
Associations between hormone levels and psychiatric measures are presented in Table 2. Leptin levels were inversely associated with HAM-D, HAM-A and Perceived Stress Scale scores (Figure 1). The relationships between leptin and severity of symptoms of both depression and anxiety were independent of body fat or weight. Mean leptin levels were lower in those subjects who had abnormal HAM-D scores than those with normal scores. This difference remained significant after controlling for fat mass or weight.
Table 2.
Relationship between hormones and psychiatric measures
| Leptin | Ghrelin | |||
|---|---|---|---|---|
| r | p-value | r | p-value | |
| HAM-D | -0.43 | 0.0004* | 0.18 | NS |
| HAM-A | -0.34 | 0.006* | 0.16 | NS |
| Perceived Stress Scale | -0.35 | 0.007 | 0.27 | 0.046 |
p≤0.05 after controlling for total body fat or weight.
HAM-D, Hamilton Rating Scale for Depression; HAM-A, Hamilton Rating Scale for Anxiety.
Figure 1.
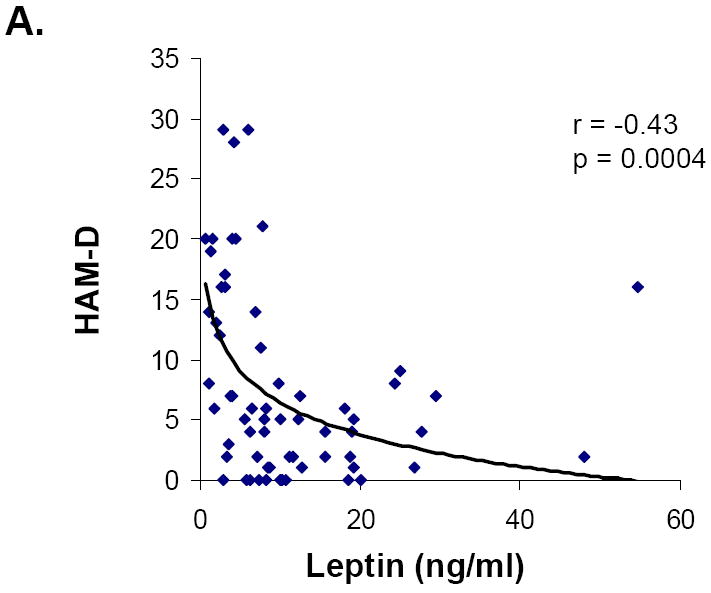
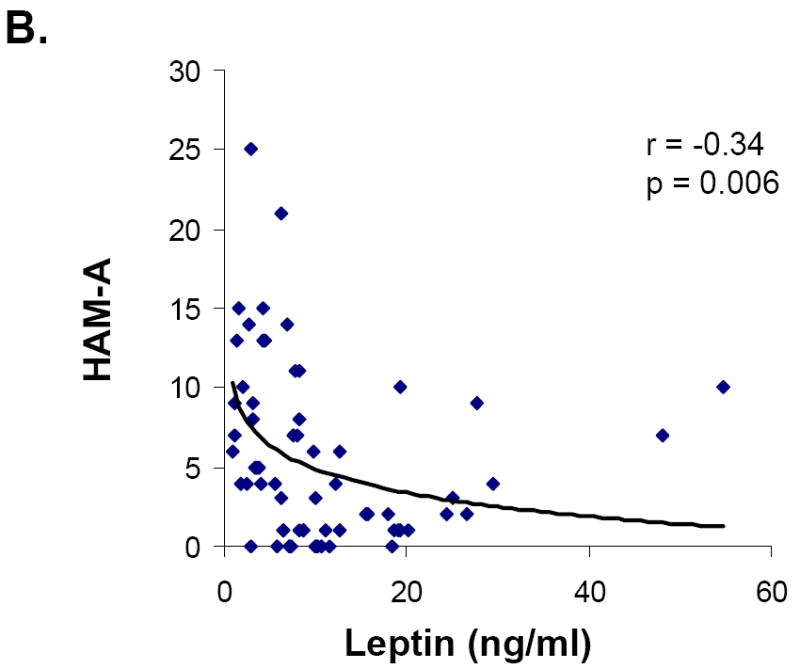
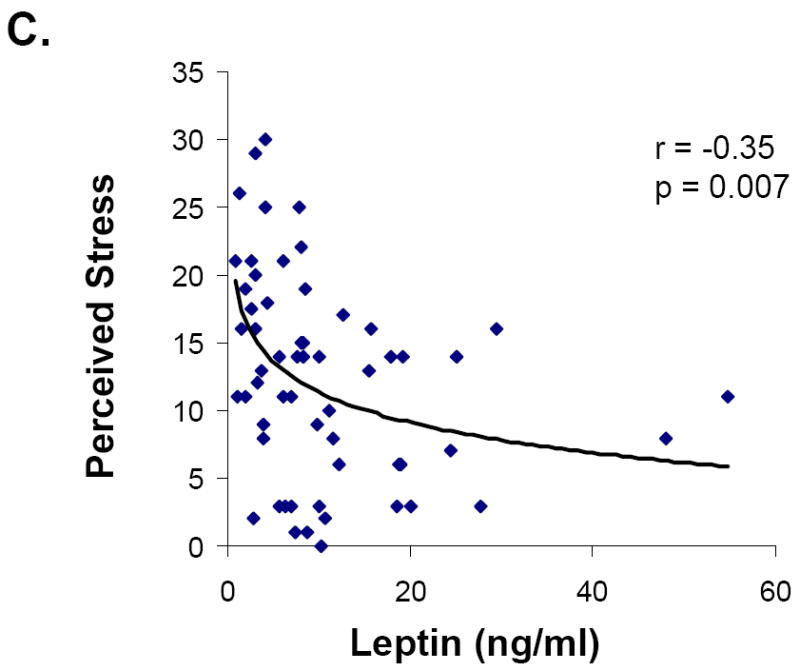
Relationship between leptin and symptoms of depression, anxiety and perceived stress in all groups. Leptin levels were inversely associated with HAM-D (A), HAM-A (B), and Perceived Stress (C) scores.
Ghrelin levels were positively associated with perceived stress, but were not associated with symptoms of depression or anxiety. After controlling for body fat or weight, the relationship between ghrelin and perceived stress was not significant. Mean ghrelin levels were higher in those subjects who had abnormal HAM-D scores. However, this difference was no longer significant after controlling for fat mass or weight.
We entered leptin, ghrelin and fat mass into a stepwise regression model. Leptin explained 19% of the variance in HAM-D (p=0.0005), 11% of the variance in HAM-A (p=0.008), and 13% of the variance in Perceived Stress (p=0.007) scores. Results were similar when we substituted weight for fat mass in the model: leptin explained 16%, 10% and 12% of the variance in HAM-D, HAM-A and Perceived Stress, respectively.
Discussion
We show that across the weight spectrum, low leptin levels are associated with increased symptoms of depression, independent of body fat or weight. Furthermore, those subjects who had depression based on HAM-D scores had lower levels of leptin than those without depression; this between-group difference remained significant after controlling for fat mass or weight.
In rat models of depression, leptin levels are low and both peripheral and hippocampal administration of leptin improve symptoms 3, 32. Ob/Ob leptin-deficient mice display increased anxiety behaviors 33. Intraperitoneal administration of leptin to mice ameliorates experimentally induced anxiety-like behaviors 4. Although the neural pathways have not been clearly defined, leptin may modulate emotion directly via receptors in limbic areas of the brain. A recent study in mice demonstrated that leptin reduces depressive behaviors through upregulation of brain-derived neurotrophic factor in the hippocampus 32. An alternate mechanism for the anxiolytic, but not the antidepressant effects of leptin via inhibition of dopaminergic midbrain neurons has been demonstrated in mice 34. In humans, the relationship between leptin secretion and depression is controversial 35-40 and there is a lack of data in anxiety. Our findings of an inverse relationship between leptin and symptoms of depression, as well as decreased levels of leptin in subjects with depression, independent of body fat or weight, are consistent with animal literature suggesting that leptin has antidepressant effects. We also report an association between low levels of leptin and increased symptoms of anxiety, independent of fat mass or weight. While this relationship is consistent with data implicating leptin as an anxiolytic hormone, most of the subjects had anxiety scores within the normal range. The negative correlation between leptin and perceived stress also supports the concept of leptin as an anti-stress hormone, though this relationship was no longer significant after controlling for fat mass or weight. In stepwise regression models, leptin but not ghrelin, fat mass, or weight, was a significant predictor of the variance in depressive symptoms.
As expected based on the literature, our sample of overweight and obese women demonstrated increased symptoms of depression compared to healthy lean women despite higher leptin levels. This is consistent with the well-characterized “leptin resistant” state in obesity. A study of mice by Yamada et al. demonstrated that similar to appetite effects, leptin-mediated antidepressive effects are lost in diet-induced obesity. However, following institution of a normal diet and subsequent weight loss, leptin is an effective antidepressant 32. Taken together, these data suggest that leptin is unlikely to improve depressive symptoms in obese women.
Asakawa et al. first demonstrated in rats that ghrelin expression increased in the setting of stress, and that administration of ghrelin had an anxiogenic effect 9. Others have confirmed that central ghrelin administration increases anxiety-like behaviors and also depressive-like behaviors in rats 6, 8. Interestingly, there is evidence that orexigenic properties of ghrelin may be mediated through serotoninergic pathways. In rats, ghrelin inhibits hypothalamic serotonin release, and peripheral administration of an SSRI blocks ghrelin-mediated increases in food intake 41, 42. It is possible, therefore, that ghrelin modulates emotion through inhibition of central serotonin release. Ghrelin also activates the hypothalamic-pituitary-adrenal axis 41, which may promote symptoms of anxiety and depression. Several studies of humans suggest that ghrelin secretion is not altered in depression 43-45, and there is no data on ghrelin in anxiety. We found that in women with depression based on HAM-D scores, ghrelin levels were increased. However, this relationship was no longer significant after controlling for body fat or weight. There was no association between ghrelin levels and symptoms of depression or anxiety. Higher ghrelin was associated with greater perceived stress, but this was also dependent on body fat and weight. Overall, our data on the relationship between ghrelin and psychiatric symptomatology were less convincing than our findings regarding leptin.
Our study has several limitations. This is a cross-sectional investigation, and therefore causality cannot be determined. Sample sizes of the individual groups were small. In addition, we measured total ghrelin, not active ghrelin, which is unstable and requires special collection and handling 46. It is possible that we would have seen more robust relationships between ghrelin and measures of psychiatric symptomatology if we had assayed the active form of ghrelin. Psychiatric disease was part of the exclusion criteria for normal- and overweight/obese healthy subjects. Therefore, the symptoms of depression and anxiety in our sample were less than one would expect in the general population.
In summary, we show that low leptin levels are associated with increased symptoms of depression in women across the weight spectrum. Subjects with abnormal depression scores had lower levels of leptin than those with normal depression scores. Both of these findings were independent of body fat or weight. We also demonstrate an inverse relationship between leptin and anxiety symptoms, independent of body fat and weight, though most scores were in the normal range. These data support animal studies implicating leptin as a neurotrophic hormone with antidepressant and anxiolytic effects. Further investigation administering leptin to humans will be important in determining whether this hormone has a potential role in treatment of depression and/or anxiety.
Acknowledgments
We thank the nurses and bionutritionists in the Massachusetts General Hospital Clinical Research Center and the subjects who participated in the study.
This work was supported in part by the following grants: Investigator-initiated grant from Bioenvision. NIH: M01 RR01066 and UL1 RR025758.
EA Lawson was funded by the Harvard K12 HD0519599 Building Interdisciplinary Research Careers in Women’s Health (BIRCWH) Program supported by NIH Office of Research in Women’s Health (ORWH).
Footnotes
The authors have no conflicts to declare.
References
- 1.Jequier E. Leptin signaling, adiposity, and energy balance. Ann N Y Acad Sci. 2002;967:379–388. doi: 10.1111/j.1749-6632.2002.tb04293.x. [DOI] [PubMed] [Google Scholar]
- 2.Tschop M, Weyer C, Tataranni PA, Devanarayan V, Ravussin E, Heiman ML. Circulating Ghrelin Levels Are Decreased in Human Obesity. Diabetes. 2001;50:707–709. doi: 10.2337/diabetes.50.4.707. [DOI] [PubMed] [Google Scholar]
- 3.Lu XY, Kim CS, Frazer A, Zhang W. Leptin: a potential novel antidepressant. Proc Natl Acad Sci U S A. 2006;103:1593–1598. doi: 10.1073/pnas.0508901103. [DOI] [PMC free article] [PubMed] [Google Scholar]
- 4.Liu J, Garza JC, Bronner J, Kim CS, Zhang W, Lu XY. Acute administration of leptin produces anxiolytic-like effects: a comparison with fluoxetine. Psychopharmacology (Berl) 2010;207:535–545. doi: 10.1007/s00213-009-1684-3. [DOI] [PMC free article] [PubMed] [Google Scholar]
- 5.Kristenssson E, Sundqvist M, Astin M, Kjerling M, Mattsson H, Dornonville de la Cour C, Håkanson R, Lindström E. Acute psychological stress raises plasma ghrelin in the rat. Regulatory Peptides. 2006;134:114–117. doi: 10.1016/j.regpep.2006.02.003. [DOI] [PubMed] [Google Scholar]
- 6.Hansson C, Haage D, Taube M, Egecioglu E, Salomé N, Dickson SL. Central administration of ghrelin alters emotional responses in rats: behavioural, electrophysiological and molecular evidence. Neuroscience. 2011;180:201–211. doi: 10.1016/j.neuroscience.2011.02.002. [DOI] [PubMed] [Google Scholar]
- 7.Carlini VP, Varas MM, Cragnolini AB, Schiöth HB, Scimonelli TN, de Barioglio SR. Differential role of the hippocampus, amygdala, and dorsal raphe nucleus in regulating feeding, memory, and anxiety-like behavioral responses to ghrelin. Biochemical and Biophysical Research Communications. 2004;313:635–641. doi: 10.1016/j.bbrc.2003.11.150. [DOI] [PubMed] [Google Scholar]
- 8.Carlini VP, Monzón ME, Varas MM, Cragnolini AB, Schiöth HB, Scimonelli TN, de Barioglio SR. Ghrelin increases anxiety-like behavior and memory retention in rats. Biochemical and Biophysical Research Communications. 2002;299:739–743. doi: 10.1016/s0006-291x(02)02740-7. [DOI] [PubMed] [Google Scholar]
- 9.Asakawa A, Inui A, Kaga T, Yuzuriha H, Nagata T, Fujimiya M, Katsuura G, Makino S, Fujino MA, Kasuga M. A role of ghrelin in neuroendocrine and behavioral responses to stress in mice. Neuroendocrinology. 2001;74:143–147. doi: 10.1159/000054680. [DOI] [PubMed] [Google Scholar]
- 10.Herzog DB, Keller MB, Sacks NR, Yeh CJ, Lavori PW. Psychiatric comorbidity in treatment-seeking anorexics and bulimics. J Am Acad Child Adolesc Psychiatry. 1992;31:810–818. doi: 10.1097/00004583-199209000-00006. [DOI] [PubMed] [Google Scholar]
- 11.Braun DL, Sunday SR, Halmi KA. Psychiatric comorbidity in patients with eating disorders. Psychol Med. 1994;24:859–867. doi: 10.1017/s0033291700028956. [DOI] [PubMed] [Google Scholar]
- 12.Pollice C, Kaye WH, Greeno CG, Weltzin TE. Relationship of depression, anxiety, and obsessionality to state of illness in anorexia nervosa. Int J Eat Disord. 1997;21:367–376. doi: 10.1002/(sici)1098-108x(1997)21:4<367::aid-eat10>3.0.co;2-w. [DOI] [PubMed] [Google Scholar]
- 13.Kaye WH, Bulik CM, Thornton L, Barbarich N, Masters K. Comorbidity of anxiety disorders with anorexia and bulimia nervosa. Am J Psychiatry. 2004;161:2215–2221. doi: 10.1176/appi.ajp.161.12.2215. [DOI] [PubMed] [Google Scholar]
- 14.Grinspoon S, Gulick T, Askari H, Landt M, Lee K, Anderson E, Ma Z, Vignati L, Bowsher R, Herzog D, Klibanski A. Serum leptin levels in women with anorexia nervosa. J Clin Endocrinol Metab. 1996;81:3861–3863. doi: 10.1210/jcem.81.11.8923829. [DOI] [PubMed] [Google Scholar]
- 15.Nakahara T, Kojima S, Tanaka M, Yasuhara D, Harada T, Sagiyama K, Muranaga T, Nagai N, Nakazato M, Nozoe S, Naruo T, Inui A. Incomplete restoration of the secretion of ghrelin and PYY compared to insulin after food ingestion following weight gain in anorexia nervosa. J Psychiatr Res. 2007;41:814–820. doi: 10.1016/j.jpsychires.2006.07.021. [DOI] [PubMed] [Google Scholar]
- 16.Misra M, Miller KK, Kuo K, Griffin K, Stewart V, Hunter E, Herzog DB, Klibanski A. Secretory dynamics of ghrelin in adolescent girls with anorexia nervosa and healthy adolescents. Am J Physiol Endocrinol Metab. 2005;289:E347–356. doi: 10.1152/ajpendo.00615.2004. [DOI] [PubMed] [Google Scholar]
- 17.Fava GA, Trombini G, Grandi S, Bernardi M, Evangelisti LP, Santarsiero G, Orlandi C. Depression and anxiety associated with secondary amenorrhea. Psychosomatics. 1984;25:905–908. doi: 10.1016/S0033-3182(84)72922-7. [DOI] [PubMed] [Google Scholar]
- 18.Warren MP, Voussoughian F, Geer EB, Hyle EP, Adberg CL, Ramos RH. Functional hypothalamic amenorrhea: hypoleptinemia and disordered eating. J Clin Endocrinol Metab. 1999;84:873–877. doi: 10.1210/jcem.84.3.5551. [DOI] [PubMed] [Google Scholar]
- 19.Miller KK, Parulekar MS, Schoenfeld E, Anderson E, Hubbard J, Klibanski A, Grinspoon SK. Decreased leptin levels in normal weight women with hypothalamic amenorrhea: the effects of body composition and nutritional intake. J Clin Endocrinol Metab. 1998;83:2309–2312. doi: 10.1210/jcem.83.7.4975. [DOI] [PubMed] [Google Scholar]
- 20.Schneider LF, Monaco SE, Warren MP. Elevated ghrelin level in women of normal weight with amenorrhea is related to disordered eating. Fertil Steril. 2008;90:121–128. doi: 10.1016/j.fertnstert.2007.06.002. [DOI] [PubMed] [Google Scholar]
- 21.Gariepy G, Nitka D, Schmitz N. The association between obesity and anxiety disorders in the population: a systematic review and meta-analysis. Int J Obes (Lond) 2010;34:407–419. doi: 10.1038/ijo.2009.252. [DOI] [PubMed] [Google Scholar]
- 22.Luppino FS, de Wit LM, Bouvy PF, Stijnen T, Cuijpers P, Penninx BW, Zitman FG. Overweight, obesity, and depression: a systematic review and meta-analysis of longitudinal studies. Arch Gen Psychiatry. 2010;67:220–229. doi: 10.1001/archgenpsychiatry.2010.2. [DOI] [PubMed] [Google Scholar]
- 23.Lawson EA, Donoho D, Miller KK, Misra M, Meenaghan E, Lydecker J, Wexler T, Herzog DB, Klibanski A. Hypercortisolemia is associated with severity of bone loss and depression in hypothalamic amenorrhea and anorexia nervosa. J Clin Endocrinol Metab. 2009;94:4710–4716. doi: 10.1210/jc.2009-1046. [DOI] [PMC free article] [PubMed] [Google Scholar]
- 24.Lawson EA, Eddy KT, Donoho D, Misra M, Miller KK, Meenaghan E, Lydecker J, Herzog D, Klibanski A. Appetite-regulating hormones cortisol and peptide YY are associated with disordered eating psychopathology, independent of body mass index. Eur J Endocrinol. 2011;164:253–261. doi: 10.1530/EJE-10-0523. [DOI] [PMC free article] [PubMed] [Google Scholar]
- 25.Lawson EA, Donoho D, Blum J, Meenaghan E, Misra M, Herzog D, Sluss P, Miller KK, Klibanski A. Decreased Nocturnal Oxytocin Levels in Anorexia Nervosa Are Associated with Low Bone Mineral Density and Fat Mass. Journal of Clinical Psychiatry. 2011 doi: 10.4088/JCP.10m06617. In Press. [DOI] [PMC free article] [PubMed] [Google Scholar]
- 26.Frisancho AR, Flegel PN. Elbow breadth as a measure of frame size for US males and females. Am J Clin Nutr. 1983;37:311–314. doi: 10.1093/ajcn/37.2.311. [DOI] [PubMed] [Google Scholar]
- 27.Mazess RB, Barden HS, Bisek JP, Hanson J. Dual-energy x-ray absorptiometry for total-body and regional bone-mineral and soft-tissue composition. Am J Clin Nutr. 1990;51:1106–1112. doi: 10.1093/ajcn/51.6.1106. [DOI] [PubMed] [Google Scholar]
- 28.Hamilton M. A rating scale for depression. J Neurol Neurosurg Psychiatry. 1960;23:56–62. doi: 10.1136/jnnp.23.1.56. [DOI] [PMC free article] [PubMed] [Google Scholar]
- 29.Hamilton M. The assessment of anxiety states by rating. Br J Med Psychol. 1959;32:50–55. doi: 10.1111/j.2044-8341.1959.tb00467.x. [DOI] [PubMed] [Google Scholar]
- 30.Cohen S, Williamson GM. Perceived Stress in a Probability Sample of the United States. In: Spacapan S, Oskamp S, editors. The Social Psychology of Health. Newbury Park, CA: 1988. pp. 31–67. [Google Scholar]
- 31.Zimmerman M, Chelminski I, Posternak M. A review of studies of the Hamilton depression rating scale in healthy controls: implications for the definition of remission in treatment studies of depression. J Nerv Ment Dis. 2004;192:595–601. doi: 10.1097/01.nmd.0000138226.22761.39. [DOI] [PubMed] [Google Scholar]
- 32.Yamada N, Katsuura G, Ochi Y, Ebihara K, Kusakabe T, Hosoda K, Nakao K. Impaired CNS Leptin Action Is Implicated in Depression Associated with Obesity. Endocrinology. 2011 doi: 10.1210/en.2011-0004. [DOI] [PubMed] [Google Scholar]
- 33.Finger BC, Dinan TG, Cryan JF. Leptin-deficient mice retain normal appetitive spatial learning yet exhibit marked increases in anxiety-related behaviours. Psychopharmacology (Berl) 2010;210:559–568. doi: 10.1007/s00213-010-1858-z. [DOI] [PubMed] [Google Scholar]
- 34.Liu J, Perez SM, Zhang W, Lodge DJ, Lu XY. Selective deletion of the leptin receptor in dopamine neurons produces anxiogenic-like behavior and increases dopaminergic activity in amygdala. Mol Psychiatry. 2011 doi: 10.1038/mp.2011.36. [DOI] [PMC free article] [PubMed] [Google Scholar]
- 35.Kauffman RP, Castracane VD, White DL, Baldock SD, Owens R. Impact of the selective serotonin reuptake inhibitor citalopram on insulin sensitivity, leptin and basal cortisol secretion in depressed and non-depressed euglycemic women of reproductive age. Gynecol Endocrinol. 2005;21:129–137. doi: 10.1080/09513590500216800. [DOI] [PubMed] [Google Scholar]
- 36.Kraus T, Haack M, Schuld A, Hinze-Selch D, Pollmacher T. Low leptin levels but normal body mass indices in patients with depression or schizophrenia. Neuroendocrinology. 2001;73:243–247. doi: 10.1159/000054641. [DOI] [PubMed] [Google Scholar]
- 37.Jow GM, Yang TT, Chen CL. Leptin and cholesterol levels are low in major depressive disorder, but high in schizophrenia. J Affect Disord. 2006;90:21–27. doi: 10.1016/j.jad.2005.09.015. [DOI] [PubMed] [Google Scholar]
- 38.Yang K, Xie G, Zhang Z, Wang C, Li W, Zhou W, Tang Y. Levels of serum interleukin (IL)-6, IL-1beta, tumour necrosis factor-alpha and leptin and their correlation in depression. Aust N Z J Psychiatry. 2007;41:266–273. doi: 10.1080/00048670601057759. [DOI] [PubMed] [Google Scholar]
- 39.Antonijevic IA, Murck H, Frieboes RM, Horn R, Brabant G, Steiger A. Elevated nocturnal profiles of serum leptin in patients with depression. J Psychiatr Res. 1998;32:403–410. doi: 10.1016/s0022-3956(98)00032-6. [DOI] [PubMed] [Google Scholar]
- 40.Pasco JA, Jacka FN, Williams LJ, Henry MJ, Nicholson GC, Kotowicz MA, Berk M. Leptin in depressed women: cross-sectional and longitudinal data from an epidemiologic study. J Affect Disord. 2008;107:221–225. doi: 10.1016/j.jad.2007.07.024. [DOI] [PubMed] [Google Scholar]
- 41.Brunetti L, Recinella L, Orlando G, Michelotto B, Di Nisio C, Vacca M. Effects of ghrelin and amylin on dopamine, norepinephrine and serotonin release in the hypothalamus. Eur J Pharmacol. 2002;454:189–192. doi: 10.1016/s0014-2999(02)02552-9. [DOI] [PubMed] [Google Scholar]
- 42.Carlini VP, Gaydou RC, Schioth HB, de Barioglio SR. Selective serotonin reuptake inhibitor (fluoxetine) decreases the effects of ghrelin on memory retention and food intake. Regul Pept. 2007;140:65–73. doi: 10.1016/j.regpep.2006.11.012. [DOI] [PubMed] [Google Scholar]
- 43.Schanze A, Reulbach U, Scheuchenzuber M, Groschl M, Kornhuber J, Kraus T. Ghrelin and eating disturbances in psychiatric disorders. Neuropsychobiology. 2008;57:126–130. doi: 10.1159/000138915. [DOI] [PubMed] [Google Scholar]
- 44.Kluge M, Schussler P, Schmid D, Uhr M, Kleyer S, Yassouridis A, Steiger A. Ghrelin plasma levels are not altered in major depression. Neuropsychobiology. 2009;59:199–204. doi: 10.1159/000223731. [DOI] [PubMed] [Google Scholar]
- 45.Olszanecka-Glinianowicz M, Kocelak P, Wikarek T, Gruszka W, Dabrowski P, Chudek J, Zahorska-Markiewicz B. Are plasma ghrelin and PYY concentrations associated with obesity-related depression? Endokrynol Pol. 2010;61:174–177. [PubMed] [Google Scholar]
- 46.Hosoda H, Doi K, Nagaya N, Okumura H, Nakagawa E, Enomoto M, Ono F, Kangawa K. Optimum collection and storage conditions for ghrelin measurements: octanoyl modification of ghrelin is rapidly hydrolyzed to desacyl ghrelin in blood samples. Clin Chem. 2004;50:1077–1080. doi: 10.1373/clinchem.2003.025841. [DOI] [PubMed] [Google Scholar]