Abstract
Weight-controlling can be supported by a proper prescription of energy intake. The individual energy requirement is usually determined through resting energy expenditure (REE) and physical activity. Because REE contributes to 60-70% of daily energy expenditure, the assessment of REE is very important. REE is often predicted using various equations, which are usually based on the body weight, height, age, gender, and so on. The aim of this study is to validate the published predictive equations for resting energy expenditure in 76 normal weight and 52 obese Korean children and adolescents in the 7-18 years old age group. The open-circuit indirect calorimetry using a ventilated hood system was used to measure REE. Sixteen REE predictive equations were included, which were based on weight and/or height of children and adolescents, or which were commonly used in clinical settings despite its use based on adults. The accuracy of the equations was evaluated on bias, RMSPE, and percentage of accurate prediction. The means of age and height were not significantly different among the groups. Weight and BMI were significantly higher in obese group (64.0 kg, 25.9 kg/m2) than in the non-obese group (44.8 kg, 19.0 kg/m2). For the obese group, the Molnar, Mifflin, Liu, and Harris-Benedict equations provided the accurate predictions of > 70% (87%, 79% 77%, and 73%, respectively). On the other hand, for non-obese group, only the Molnar equation had a high level of accuracy (bias of 0.6%, RMSPE of 90.4 kcal/d, and accurate prediction of 72%). The accurate prediction of the Schofield (W/WH), WHO (W/WH), and Henry (W/WH) equations was less than 60% for all groups. Our results showed that the Molnar equation appears to be the most accurate and precise for both the non-obese and the obese groups. This equation might be useful for clinical professionals when calculating energy needs in Korean children and adolescents.
Keywords: Resting energy expenditure, predictive equation, indirect calorimetry, children, adolescents
Introduction
The occurrence of overweight and obesity in children and adolescents is steadily increasing in South Koreans as well as Western societies [1,2]. Obese children and adolescents have a high risk of becoming obese adults and thus, contracting obesity-associated comorbidities such as type-2 diabetes and cardiovascular diseases [3].
Weight-controlling can be supported by a proper prescription of energy intake and the individual energy requirement is usually determined through resting energy expenditure (REE) and physical activity [4]. Because REE contributes to 60-70% of daily energy expenditure [5], the assessment of REE is very important.
REE can be measured by indirect calorimetry accurately [6]. However, because measuring REE requires expensive and cumbersome equipment and specialized staff [7], REE is often predicted using various equations, which are usually based on the body weight, height, age, gender, and so on.
Many studies have developed and validated the REE predictive equations [8]. However, the only best predictive equation for REE was confirmed and uncertain. Because REE is influenced by age, weight, height, and body composition, REE predictive equation should be applied differently according to the characteristics of the target group. There are only a few studies that specifically derived or validated REE predictive equations for children and adolescents [9,10]. Moreover, there are only a few studies performed for obese children and adolescents. Ethnic differences, as some studies explained, in energy expenditure might exist and account for the difference [11-13]. These studies suggested that it is necessary to use ethnicity-specific REE equation for special ethnic population. However, the applicability of REE predictive equations and their accuracy for Korean children and adolescents were not known.
To identify the most accurate and precise REE predictive equation for normal weight and obese Korean children and adolescents, our study 1) searched and selected predictive equations which are expected to predict well for REE of subjects, 2) measured REE of subjects using an indirect calorimetry, 3) estimated REE using predictive equations, and 4) compared REE measured with REE predicted by the various popular equations.
Subjects and Methods
Subjects
Subjects were children and adolescents attending school in Gangneung City in Gangwon-Do province, a rural area of South Korea. They were recruited from the nutrition education and counseling program for weight management, at the Nutrition Lab of the Department of Food and Nutrition, the Gangneung-Wonju National University, South Korea between June 26 and October 9 of 2011. One-hundred and thirty-one (62 boys, 69 girls) healthy children and adolescents aged 7-18 years applied at the nutrition camp and participated in this study. We excluded ill patients and athletes. Written informed consent was obtained from both the participants and their legal guardians. This study was approved by the Gangneung-Wonju National University and by the School Board Officials prior to implementation.
Anthropometric measurements
Height was measured by using a stadiometer (BSM 330, Biospace, Korea) and was obtained without shoes and measured to the nearest 0.1 cm. Body weight and fat mass were assessed by using the bioelectrical impedance analysis (Inbody 720, Biospace Corp., Korea), which was calibrated immediately before each measurement and was obtained while the subject were wearing light clothing and the measurements were to the nearest 0.1 kg.
REE measurement
REE was measured by open-circuit indirect calorimetry, using a ventilated hood system (TrueOne2400, ParvoMedics Corp. UT, USA). The ventilated hood system was calibrated for gas volume every day before use and it was automatically recalibrated every 5 minutes during the measurement process. REE measurements were standardized by the published guidelines [14]. The subjects had fasted overnight or for ≥ 4h before the measurement, if the measurements could not be performed before noon. Subjects had not been physically active. The REE procedure took place in a quiet and thermoneutral room while the subjects rested quietly in a supine position and awake with the head placed in a clear ventilated canopy. The measurements took 15 min, and the first 5 min of the measurements were discarded and only steady state periods of measurement were selected. The measurement of oxygen consumption and carbon dioxide expulsion were taken, and the energy expenditure was calculated by using the Weir formula [15].
REE predictive equations
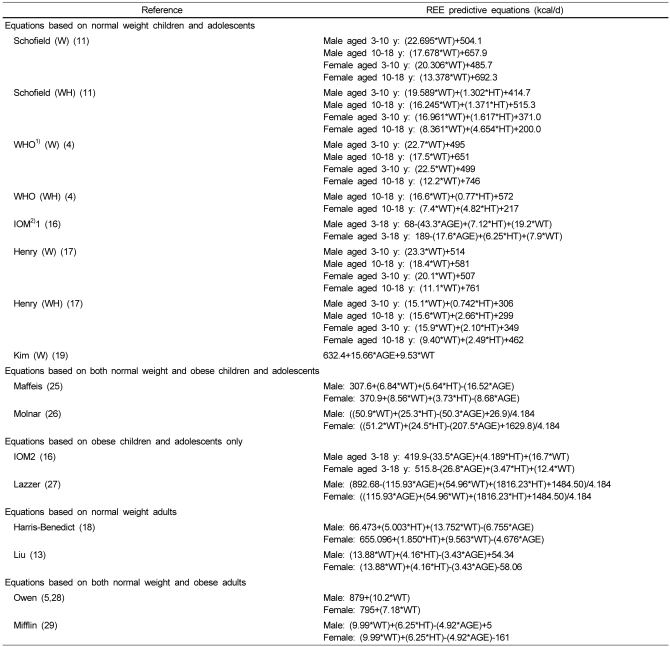
The predictive equations for REE used in our study are summarized in Table 1. Inclusion criteria were as follows: equations based on weight and/or height of children and adolescent, or equations that are the most commonly used in clinical settings although based on adults.
Table 1.
Equations used to predict the resting energy expenditure (REE) in our study
Abbreviation: WT, weight in kg; HT, height in cm; AGE in years.
1)FAO/WHO/UNU Expert Consultation
2)Institute of Medicine of the National Academies
The Schofield and the FAO/WHO/UNU (hereafter "WHO") equations were developed from 7173 data (Schofield database) published in the scientific literature of mostly European and North American subjects (87%) from 1914 to 1980 [4,11,12]. The Institute of Medicine (IOM) generated REE predictive equation for normal weight children (IOM1) and for overweight or obese children (IOM2) [16]. The Henry equation derived from the Oxford database that excluded all the Italian subjects, who were measured by an indirect closed-circuit calorimetry and were more likely to lead to higher basal metabolic rate (BMR) values compared to open- circuit calorimetry, from Schofield database. Also, the Oxford database included 4018 people from the tropics [17]. The Harris- Benedict equation was generated from REE measures of mostly college students and faculty of unreported ethnicity [18]. Although few young children and few overweight or obese participants were included in the dataset of Harris-Benedict, this equation continues to be used in all age and worldwide practices. The Kim (W) and the Liu equations were selected for use to account for the ethnic differences of REE. The Kim (W) equation was developed from 92 Korean children, aged from 4 to 11 years [19], and the Liu equation was generated from 119 Chinese adults whose ages ranged from 20 to 78 years old [13]. Previous study concluded that FFM (fat-free mass)-based equations did not improve the REE prediction in 121 Dutch obese adolescents [10]. Therefore, our study did not consider FFM-based equation for our subjects.
The REE was predicted for each equation in kcal/d, and calculated with the actual body weight and height at the time of the indirect calorimetry measurement. REE predicted was compared with REE measured by indirect calorimetry.
Statistical analysis
Subject characteristics, measured REE, and predicted REE were expressed as mean ± SD. Characteristics between non-obese group and obese group were compared by Student's t-test. REE predicted for all equations were compared with REE measured by paired t-test. The threshold for significance was set at 0.05 for all statistical analyses. Accuracy of REE predictive equations was assessed using the percentage of bias, the root mean squared prediction error (RMSPE), and the percentage of subjects predicted by equation within 90% to 110% (accurate prediction), < 90% (under prediction), or > 110% (over prediction) of measured REE, and Bland-Altman method. The percentage of bias was defined as the percentage of difference between the REE predicted and the measured. It was considered a measure of accuracy on a group level because the mean value of group masks the individual errors. The RMSPE was used to indicate how close the REE predicted was to the REE measured. The calculation of the RMSPE is as follows [20]:
RMSPE = √(Σ(Predicted REE-Measured REE)2 / N)
Because the calorimetry measurement error is approximately 5%, a prediction between 90% and 110% of the REE measured was considered an accurate prediction [8]. Bland-Altman method provided how precise REE predicted was. By calculating the mean difference between REE measured and REE predicted, and 95% limits of agreement as the mean difference in individuals (± 1.96 SD), Bland-Altman analyses were used to determine how precise the mean difference was both graphically and numerically [21].
Most of the data of our study were analyzed by using SAS 9.2 (SAS Institute Inc, Cary, NC). Bland-Altman plot was designed by using Excel program (Microsoft Office Excel 2007).
Results
A total of 131 children and adolescents (62 boys, 69 girls) participated in this study. We excluded 3 boys from these subjects because they were underweight. Obesity among children and adolescents was defined as being at or above the 95th percentile of the gender-specific body mass index (BMI) for their age group in the 2007 Korean National Growth Charts or a BMI of 25 or higher; overweight was defined as being at or above the 85th percentile to less than the 95th percentile BMI [22]. According to this definition, 128 subjects were classified with 76 normal weight (hereafter called "non-obese") and 52 overweight or obese (hereafter called "obese").
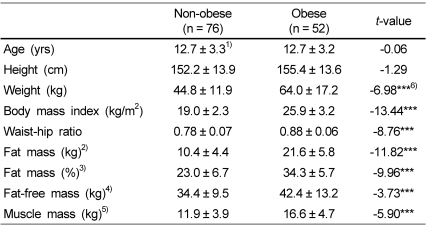
The subject characteristics for 76 non-obese and 52 obese children and adolescents are summarized in Table 2. The age and height were not significantly different between the two groups. The weight and BMI were significantly higher in the obese group (64.0 kg, 25.9 kg/m2) than in the non-obese group (44.8 kg, 19.0 kg/m2). Fat mass of the obese group (34.3%; 21.6 kg) also was significantly higher than that of the non-obese group (23.0%; 10.4 kg).
Table 2.
Anthropometric measurements of the subjects
1)Mean ± SD
2)Measured by Inbody 720
3)[Fat mass (kg) / Weight (kg)]×100
4)[Weight (kg) - Fat mass (kg)]
5)Calculated by Heymsfield's formula
6)***P < 0.001 Significantly different by t-test
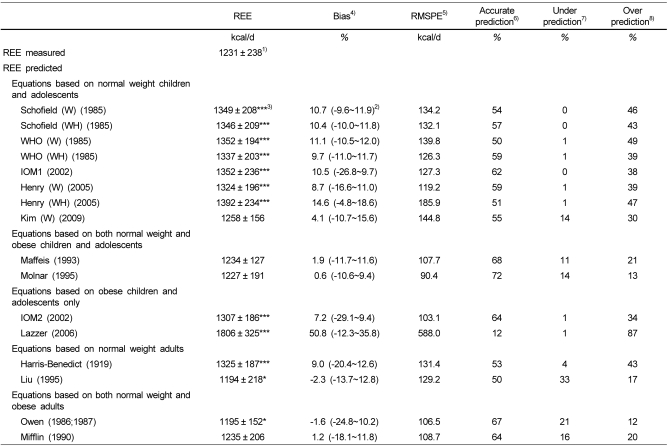
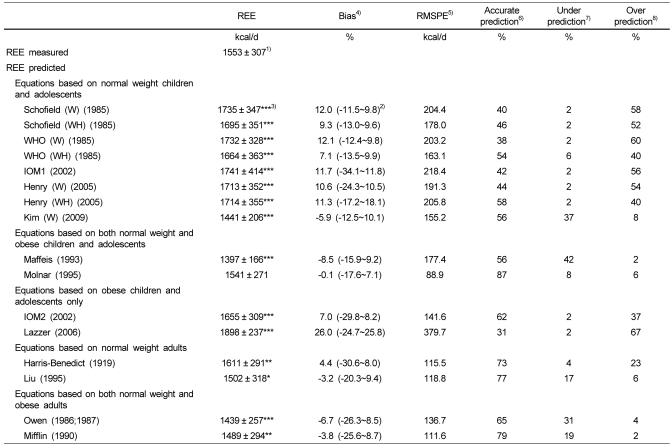
The average of measured or predicted REE (in kcal/d), the percentage of bias, the RMSPE (in kcal/d), and the percentage of accurate prediction with under prediction and over prediction are presented in Table 3 (non-obese group) and Table 4 (obese group).
Table 3.
Evaluation of resting energy expenditure (REE) predictive equations in 76 non-obese children and adolescents based on bias, root mean squared prediction error (RMPSE), and percentage of accurate prediction
1)Mean ± SD
2)Mean (range)
3)*P < 0.05, ***P < 0.001 Significantly different by paired t-test between predicted REE and measured REE
4)[(predicted REE - measured REE) / measured REE] × 100
5)Root Mean Squared Prediction Error = √(Σ(Predicted REE-Measured REE)2 / N)
6)Percentage of subjects predicted by equation within 90% to 110% of measured REE
7)Percentage of subjects predicted by equation < 90% of measured REE
8)Percentage of subjects predicted by equation > 110% of measured REE
Table 4.
Evaluation of resting energy expenditure (REE) predictive equations in 52 obese children and adolescents based on bias, root mean squared prediction error (RMPSE), and percentage of accurate prediction
1)Mean ± SD
2)Mean (range)
3)*P < 0.05, **P < 0.01, ***P < 0.001 Significantly different by paired t-test between predicted REE and measured REE
4)[(predicted REE - measured REE) / measured REE] × 100
5)Root Mean Squared Prediction Error = √(Σ(Predicted REE-Measured REE)2 / N)
6)Percentage of subjects predicted by equation within 90% to 110% of measured REE
7)Percentage of subjects predicted by equation < 90% of measured REE
8)Percentage of subjects predicted by equation > 110% of measured REE
For 76 non-obese children and adolescents (Table 3), the mean of REE predicted by the 4 equations of the Maffeis, the Molnar, the Kim (W), and the Mifflin were not significantly different with REE measured (1231 ± 238 kcal/d). The highest percentage of accurate prediction was provided by the Molnar equation (72%), which had also the smallest bias (0.6%) and RMSPE (90.4 kcal/d). For non-obese group, the bias for equations varied from -2.3% to 50.8%, and the RMSPE varied from 90.4 to 588.0 kcal/d, further, the percentage of accurate predictions varied from 12% to 72%.
For 52 obese children and adolescents (Table 4), the mean of REE predicted by only the Molnar equation was not significantly different with REE measured (1553 ± 307 kcal/d). The highest accurate prediction (87%) was provided by the Molnar equation along with the smallest bias (-0.1%) and RMSPE (88.9 kcal/d). The Mifflin, the Liu, and the Harris-Benedict equations provided the accurate predictions of > 70% (79%, 77%, and 73%, respectively); the biases for these equations were -3.8%, -3.2%, and 4.4%; the RMSPEs were 111.6, 118.8, and 115.5 kcal/d, respectively. The bias for equations varied from -8.5% to 26.0%, and the RMSPE varied from 88.9 to 379.7 kcal/d, and the percentage of accurate predictions varied from 31% to 87% for obese children and adolescents.
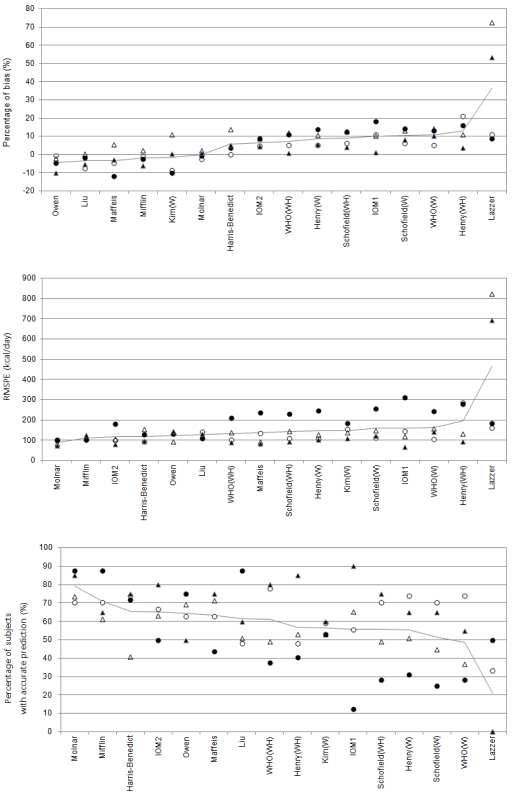
The comparison of the percentage of bias, the RMSPE, and the percentage of accurate predictions for the total groups of children and adolescent by BMI subgroups and gender are shown in Fig. 1. Most accurate for the non-obese boys was the WHO (WH) equation (bias: 5.2%; RMSPE: 103.5 kcal/d; accurate prediction: 78%), for the non-obese girls was the Molnar equation (bias: 2.1%; RMSPE: 84.1 kcal/d; accurate prediction: 73%), for obese boys were the Molnar, the Mifflin, and the Liu equations (bias: -2.3 to -0.6%; RMSPE: 99.2 to 110.5 kcal/d; accurate prediction: all 88%), and for obese girls was the IOM1 equation (bias: 1.2%; RMSPE: 67.7 kcal/d; accurate prediction: 90%). Only the Molnar equation consistently had ≥ 70% accurate prediction for all of the groups (varying from 70% to 88%).
Fig. 1.
Percentage of bias, root mean squared prediction error (RMSPE), and percentage of subjects with accurate predictions by 16 resting energy expenditure predictive equations for non-obese boys (◯, n = 27), non-obese girls (△, n = 49), obese boys (●, n = 32), obese girls (▲, n = 20), and total (line, n = 128) of the subjects
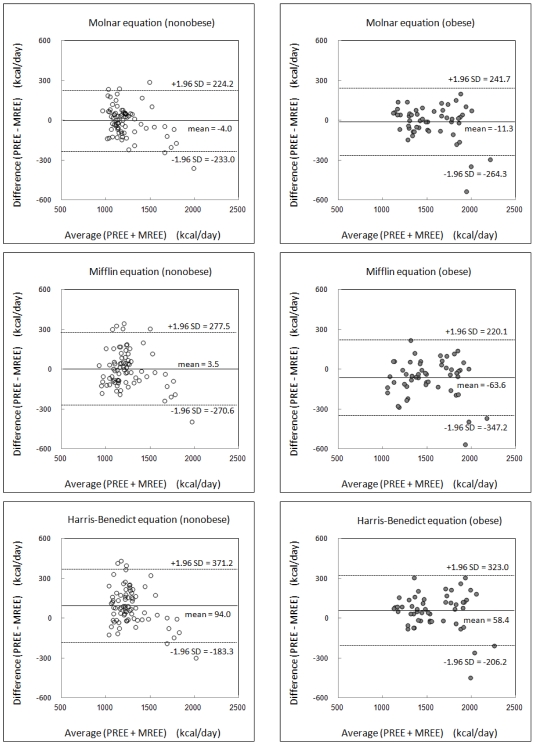
Bland-Altman plots for the non-obese and the obese children and adolescents by 3 best-performing REE predictive equations (Molnar, Mifflin, and Harris-Benedict) are shown in Fig. 2. For both the non-obese group and the obese group, the Molnar equation had the smallest difference in the mean (-4.0 and -11.3 kcal/d, respectively) and limits of agreements (-233.0 to 224.2 kcal/d and -264.3 to 241.7 kcal/d, respectively).
Fig. 2.
Bland-Altman plots for measured REE (MREE) and predicted REE (PREE) by 3 best-performing REE predictive equations (Molnar, Mifflin, and Harris-Benedict) for non-obese (◯, left panels) and obese (●, right panels) children and adolescents
Discussion
The Schofield and the WHO equations that are the most commonly used, which was based on weight and/or height of children and adolescents, had the low accurate prediction of < 60% and the relative high over-prediction of > 39% for both the groups of children and adolescents in our study. However, Tverskaya et al. [23] have shown that the WHO equation was the best REE predictive equation for the obese and the non-obese in US children and adolescents who were composed of 81% white, 11% Hispanic, and 8% African American. Rodríguez et al. [24] also explained that the WHO (W/WH) and the Schofield (WH) equations were appropriate for predicting REE in a mixed group of 57 obese and 59 non-obese, Caucasian children and adolescents aged from 7.8 to 16.6 years in Spain. These results of previous studies were not consistent with our results; this difference might be explained by the fact that Schofield study and previous studies were performed on subjects of different ethnicity, mostly Caucasian, whereas our study population was Koreans.
Among the commonly-used equations based on adults [5,13,18,28,29], the Mifflin equation provided the accurate prediction of > 60% for all groups by BMI subgroups and gender, and had the higher accuracy in boys (non-obese: 70%, obese: 88%) than in girls (non-obese: 61%, obese: 65%). In addition, the Harris-Benedict equation had > 70% accurate prediction for all groups except the non-obese girls (41%). Our data demonstrate that these equations, based on adults, may be suitable for Korean children and adolescents.
It was noted that ethnicity was a factor in REE prediction for adults, but not as clear for children because of insufficient data [10]. It was anticipated that the Kim (W) equation, based on Korean children, might be a well estimate of REE for our subjects. However, against expectation the Kim (W) equation was not superior to the other equations tested in estimation for REE; the Kim (W) provided accurate predictions of < 60% for the non-obese and the obese subjects in our study. It is thought that the Kim (W) equation might be improper for children and adolescents aged from 7 to 18 years, since, the Kim (W) equation was derived from children aged 4 to 11 years and was not considered the difference according to gender.
The Molnar and the Maffeis equations were developed for children and adolescents including both normal weight and obese subjects [25,26]. In our study, the Molnar equation, which was developed from 371 Hungarian normal weight and obese adolescents in the age 10-16 years [26], predicted very well for both the non-obese subjects (accurate prediction: 72%, bias: 0.6%, RMSPE 90.4 kcal/d) and the obese subjects (accurate prediction: 87%, bias: -0.1%, RMSPE 88.9 kcal/d). Hofsteenge et al. [10] explained that the Molnar equation was the most accurate and precise equation (accurate prediction: 74%, bias: -1.2%, RMSPE 174 kcal/d) for 121 Dutch overweight or obese adolescents, the result from the mentioned study correlates with our own. Meanwhile, the Maffeis equation provided the higher accuracy in the non-obese group (accurate prediction: 68%, bias: 1.9%, RMSPE: 107.7 kcal/d) than in the obese group of our study. Lawrence et al. [19] elucidated that REE predicted by the Maffeis equation was not significantly different with REE measured for Korean children with normal weight. These results showed that the Maffeis equation was good for the non-obese Korean children and adolescents only, not for the obese group.
The Lazzer equation, which was specially developed for the obese children and adolescents [27] was the worst-predicted equation in girls (accurate prediction: 0%, bias: 63.1%, RMSPE 758.2 kcal/d). Meanwhile, in boys, the Lazzer equation estimated better in the REE for the obese group (accurate prediction: 50%, bias: 8.8%, RMSPE: 183.4 kcal/d) than for the non-obese group (accurate prediction: 33%, bias: 11.1%, RMSPE: 162.1 kcal/d). Hofsteenge et al. [10] reported that the Lazzer equation predicted well with 68% accurate predictions and a bias of -2.5% for 121 Dutch overweight or obese adolescents and these results are consistent with our results on the boys to an extent. Lazzer et al. [27] suggested that their equation might be useful for predicting REE in severely obese children and adolescents because these equations were derived from 287 subjects with a BMI of 25.4 to 62.0 kg/m2. However, the BMI of our obese subjects ranged from 20.0 to 31.8 kg/m2. Considering these results from our study, the Lazzer is not the recommended equation for overweight or mild obese Korean children and adolescents, especially girls.
The IOM1 equation based on normal weight group and the IOM2 equation based on the overweight or obese group [16] provided the highest accuracy for obese girls (accurate prediction: 90% and 80%, bias: 1.2% and 4.4%, RMSPE: 67.7 and 80.3 kcal/d), but the lowest accuracy for obese boys (accurate prediction: 13% and 50%, bias: 10.9% and 4.7%, RMSPE: 179.9 and 312.6 kcal/d) in our study. Further, these equations had > 60% accurate predictions for the non-obese group (both boys and girls). Therefore, the IOM1 equation might be useful for Korean obese girls and not obese boys.
When split by BMI subgroups and gender in our study, most of the equation had an accuracy of prediction that differed with gender. But, the validation of the Molnar equation did not differ between boys and girls. These results were in agreement with that of Hofsteenge et al. [10], which reported that the Molnar equation had the narrowest range in accurate predictions and RMSE for the 4 gender and ethnic groups (Western boys and girls, non-Western boys and girls).
Our subjects were children and adolescents aged from 7 to 18 years, which included those in the pubertal period. Population in this period is related with rapid anatomical and physiologic changes, including the variation in energy metabolic rate. However, our study included the limitation that could not evaluate the differences by the age subgroups on the validation of REE equations because the sample size was small. Derumeaux-Burel et al. [9], which established new predictive equations on a large sample of 752 French children and adolescents aged from 3 to 18 years, reported that body composition and gender were always a significant determinant of REE in the new equations, explaining 79% and 72% of REE in boys and girls, respectively. But age was a significant factor of REE in only girls. It explained 76% of REE in girls, when added the variable of age in the model including body composition and gender. From these results, it could not be confirmed whether the variation of REE is associated with age in the growth period. Thus, it is necessary to perform a more extensive study with a sufficient sample size, and to analyze the relationships of various variables, such as age, on the assessment of the accuracy and precision for REE predictive equations among the groups by BMI subgroups and gender in future research. However, considering the reality that it's difficult to obtain the REE measurement data of children and adolescents, it is important that our study validated the REE predictive equations for both non-obese and obese groups in young Korean people, which was not performed in the previous studies.
In conclusion, this study showed that the Molnar equation based on weight, height, age, and gender can best predict REE for the non-obese and obese Korean children and adolescents. For the non-obese group, the Maffeis, the Owen, the Mifflin, and the IOM2 equations can be used with reasonable accuracy. The Mifflin, the Liu, and the Harris-Benedict equations for the obese group provided the higher accuracy, compared with the non-obese group. The REE predictive equations should be validated for any single specific population [28]. However, there were few equations based on Korean, until now. Therefore, in further research new equation should be developed from Korean children and adolescents and be validated for Korean population.
Footnotes
This research was supported by Basic Science Research Program through the National Research Foundation of Korea (NRF) funded by the Ministry of Education, Science, and Technology (2010-0004472).
References
- 1.Obesity. World Health Organization [Internet] [cited 2011 December 2]. Available from: http://www.who.int/mediacentre/factsheets/fs311/en/
- 2.Ministry of Health and Welfare; Korea Centers for Disease Control and Prevention. Korea Health Statistics 2005: Korea National Health and Nutrition Examination Survey (KNHANES III) 2006. [Google Scholar]
- 3.Zalesin KC, Franklin BA, Miller WM, Peterson ED, McCullough PA. Impact of obesity on cardiovascular disease. Med Clin North Am. 2011;95:919–937. doi: 10.1016/j.mcna.2011.06.005. [DOI] [PubMed] [Google Scholar]
- 4.Food and Agriculture Organization; World Health Organization; United Nations University. Energy and Protein Requirements. Report of a Joint FAO/WHO/UNU Expert Consultation. WHO Technical Report Series No. 724. Geneva: WHO; 1985. [PubMed] [Google Scholar]
- 5.Owen OE, Holup JL, D'Alessio DA, Craig ES, Polansky M, Smalley KJ, Kavle EC, Bushman MC, Owen LR, Mozzoli MA, Kendrick ZV, Boden GH. A reappraisal of the caloric requirements of men. Am J Clin Nutr. 1987;46:875–885. doi: 10.1093/ajcn/46.6.875. [DOI] [PubMed] [Google Scholar]
- 6.Matarese LE. Indirect calorimetry: technical aspects. J Am Diet Assoc. 1997;97:S154–S160. doi: 10.1016/s0002-8223(97)00754-2. [DOI] [PubMed] [Google Scholar]
- 7.Stewart CL, Goody CM, Branson R. Comparison of two systems of measuring energy expenditure. JPEN J Parenter Enteral Nutr. 2005;29:212–217. doi: 10.1177/0148607105029003212. [DOI] [PubMed] [Google Scholar]
- 8.Frankenfield D, Roth-Yousey L, Compher C. Comparison of predictive equations for resting metabolic rate in healthy nonobese and obese adults: a systematic review. J Am Diet Assoc. 2005;105:775–789. doi: 10.1016/j.jada.2005.02.005. [DOI] [PubMed] [Google Scholar]
- 9.Derumeaux-Burel H, Meyer M, Morin L, Boirie Y. Prediction of resting energy expenditure in a large population of obese children. Am J Clin Nutr. 2004;80:1544–1550. doi: 10.1093/ajcn/80.6.1544. [DOI] [PubMed] [Google Scholar]
- 10.Hofsteenge GH, Chinapaw MJ, Delemarre-van de Waal HA, Weijs PJ. Validation of predictive equations for resting energy expenditure in obese adolescents. Am J Clin Nutr. 2010;91:1244–1254. doi: 10.3945/ajcn.2009.28330. [DOI] [PubMed] [Google Scholar]
- 11.Schofield WN. Predicting basal metabolic rate, new standards and review of previous work. Hum Nutr Clin Nutr. 1985;39(Suppl 1):5–41. [PubMed] [Google Scholar]
- 12.James WP. Basal metabolic rate: comments on the new equations. Hum Nutr Clin Nutr. 1985;39(Suppl 1):92–96. [PubMed] [Google Scholar]
- 13.Liu HY, Lu YF, Chen WJ. Predictive equations for basal metabolic rate in Chinese adults: a cross-validation study. J Am Diet Assoc. 1995;95:1403–1408. doi: 10.1016/S0002-8223(95)00369-X. [DOI] [PubMed] [Google Scholar]
- 14.Compher C, Frankenfield D, Keim N, Roth-Yousey L Evidence Analysis Working Group. Best practice methods to apply to measurement of resting metabolic rate in adults: a systematic review. J Am Diet Assoc. 2006;106:881–903. doi: 10.1016/j.jada.2006.02.009. [DOI] [PubMed] [Google Scholar]
- 15.Weir JB. New methods for calculating metabolic rate with special reference to protein metabolism. J Physiol. 1949;109:1–9. doi: 10.1113/jphysiol.1949.sp004363. [DOI] [PMC free article] [PubMed] [Google Scholar]
- 16.Institute of Medicine of the National Academies. Dietary Reference Intakes for Energy, Carbohydrate, Fiber, Fat, Fatty Acids, Cholesterol, Protein, and Amino Acids. Washington D.C.: The National Academies Press; 2002. pp. 107–264. [DOI] [PubMed] [Google Scholar]
- 17.Henry CJ. Basal metabolic rate studies in humans: measurement and development of new equations. Public Health Nutr. 2005;8:1133–1152. doi: 10.1079/phn2005801. [DOI] [PubMed] [Google Scholar]
- 18.Harris JA, Benedict FG. A Biometric Study of Basal Metabolism in Man. Washington DC: Carnegie Institute of Washington; 1919. [Google Scholar]
- 19.Lawrence JC, Lee HM, Kim JH, Kim EK. Variability in results from predicted resting energy needs as compared to measured resting energy expenditure in Korean children. Nutr Res. 2009;29:777–783. doi: 10.1016/j.nutres.2009.10.017. [DOI] [PubMed] [Google Scholar]
- 20.Taaffe DR, Thompson J, Butterfield G, Marcus R. Accuracy of equations to predict basal metabolic rate in older women. J Am Diet Assoc. 1995;95:1387–1392. doi: 10.1016/S0002-8223(95)00366-5. [DOI] [PubMed] [Google Scholar]
- 21.Bland JM, Altman DG. Statistical methods for assessing agreement between two methods of clinical measurement. Lancet. 1986;1:307–310. [PubMed] [Google Scholar]
- 22.Korea Centers for Disease Control and Prevention; The Korean Pediatric Society; The Committee for the Development of Growth Standard for Korean Children and Adolescents. 2007 Korean Children and Adolescents Growth Standard (commentary for the development of 2007 growth chart). Government report online. Seoul: Division of Chronic Disease Surveillance; 2007. Nov, Available from: http://www.cdc.go.kr/ [Google Scholar]
- 23.Tverskaya R, Rising R, Brown D, Lifshitz F. Comparison of several equations and derivation of a new equation for calculating basal metabolic rate in obese children. J Am Coll Nutr. 1998;17:333–336. doi: 10.1080/07315724.1998.10718771. [DOI] [PubMed] [Google Scholar]
- 24.Rodríguez G, Moreno LA, Sarría A, Fleta J, Bueno M. Resting energy expenditure in children and adolescents: agreement between calorimetry and prediction equations. Clin Nutr. 2002;21:255–260. doi: 10.1054/clnu.2001.0531. [DOI] [PubMed] [Google Scholar]
- 25.Maffeis C, Schutz Y, Micciolo R, Zoccante L, Pinelli L. Resting metabolic rate in six- to ten-year-old obese and nonobese children. J Pediatr. 1993;122:556–562. doi: 10.1016/s0022-3476(05)83535-8. [DOI] [PubMed] [Google Scholar]
- 26.Molnár D, Jeges S, Erhardt E, Schutz Y. Measured and predicted resting metabolic rate in obese and nonobese adolescents. J Pediatr. 1995;127:571–577. doi: 10.1016/s0022-3476(95)70114-1. [DOI] [PubMed] [Google Scholar]
- 27.Lazzer S, Agosti F, De Col A, Sartorio A. Development and cross-validation of prediction equations for estimating resting energy expenditure in severely obese Caucasian children and adolescents. Br J Nutr. 2006;96:973–979. doi: 10.1017/bjn20061941. [DOI] [PubMed] [Google Scholar]
- 28.Owen OE, Kavle E, Owen RS, Polansky M, Caprio S, Mozzoli MA, Kendrick ZV, Bushman MC, Boden G. A reappraisal of caloric requirements in healthy women. Am J Clin Nutr. 1986;44:1–19. doi: 10.1093/ajcn/44.1.1. [DOI] [PubMed] [Google Scholar]
- 29.Mifflin MD, St Jeor ST, Hill LA, Scott BJ, Daugherty SA, Koh YO. A new predictive equation for resting energy expenditure in healthy individuals. Am J Clin Nutr. 1990;51:241–247. doi: 10.1093/ajcn/51.2.241. [DOI] [PubMed] [Google Scholar]


