

Abstract
The subthalamic nucleus (STN), which receives excitatory inputs from the cortex and has direct connections with the inhibitory pathways of the basal ganglia, is well positioned to efficiently mediate action selection. Here, we use microelectrode recordings captured during deep brain stimulation surgery as participants engage in a decision task to examine the role of the human STN in action selection. We demonstrate that spiking activity in the STN increases when participants engage in a decision and that the level of spiking activity increases with the degree of decision conflict. These data implicate the STN as an important mediator of action selection during decision processes.
Introduction
Selecting actions that maximize value among competing alternatives is vital to an organism's survival (Doya, 2008; Rangel et al., 2008; Kable and Glimcher, 2009). The neural basis of action selection has been most studied in the context of sensorimotor tasks in which an animal must choose among two competing stimuli (Kim and Shadlen, 1999; Schall, 2001; Gold and Shadlen, 2007; Kiani et al., 2008; Wang, 2008). These studies have shown that some cortical neurons gradually increase their firing rates when integrating sensory evidence and signal action selection once a threshold is exceeded, thus providing neurobiological support for race-to-barrier diffusion models describing human choice behavior (Schall, 2001; Shadlen and Newsome, 2001; Gold and Shadlen, 2002, 2007; Mazurek et al., 2003; Churchland et al., 2008). It is unclear, however, how firing rate thresholds are adjusted to ensure optimal action selection in these models, and selection among abstract values or among multiple alternatives become increasingly complex and difficult to implement with known cortical circuitry (McMillen and Holmes, 2006; Bogacz and Gurney, 2007). These questions suggest that strictly cortically based models of action selection may be incomplete, motivating a search for additional brain structures that may play a role in decision processes.
The basal ganglia are well situated to resolve some of these issues (Redgrave et al., 1999; Frank, 2006; Bogacz and Gurney, 2007; Bogacz, 2007; Baunez and Lardeux, 2011). With widespread and direct connections to the cortex (Parent and Hazrati, 1995), this central structure can theoretically adjust threshold criteria and efficiently convey information between separate cortical regions (Redgrave et al., 1999). Experimental evidence indirectly supports the suggestion that the basal ganglia participates in decisions, as high-frequency electrical stimulation in, and hence inhibition of, both animal and human subthalamic nucleus (STN) elicits premature and impulsive response selection (Baunez et al., 2001; Desbonnet et al., 2004; Frank et al., 2007). Computational modeling suggests that the STN can adjust the temporal dynamics of motor control and halt action selection during the decision period until all information has been integrated (Frank, 2006; Bogacz and Gurney, 2007). Furthermore, these models hypothesize that activity in the STN should be related to the strength of competing responses and should effectively track the level of decision conflict (Frank, 2006; Bogacz and Gurney, 2007).
Here, we directly test this prediction in human participants undergoing deep brain stimulation (DBS) surgery of the STN for Parkinson's disease. DBS surgery offers a platform well suited to exploring these questions since patients are awake and can engage in cognitive tasks while microelectrode recordings are captured from basal ganglia structures during surgery. Participants undergoing DBS surgery engaged in a probability learning task followed by a decision task that required them to choose between visual symbols while we recorded activity from their STN. We examined changes in single unit STN activity during the decision period and between different levels of decision conflict to determine the role of the STN in action selection.
Materials and Methods
Micrelectrode recordings during deep brain stimulation surgery.
We measured intraoperative activity of the STN in participants undergoing DBS surgery of the STN for Parkinson's disease. Participants volunteered to take part in the study after informed consent was obtained during preoperative consultation for surgery and received no financial compensation for their participation. Per routine presurgical protocol, Parkinson's medications were stopped on the night before surgery (12 h preoperatively); hence, participants engaged in the study while in an OFF state. The study was conducted in accordance with a University of Pennsylvania Institutional Review Board-approved protocol. Ethical constraints limited recordings to only participants with clinical indications for DBS surgery.
Per routine DBS surgery protocol, intraoperative microelectrode recordings were used to identify the STN and, more ventrally, the substantia nigra (SN). Intraoperative microelectrode recordings were performed with 1 μm diameter tungsten tip electrodes advanced with a power-assisted microdrive (Jaggi et al., 2004). Microelectrode recordings were captured using a StimPilot recording system (16 bit analog-to-digital converter) and Spike2 data acquisition software [for recording details, see the study by Moyer et al. (2007)]. Signals were sampled at 24 kHz for data analysis.
Intraoperative targeting for microelectrode recording followed by DBS lead implantation in the STN was 12 mm lateral to the anterior commissure (AC)–posterior commissure (PC) line, 3 mm posterior to the midcommisural point, and 5 mm below the AC–PC line. Mean coordinates of the ventral border of STN, identified by microelectrode recordings and referenced to the midcommisural point, were x = 13.9 mm (SE = 0.22), y = −3.49 mm (SE = 0.49), and z = −5.59 mm (SE = 0.78) for left electrode recordings, and x = −12.43 (SE = 0.53), y = −3.52 mm (SE = 0.53), and z = −5.37 mm (SE = 0.88) for right electrode recordings. These coordinates correspond to left and right STN on the Schaltenbrand–Wahren brain atlas. DBS macroelectrode leads were placed with the ventral most electrode at these locations. A postoperative MRI confirmed the final DBS macroelectrode location (see Fig. 1d), which followed the same trajectory as microelectrode recordings.
Figure 1.
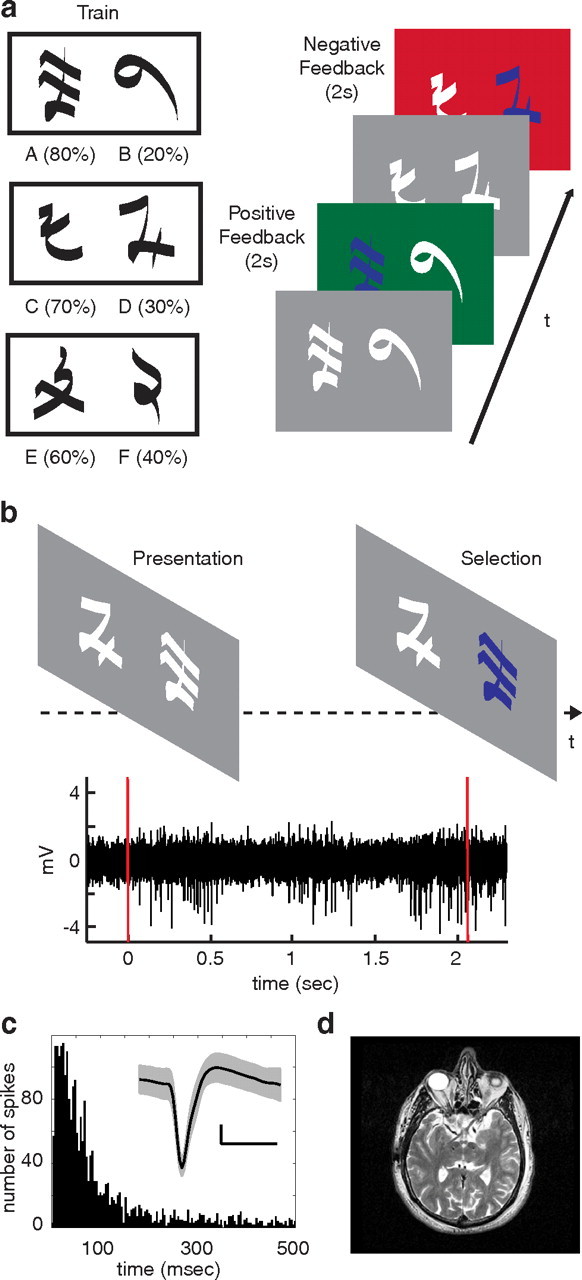
Probability learning and decision task. a, In the learning task, three pairs of symbols (denoted here by pairs of letters: AB, CD, EF) are presented in random order. Participants are instructed to choose one of the two stimuli on each trial. Reward rates for each symbol are randomly assigned and fixed throughout the experiment. Probabilistic feedback follows each choice for 2 s. Positive feedback is indicated with a green screen and an audible ring of a cash register. Negative feedback is indicated with a red screen and an audible buzz. b, In the decision task, participants are presented with combinations of all symbols and instructed to choose one of the two symbols presented on each trial. No feedback indicating whether the choice was correct is presented. Microelectrode recordings are captured from STN during the decision task. The bottom panel represents a typical bandpass filtered STN recording during a single trial of the decision task. Red lines indicate stimulus presentation and button selection. c, Histogram of interspike intervals from one spike cluster. Inset, Mean waveform of this spike cluster is shown in black, with SD in gray. Calibration: 10 mV, 0.5 ms. d, Postoperative axial MRI demonstrates final placement of DBS leads in bilateral STNs for one participant.
Behavioral analysis.
The cognitive task used in this study involved a probability learning task followed by a decision task with multiple probability comparisons that was established previously (Frank et al., 2004, 2007). Participants engaged in both tasks in the intraoperative environment while undergoing DBS surgery and while microelectrode recordings were captured from basal ganglia structures. Participants first experienced the tasks during a preoperative consultation several weeks before surgery and were reminded of the test structure immediately before surgery. A single intraoperative experimental session, comprising both tasks, lasted ∼15 min, depending on the participant's response times. Participants engaged in the probability learning task first while recordings were captured from the SN. In this study, we focus exclusively on the decision making task and associated STN activity. Microelectrodes were subsequently retracted to 0.5 mm dorsal to the ventral STN border, corresponding to the ventral subdivision of STN, where recordings were captured while participants engaged in the decision task (see Fig. 1). Because DBS electrodes are often implanted bilaterally, some participants completed two experimental sessions, yielding 18 experimental sessions from the 14 participants. In these cases, participants were presented with different sets of stimuli for each experimental session.
During the probability learning task, henceforth referred to as the training phase of the experiment, three pairs of symbols (denoted here by pairs letters: AB, CD, EF) were presented in random order, and participants were instructed to choose one of the two stimuli on each trial (see Fig. 1a). Selections were made by pressing the button of a handheld controller with either the left or right hand. The three stimulus pairs were characterized by different relative rates of reward (AB, 80 vs 20%; CD, 70 vs 30%; EF, 60 vs 40%). Reward rates associated with each symbol were determined randomly and fixed throughout the experiment. Probabilistic feedback followed each choice. In the event of positive feedback, the selection screen turned green, and an audible ring of a cash register was presented. In the event of negative feedback, the selection screen turned red, and an audible buzz was presented. Each trial consisted of presentation of the stimuli, participant choice, and a 2 s display of feedback. Over the course of the training phase of the experiment, participants should learn the underlying probabilities associated with each symbol.
During the subsequent decision task, henceforth referred to as the testing phase of the experiment, participants were presented with combinations of all symbols, including novel combinations, and instructed to choose one of the two symbols presented on each trial (see Fig. 1b). Fifteen symbol pairs, corresponding to every combination of the six symbols presented during training, were presented during testing. Each symbol pair was presented up to 12 times in random order. After each choice, the selection screen turned gray. To prevent further learning of reward probabilities, especially those concerning novel combinations of symbols, no feedback indicating whether the choice was correct was presented.
We quantified learning rates during the training phase of the experiment by dividing the number of total trials into five blocks and calculating how often participants made accurate choices, defined as choosing the symbol with the higher a priori reward rate, within each block (see Fig. 2a). For each participant, we defined the reward expectation assigned to each symbol as the rate of selection of that symbol during the final block in training. To assess the level of decision conflict during the testing phase of the experiment, for every symbol pair we calculated the difference in reward expectation between the two symbols. Thus, in the training phase, if a participant selects symbol A 80% of the time in the final block and symbol C 65% of the time, then the difference in reward expectation for the novel combination AC is 0.15. By our convention, positive differences indicate a higher level of reward expectation for the symbol with the higher a priori reward rate. We define decision conflict as one minus the magnitude of the difference in reward expectation such that differences in reward expectation near zero and differences in reward expectation near one indicate high and low levels of decision conflict, respectively.
Figure 2.

Behavioral performance. a, Black, red, and blue traces represent mean accuracy across all participants for the AB, CD, and EF symbol pairs, respectively, during each of five equally sized blocks during training. Error bars represent SE. b, Each point represents the overall accuracy during the final block of training mapped to the overall accuracy throughout testing for each of the 18 experimental sessions. The black line demonstrates the best fit of a linear regression. c, Each point represents the difference in reward expectation of each of the 15 symbol pairs presented during testing (x-axis) mapped to how often the participant chose the symbol with the higher a priori reward rate (accuracy; y-axis) across all 18 experimental sessions. Ellipses represent SE of the differences in reward expectation and accuracy across experimental sessions. A positive (negative) difference in reward expectation suggests that the participant ascribes greater reward expectation to the symbol with the higher (lower) a priori reward rate. The red line demonstrates the average regression line from all participants.
For statistical analyses of behavioral data, we considered each of the 18 individual experimental sessions as independent events. We used a Wilcoxon rank-sum test across experimental sessions to assess learning between experimental blocks, and a linear regression to assess the relationship between accuracy during the final block of training and testing accuracy. To analyze to what extent participants used the learned reward expectations to inform their decisions, we calculated the mean testing accuracy for each of the 15 symbol pairs presented during testing. We calculated a linear regression and correlation coefficient between testing accuracy and the difference in reward expectation associated with the 15 symbol pairs for each experimental session. To illustrate this relationship across the population, we rank ordered the differences in reward expectation for each participant, and averaged these values and their corresponding testing accuracies across experimental sessions. In Figure 2c, we plot the mean and SE across experimental sessions and the average regression slope.
To assess the consistency of this relationship, we performed a t test on the correlation coefficients across the 18 experimental sessions. To confirm the significance of this relationship across experimental sessions, we also used a permutation procedure. For each experiment, we generated a null distribution of 1000 permuted correlation coefficients, calculated by shuffling the labels of testing accuracy associated with each symbol pair. We summed correlation coefficients across participants. To generate a p value, we determined the position of the summed original correlation coefficients in the distribution of summed correlation coefficients calculated from the permuted data. We used a similar procedure to assess whether the difference in reward expectation correlated with median response time associated with the presentation of each symbol pair.
Electrophysiology.
We captured activity from 18 microelectrode STN recordings from 14 participants. For each recording, we extracted spikes using the WaveClus spike sorting package, which bandpass filters the raw recorded signals between 400 and 3000 Hz before identifying individual spike events and grouping them into spike clusters (see Fig. 1c) (Quiroga et al., 2004). To quantify spike activity during the presentation of symbol pairs during the testing phase of the experiment, we generated perievent spike histograms (50 ms bins; 1250 ms time window, 250 ms before stimulus, 1000 ms after stimulus) for each trial during the decision task (see Fig. 3a). We compared spike histograms to baseline spiking activity, defined as activity occurring in the interval 500 ms before symbol pair presentation on every trial. Spiking activity on every trial is z scored by subtracting the mean and dividing by the SD of baseline spiking activity to compare across cells and across participants.
Figure 3.

Spike activity during the decision task. a, Raster plot (top) and histogram (bottom) captured from a single STN cell during the decision task. The red line indicates the stimulus onset. The raster plot demonstrates spike activity during all 180 trials of the decision task. Histogram represents average spike rate for all trials using 50 ms bins. b, Average spike activity across all cells in response to all decision trials. The red line indicates stimulus onset. c, Pooled spike activity across all cells in response to all high (solid) and low (dashed) decision conflict trials. Red line indicates stimulus onset. Lines represent mean z-scored continuous time firing rates. The gray shaded region represents the interval between 100 and 400 ms after stimulus onset used for statistical analysis. d, Each point represents the mean spiking rate observed for each level of decision conflict for each of the 15 symbol pairs presented during testing, averaged across all 27 cells. Ellipses represent the SEs of decision conflict and spike rate across cells. The red line demonstrates the average regression line from all participants. e, Bars represent average spiking rates associated with three levels of decision conflict across all 27 cells. Error bars represent SE. Significant differences in spike activity are indicated with an asterisk.
To compare spike activity in response to different levels of decision conflict, we divided decision conflict into three equally spaced bins. There were, on average, 51.7 trials per experiment (SE = 3.9) corresponding to high decision conflict, 51.3 trials (SE = 3.9) corresponding to medium decision conflict, and 51.5 trials (SE = 3.9) corresponding to low decision conflict. To generate figures demonstrating changes in spiking activity with decision conflict and laterality (see Figs. 3c, 4b), we calculated a continuous time firing rate by smoothing the spike train from a given trial with a Gaussian kernel with an SD of 25 ms and normalizing by sampling rate. We pooled z-scored continuous time firing rates from all trials from all cells. Figures demonstrate the mean spiking activity for each condition calculated from the pooled data. Pooled data were used for illustrative purposes and were not used for statistical analyses in the text. We focused our statistical analyses on the interval between 100 and 400 ms after stimulus onset and on the 300 ms immediately preceding a response (gray shaded regions in figures), as preliminary analyses demonstrated that these intervals were particularly responsive.
Figure 4.

Spike activity at the moment of action. a, Average spike activity across all cells time locked to button selection (red line). b, Pooled spike activity across all cells during all trials associated with contralateral (solid) and ipsilateral (dashed) button presses, time locked to button selection (red line). Lines represent mean z-scored continuous time firing rates. The gray shaded region represents the interval between 300 and 0 ms before button press used for statistical analysis. c, Average spike activity between 0 and 300 ms before button press for trials associated with contralateral and ipsilateral button presses. Error bars represent SE.
Statistical analysis of spiking data.
We performed statistical analyses on spiking activity by calculating correlations between spiking activity and decision conflict, which in our analysis is a continuous variable that ranges between 0 and 1. For each cell, we calculated the mean spike rate during the interval between 100 and 400 ms after stimulus presentation for each of the 15 symbol pairs presented during testing and then calculated a linear regression and correlation coefficient between the mean spike rates and decision conflicts associated with the 15 symbol pairs. To illustrate this relationship across cells, we rank ordered the levels of decision conflict for each participant and averaged these values and the corresponding spiking rates across experimental sessions. In Figure 3d, we plot the mean and SE of the average decision conflict and corresponding spike rates across cells, and the average regression slope.
Because of the limitations in the number of trials recorded in every experimental session, statistical analyses at the individual cell level are rarely significant, and instead are performed at the population level. To assess the consistency of the relationship between spike activity and decision conflict, we performed a t test on the individual correlation coefficients calculated for the 27 cells. To confirm the significance of this relationship across the population, we also used a permutation procedure. For each cell, we generated a null distribution of 1000 permuted correlation coefficients, calculated by shuffling the mean spike rates associated with each level of decision conflict. We summed correlation coefficients across cells. To generate a p value, we determined the position of the summed original correlation coefficients in the distribution of summed correlation coefficients calculated from the permuted data. For each cell, we also divided decision conflict into three equal bins (five symbol pairs per bin) and calculated the mean spike rate and decision conflict for each bin of decision conflict to perform the same statistical analysis. To assess the consistency and significance of the relationship between spike rate and response time, we used a similar procedure, but calculated the spike rate correlations with response time instead of decision conflict.
To compare the change in spiking activity across specific conditions (e.g., decision period vs baseline, high decision conflict vs low decision conflict trials, ipsilateral vs contralateral trials, win/win vs win/loss, etc.), we averaged z-scored firing within each cell for all trials associated with a given condition. For each cell, we calculated the difference in mean firing rate between conditions, generating a single number reflecting the size of the effect for each cell. To determine how consistent this effect was across the population, we performed a two-sided t test on these mean differences across cells. To confirm the significance of these differences across the population, we also used a permutation procedure. For each cell, we used a two-sided t test to compare the distribution of activity between two conditions, generating a t statistic for each comparison. We then permuted the labels for the conditions 1000 times and used a t test to generate a null distribution of shuffled t statistics for each cell. We summed the t statistics across cells. To generate a p value for the difference in spike activity between conditions, we determined the position of the summed original t statistics in the distribution of summed t statistics calculated from the permuted data.
To assess the significance of the interaction of decision conflict and accuracy and the interaction of decision conflict and laterality on spiking activity, we used a permutation procedure. For every cell, we used an ANOVA to calculate the F statistic of the interaction of the two factors of interest on spiking activity. We then generated a null distribution of F statistics by permuting the trial labels 1000 times and calculating an ANOVA for each permutation. We summed the true and permuted F statistics across cells. To generate a p value for the significance of the interaction, we determined the position of the summed original F statistics in the distribution of summed F statistics calculated from the permuted data.
Results
We measured intraoperative activity of the STN in 14 participants (11 men, 3 women; mean age, 60.9 years; SD, 7.92) undergoing DBS surgery of the STN for Parkinson's disease. We identified STN by anatomic location and by its unique firing pattern, as per protocol during DBS surgery (Jaggi et al., 2004). DBS electrodes were implanted bilaterally in some patients. Hence, some participants completed two experimental sessions, resulting in 18 recordings. We captured microelectrode recordings from STN while participants were awake and engaged in a probability learning and decision task that required them to choose between visual symbols.
The two-stage cognitive task we used in this study involved a probability learning task (training), where participants learned the relative values of abstract visual symbols, followed by a decision task (testing), where participants chose between the symbols by making decisions based on these learned values (Frank et al., 2004, 2007). During training, three pairs of symbols (AB, CD, EF) were constructed and presented in random order on a computer screen (Fig. 1a). We informed participants that one symbol in each pair carried a higher probability of yielding a reward than the other. Participants selected one of the symbols on every trial, and probabilistic feedback followed each choice (see Materials and Methods). The three stimulus pairs were characterized by different relative reward rates that were assigned randomly and fixed throughout the experiment. Over the course of training [on average, 120.7 total trials (SE = 0.94), corresponding to ∼40 trials per stimulus pair], participants exhibited a significant improvement in accuracy for the AB symbol pairs between the first (median accuracy, 0.64) and final (median accuracy, 0.75) blocks of training (Wilcoxon U(18) = 2.59; p = 0.009; Fig. 2a). The smaller differences in a priori reward rates for the CD and EF symbol pair led to smaller, non-statistically significant improvements in accuracy during training.
Our analysis of STN activity focused on the subsequent testing phase of the experiment (Fig. 1b), when decisions were informed by the relative values learned during training. During this testing phase, participants were presented with combinations of all symbols, including novel combinations, and instructed to choose one of the two symbols presented on each trial (15 symbol pairs per experiment). No feedback indicating whether the choice was correct was presented after each selection, preventing participants from updating the reward expectation associated with each symbol that they learned during training and keeping the level of decision conflict for each individual symbol pair constant throughout the decision task. Each pair was presented up to 12 times in random order. Participants completed 153.7 trials on average (SE = 11.7) during the testing phase of the experiment. As expected, accuracy during the final block of training predicted accuracy in the subsequent testing phase (b = 0.45; p = 0.0013; r = 0.7; Fig. 2b).
We inferred participants' learning of the reward probabilities associated with the different symbols from their choice responses in the last training block (see Materials and Methods). If a participant bases their test-phase decisions on their learned reward expectations, rather than a priori probabilities, then for every symbol pair presented during testing, the participant should select the symbol with the higher reward expectation. Consistent with this prediction, the difference in reward expectations for each symbol pair was significantly correlated with testing accuracy across the 18 experimental sessions (t(17) = 3.35; p = 0.004; mean r = 0.31; SE = 0.09; p < 0.001, permutation test; Fig. 2c).
Depending on the difference in reward expectation of each symbol pair, each trial during testing can then be characterized by a level of decision conflict. Low decision conflict occurs during trials with symbols having a large difference in reward expectation, whereas high decision conflict occurs during trials with symbols having a small difference in reward expectation. As expected, response time during the testing phase was significantly and negatively correlated with the difference in reward expectation (t(17) = −2.28; p = 0.036; mean r = −0.17; SE = 0.07; p = 0.004, permutation test), suggesting that the difference in reward expectation is an appropriate surrogate for decision conflict.
We extracted single-unit activity captured from STN microelectrode recordings while participants engaged in the decision task during testing to find 38 uniquely identified spike clusters (2.1 clusters per recording; SE = 0.29). Average recorded waveforms and a histogram of interspike intervals from one spike cluster are shown in Figure 1c. We excluded spike clusters with median firing rates below 1 Hz from our analysis, under the assumption that they were incorrectly identified as independent spike clusters. We thus retained a total of 27 spike clusters, henceforth referred to as cells, yielding a mean of 1.5 cells per recording (SE = 0.31) for our analysis.
Representative spike activity recorded from a single STN cell in a single participant during the decision task, time locked to the presentation of symbol pairs, is shown in Figure 3a. There is a clear increase in spike activity around 200 ms following the presentation of symbol pairs (t = 0). Spike activity across all recorded cells confirmed this response (Fig. 3b). Following the presentation of symbol pairs, as participants initiated the decision process, there was a consistent and significant increase in spike activity between 100 and 400 ms compared to baseline activity (t(26) = 2.04; p = 0.05; SE = 0.057; t test across cells; p < 0.001, permutation test).
If the STN tracks decision conflict, as suggested by computational models (Gurney et al., 2001; Frank, 2006; Humphries et al., 2006; Bogacz and Gurney, 2007), then we would predict that spike activity would increase as the difference in reward expectations between symbols became smaller, or as decision conflict became larger. To visualize this prediction, we divided the difference in reward expectations, and hence decision conflict, into three equally sized bins and plotted the average pooled spiking activity for trials with the highest and lowest decision conflict (Fig. 3c). The increase in spike activity following stimulus presentation appears greater for trials associated with high decision conflict than with trials associated with low decision conflict.
To confirm this difference, we averaged spike activity between 100 and 400 ms after stimulus presentation for every level of decision conflict associated with each of the 15 symbol pairs presented during testing. We found that spike activity during this period after stimulus presentation was significantly correlated with decision conflict (t(26) = 2.92; p = 0.007; mean r = 0.15; SE = 0.05; p = 0.004, permutation test; Figure 3d). When we divided decision conflict into three equally sized bins (five symbol pairs per bin corresponding to high, medium, and low decision conflict), we again found a significant correlation between spike activity during this period and the level of decision conflict (t(26) = 3.73; p = 0.0009; mean r = 0.36; SE = 0.09; p < 0.001, permutation test; Figure 3e). We did not find a significant relationship between spike activity and decision conflict for any other temporal epoch (p > 0.1). Models that predict STN spike activity increases with decision conflict also predict that STN translates conflict into behavioral slowing (Frank, 2006; Bogacz and Gurney, 2007). Consistent with this prediction, we also found a significant correlation between spike activity 100 to 400 ms after stimulus presentation and response time (t(26) = 2.26; p = 0.03; mean r = 0.12; SE = 0.05; p = 0.016, permutation test).
If spike activity is significantly correlated with the level of decision conflict, we would expect significantly greater spike activity during high conflict trials compared to low conflict trials. To confirm this difference, we averaged spike activity between 100 and 400 ms after stimulus presentation and found a consistent and statistically significant difference between spike activity associated with high and low decision conflict (t(26) = 2.36; p = 0.026; SE = 0.053; p = 0.008, permutation test; Fig. 3e). Spike activity associated with high decision conflict was also significantly greater than activity associated with medium decision conflict (t(26) = 2.71; p = 0.013; SE = 0.041; p = 0.005, permutation test), although spike activity associated with medium decision conflict was not significantly different than that associated with low decision conflict (t(26) = −0.90; p = 0.376; SE = 0.55; p = 0.94, permutation test).
We examined whether the correlation between spiking activity and decision conflict was modulated by the accuracy of choice. We identified trials when participants chose symbols with the higher a priori probability as accurate choices. Overall, spike rates were not significantly higher during accurate choices than inaccurate choices during the period between 100 and 400 ms after stimulus (t(26) = 0.136, p = 0.45; SE = 0.05; p = 0.44, permutation test). During accurate choices, however, spike activity during this period was significantly correlated with decision conflict (t(26) = 2.39; p = 0.024; mean r = 0.13; SE = 0.05; p = 0.016, permutation test), while during inaccurate choices, there was not a significant correlation between spiking activity and decision conflict (t(26) = 1.18; p = 0.25; mean r = 0.11; SE = 0.09; p = 0.082, permutation test). Confirming that accuracy modulates the relation between decision conflict and STN spiking activity, we found a significant interaction between accuracy and decision conflict in determining spike activity (p = 0.013, permutation test).
To assess whether the level of decision conflict, and hence spiking activity, may be related to the total evidence of reward associated with each symbol pair instead of the difference in reward expectations, we examined conflict in the context of approach versus aversive cues. We assigned each symbol as a win (approach cue) if its a priori probability was >0.5, and as a loss (aversive cue) if its a priori probability was <0.5 (Frank et al., 2007). In this paradigm, win/win symbol pairs carry the most evidence of reward and represent the highest level of decision conflict (Gurney et al., 2001; Bogacz and Gurney, 2007). We also performed the same analysis when we assigned approach and aversive cues based on reward expectations, rather than a priori probabilities. In both cases, we found no significant differences in response time or in spike activity between 100 and 400 ms after stimulus onset between win/win trials, loss/loss trials, and win/loss trials (t(26) = 0.57; p = 0.57; SE = 0.11; p = 0.37, permutation test).
Because cortical models of action selection emphasize firing rates at the moment of action, and because the STN has traditionally been implicated in motor control, we investigated spiking rates for all cells time locked to the moment of selection, when participants pressed the left or right button (Fig. 4a). The mean response time across all experimental sessions between the presentation of stimuli and button press was 1660 ms (SE = 174 ms). During the 300 ms window immediately preceding the moment of selection, there remained a significantly higher level of spike activity compared to baseline (t(26) = 2.31; p = 0.028; SE = 0.051; p < 0.001, permutation test). Spike activity decreased as participants made their selection.
We designated trials recorded from the right STN as ipsilateral when the right button was selected, and contralateral when the left button was selected. During this 300 ms window, there was greater spike activity during trials involving contralateral button presses compared to trials involving ipsilateral selections (t(26) = 2.45; p = 0.021; SE = 0.052; p = 0.019, permutation test; Fig. 4b,c). Notably, although decision conflict modulates spiking activity immediately after stimulus onset, there was no significant correlation between spike activity and decision conflict during this period before the button press (t(26) = −1.16; p = 0.25; mean r = −0.06; SE = 0.05; p = 0.12, permutation test). Because no feedback was presented, not surprisingly, we also found no relationship between decision conflict and spike activity at the end of the trial after selection, when inferred rewards would have been signaled (t(26) = −0.84; p = 0.41; mean r = −0.05; SE = 0.06; p = 0.82, permutation test). Conversely, laterality not only affected spike rates immediately before the button press, but contralateral trials also exhibited a marginally significant increase in spiking activity compared to ipsilateral trials during the 100 to 400 ms window following stimulus presentation (t(26) = 1.82; p = 0.08; SE = 0.047; p = 0.005, permutation test). The effect of the interaction between laterality and decision conflict on spike activity during this period, however, was not significant (p = 0.38, permutation test).
Discussion
Using microelectrode recordings, we found an increase in single-unit STN activity when participants engaged in a decision, with STN activity increasing with the degree of decision conflict. Direct evidence of the relationship between STN spiking activity and decision conflict has been lacking despite computational models hypothesizing the presence of such a mechanism (Redgrave et al., 1999; Frank, 2006; Bogacz and Gurney, 2007). Previous evidence has been limited to imaging studies demonstrating increased STN activity with task complexity (Lehericy et al., 2006; Aron et al., 2007), and studies demonstrating increased theta oscillatory activity in human participants during conflictual decisions (Fumagalli et al., 2010; Cavanagh et al., 2011). The ability to directly measure STN spiking activity in humans undergoing DBS surgery here enabled us to directly demonstrate that STN spiking activity tracks the level of decision conflict as had been predicted by computational models and by indirect experimental evidence (Baunez et al., 2001; Desbonnet et al., 2004; Frank et al., 2007).
In our study, we defined decision conflict based on the difference in reward expectations, hence equating conflict with difficulty. Our analysis of response times suggests that such a paradigm captures decision conflict. We found no clear relationship between reward rates and accuracy or between decision conflict and spiking activity when we used a priori probability rates, rather than the inferred reward expectation, to determine decision conflict. We also examined decision conflict in the context of approach and aversive cues (Frank et al., 2007) and found that trials involving decisions between symbols with high reward associations (win/win) did not exhibit significantly greater spiking activity than decisions between symbols with low reward associations (loss/loss). These analyses suggest that learning dictates choice in the decision task, and that the difficulty of choice, rather than approach or aversive cues, is the primary mediator of STN activity.
Notably, we found that the relationship between STN spike activity and decision conflict was modulated by choice accuracy and was absent during inaccurate choices. Accurate trials may simply reflect greater attentional resources exhibited by participants who were fully engaged in the task, whereas inaccurate trials may reflect either uninformed guessing, generating no response conflict before decision, or drifting attention. However, if STN activity serves to adjust decision thresholds (Ratcliff and Frank, 2012), then the observed interaction between accuracy and decision conflict suggests that STN activity slows responses during high conflict trials to increase accuracy.
The increases in STN spiking activity observed here occur around 200 ms after stimulus presentation. Previously observed changes in low frequency oscillatory power captured through local field potentials, which may reflect synaptic inputs, demonstrate a similar time course (Cavanagh et al., 2011). Furthermore, as with STN spiking activity, midfrontal scalp EEG activity (Cavanagh et al., 2011) also correlates with behavioral slowing during high conflict decisions, suggesting that both regions are involved in response conflict. Hence, the time course observed here may reflect not only the time to process visual information, but additionally the time to relay that information in the form of decision conflict from cortical to subcortical structures.
Consistent with existing hypotheses for the role of STN in motor control, we identified elevated STN activity before the moment of action and higher for contralateral compared to ipsilateral button presses. The elevated activity supports the notion that the STN transmits an inhibitory hold signal to the contralateral side until the moment of action. Decision conflict does not differentiate activity during this period, which occurs, on average, over 1 s after presentation of the stimuli, suggesting that by this point the decision has been made and spiking activity may simply reflect the motor component of the task. On the other hand, in the early stages of the decision period, activity is primarily determined by the level of decision conflict. During this period, laterality also affects spiking activity, but our results do not disentangle decision conflict related to choice valuation from response conflict related to competing motor commands in the STN (Pochon et al., 2008). These issues suggest that further studies on the role of STN in decision processes are warranted.
Although our data demonstrate that spike activity during the decision task is modulated by the level of decision conflict, our experimental setup does suffer from a number of limitations. First, the current study investigates activity of the STN in the intraoperative environment. This set up limits the number of trials we can record for each spike cluster, which in turn limits the power for analyses at the individual cell level. We focus our statistical analysis instead on the population response. Despite this limitation, however, we find these effects to be consistent across the population. Second, spiking rates in our data appear lower than those demonstrated in previous recordings of dorsal STN activity captured during DBS surgery. The lower spike rates observed here may reflect the physiological profile of the ventral subdivision of the STN, they may reflect decreased spiking activity in the STN during a cognitive task, or they may reflect incomplete spike acquisition during spike sorting due to variations in action potential height related to the cardiac cycle. Although further studies are needed to explore this discrepancy, the fact that spiking activity recorded here does demonstrate a significant relationship with decision conflict still demonstrates the role the STN may play in mediating decision processes. Finally, given our experimental paradigm, all data recorded here are captured from the STN of Parkinson's patients. Although these patients exhibit abnormalities in basal ganglia function, the patients selected for our study exhibited normal range cognitive function and were able to demonstrate learning in a complex probabilistic task. Our data suggests that the relationship between decision conflict and STN spiking activity may also exist in the normal population.
Our data support computational and theoretical models that suggest that the basal ganglia play an important role in decision processes. There is substantial evidence for cortically based action selection, especially in the context of sensorimotor tasks (Shadlen and Newsome, 2001; Gold and Shadlen, 2007). For example, when animals are trained to saccade in response to the coherent movement of dots, electrical stimulation of frontal eye fields during the decision period results in eye movements toward choice targets, suggesting that some form of action selection is encoded directly in sensory and motor cortical areas (Gold and Shadlen, 2002, 2007). That STN activity tracks decision conflict in our data does not contradict these findings, but instead suggests that STN activity may participate in decisions by adjusting the process of evidence integration.
The notion that the basal ganglia can participate in action selection is compelling for several reasons. For one, such a functional architecture reduces the number of reciprocal connections needed to convert valuation to action selection across multiple cortical areas (Redgrave et al., 1999; Frank, 2006; Bogacz and Gurney, 2007; Bogacz, 2007). Second, in the event that an organism is selecting between multiple possibilities, action selection mediated by a central mechanism simplifies the decision process (McMillen and Holmes, 2006; Bogacz and Gurney, 2007). Third, it is possible that a centrally mediated action selection circuit can more readily adjust decision thresholds dynamically. STN activity may thus set a level of inhibition that must be exceeded to proceed with a designated action. And fourth, that STN activity in our study tracks decision conflict in a cognitive task that involves a learning and decision component suggests that the STN′s role in action selection may be generalizable to other abstract decision processes (Doya, 2008; Rangel et al., 2008; Kable and Glimcher, 2009).
Footnotes
This work was supported in part by NIH Grants K99NS067241-01 and MH55687 and by the Dana Foundation. We thank M. Kerr, K. McGill, and the staff of the Pennsylvania Neurological Institute for their invaluable help in coordinating patient recruitment for this study and for conducting preoperative and postoperative testing. We also thank J. Kable and J. Jacobs for insightful comments on this manuscript.
The authors declare no competing financial interests.
References
- Aron AR, Behrens TE, Smith S, Frank MJ, Poldrack RA. Triangulating a cognitive control network using diffusion-weighted magnetic resonance imaging (MRI) and functional MRI. J Neurosci. 2007;27:3743–3752. doi: 10.1523/JNEUROSCI.0519-07.2007. [DOI] [PMC free article] [PubMed] [Google Scholar]
- Baunez C, Lardeux S. Frontal cortex-like functions of the subthalamic nucleus. Front Syst Neurosci. 2011;5:83. doi: 10.3389/fnsys.2011.00083. [DOI] [PMC free article] [PubMed] [Google Scholar]
- Baunez C, Humby T, Eagle DM, Ryan LJ, Dunnett SB, Robbins TW. Effects of STN lesions on simple vs choice reaction time tasks in the rat: preserved motor readiness, but impaired response selection. Eur J Neurosci. 2001;13:1609–1616. doi: 10.1046/j.0953-816x.2001.01521.x. [DOI] [PubMed] [Google Scholar]
- Bogacz R. Optimal decision-making theories: linking neurobiology with behaviour. Trends Cogn Sci. 2007;11:118–125. doi: 10.1016/j.tics.2006.12.006. [DOI] [PubMed] [Google Scholar]
- Bogacz R, Gurney K. The basal ganglia and cortex implement optimal decision making between alternative actions. Neural Comput. 2007;19:442–477. doi: 10.1162/neco.2007.19.2.442. [DOI] [PubMed] [Google Scholar]
- Cavanagh JF, Wiecki TV, Cohen MX, Figueroa CM, Samanta J, Sherman SJ, Frank MJ. Subthalamic nucleus stimulation reverses mediofrontal influence over decision threshold. Nat Neurosci. 2011;14:1462–1467. doi: 10.1038/nn.2925. [DOI] [PMC free article] [PubMed] [Google Scholar]
- Churchland A, Kiani R, Shadlen MN. Decision-making with multiple alternatives. Nat Neurosci. 2008;11:693–702. doi: 10.1038/nn.2123. [DOI] [PMC free article] [PubMed] [Google Scholar]
- Desbonnet L, Temel Y, Visser-Vandewalle V, Blokland A, Hornikx V, Steinbusch H. Premature responding following bilateral stimulation of the rat subthalamic nucleus is amplitude and frequency dependent. Brain Res. 2004;1008:198–204. doi: 10.1016/j.brainres.2004.02.032. [DOI] [PubMed] [Google Scholar]
- Doya K. Modulators of decision making. Nat Neurosci. 2008;11:410–416. doi: 10.1038/nn2077. [DOI] [PubMed] [Google Scholar]
- Frank M. Hold your horses: a dynamic computational role for the subthalamic nucleus in decision making. Neural Netw. 2006;19:1120–1136. doi: 10.1016/j.neunet.2006.03.006. [DOI] [PubMed] [Google Scholar]
- Frank M, Seeberger L, O'Reilly R. By carrot or by stick: cognitive reinforcement learning in parkinsonism. Science. 2004;306:1940–1943. doi: 10.1126/science.1102941. [DOI] [PubMed] [Google Scholar]
- Frank M, Samanta J, Moustafa A, Sherman S. Hold your horses: impulsivity, deep brain stimulation, and medication in parkinsonism. Science. 2007;318:1309–1312. doi: 10.1126/science.1146157. [DOI] [PubMed] [Google Scholar]
- Fumagalli M, Giannicola G, Rosa M, Marceglia S, Lucchiari C, Mrakic-Sposta S, Servello D, Pacchetti C, Porta M, Sassi M, Zangaglia R, Franzini A, Albanese A, Romito L, Piacentini S, Zago S, Pravettoni G, Barbieri S, Priori A. Conflict-dependent dynamic of subthalamic nucleus oscillations during moral decisions. Soc Neurosci. 2010;6:243–256. doi: 10.1080/17470919.2010.515148. [DOI] [PubMed] [Google Scholar]
- Gold J, Shadlen M. Banburismus and the brain decoding the relationship between sensory stimuli, decisions, and reward. Neuron. 2002;36:299–308. doi: 10.1016/s0896-6273(02)00971-6. [DOI] [PubMed] [Google Scholar]
- Gold J, Shadlen M. The neural basis of decision making. Annu Rev Neurosci. 2007;30:535–574. doi: 10.1146/annurev.neuro.29.051605.113038. [DOI] [PubMed] [Google Scholar]
- Gurney K, Prescott T, Redgrave P. A computational model of action selection in the basal ganglia. I. A new functional anatomy. Biological cybernetics. 2001;84:401–410. doi: 10.1007/PL00007984. [DOI] [PubMed] [Google Scholar]
- Humphries M, Stewart R, Gurney K. A physiologically plausible model of action selection and oscillatory activity in the basal ganglia. J Neurosci. 2006;26:12921. doi: 10.1523/JNEUROSCI.3486-06.2006. [DOI] [PMC free article] [PubMed] [Google Scholar]
- Jaggi J, Umemura A, Hurtig H, Siderowf A, Colcher A, Stern M, Baltuch G. Bilateral subthalamic stimulation of the subthalamic nucleus in Parkinson's disease: surgical efficacy and prediction of outcome. Stereotactc Funct Neurosurg. 2004;82:104–114. doi: 10.1159/000078145. [DOI] [PubMed] [Google Scholar]
- Kable JW, Glimcher PW. The neurobiology of decision: consensus and controversy. Neuron. 2009;63:733–745. doi: 10.1016/j.neuron.2009.09.003. [DOI] [PMC free article] [PubMed] [Google Scholar]
- Kiani R, Hanks T, Shadlen M. Bounded integration in parietal cortex underlies decisions even when viewing duration is dictated by the environment. J Neurosci. 2008;28:3017–3029. doi: 10.1523/JNEUROSCI.4761-07.2008. [DOI] [PMC free article] [PubMed] [Google Scholar]
- Kim J, Shadlen M. Neural correlates of a decision in the dorsolateral prefrontal cortex of the macaque. Nat Neurosci. 1999;2:176–185. doi: 10.1038/5739. [DOI] [PubMed] [Google Scholar]
- Lehericy S, Bardinet E, Tremblay L, de Moortele PV, Pochon J, Dormont D, Kim D, Yelnik J, Ugurbil K. Motor control in basal ganglia circuits using fMRI and brain atlas approaches. Cereb Cortex. 2006;16:149–161. doi: 10.1093/cercor/bhi089. [DOI] [PubMed] [Google Scholar]
- Mazurek M, Roitman J, Ditterich J, Shadlen MN. A role for neural integrators in perceptual decision making. Cereb Cortex. 2003;13:1257–1269. doi: 10.1093/cercor/bhg097. [DOI] [PubMed] [Google Scholar]
- McMillen T, Holmes P. The dynamics of choice among multiple alternatives. J Math Psychol. 2006;50:30–57. [Google Scholar]
- Moyer J, Danish S, Keating G, Finkel L, Baltuch G. Implementation of dual simultaneous microelectrode recording systems during deep brain stimulation surgery for Parkinson's disease: technical note. Oper Neurosurg [Suppl I] 2007;60:E177–E178. doi: 10.1227/01.NEU.0000249250.40676.7E. [DOI] [PubMed] [Google Scholar]
- Parent A, Hazrati L. Functional anatomy of the basal ganglia: the place of the subthalamic nucleus and external pallidum in basal ganglia circuitry. Brain Res Rev. 1995;20:128–154. doi: 10.1016/0165-0173(94)00008-d. [DOI] [PubMed] [Google Scholar]
- Pochon J, Riis J, Sanfey A, Nystrom L, Cohen J. Functional imaging of decision conflict. J Neurosci. 2008;28:3468–3473. doi: 10.1523/JNEUROSCI.4195-07.2008. [DOI] [PMC free article] [PubMed] [Google Scholar]
- Quiroga Q, Nadasdy Z, Ben-Shaul Y. Unsupervised spike detection and sorting with wavelets and superparamagnetic clustering. Neural Comput. 2004;16:1661–1687. doi: 10.1162/089976604774201631. [DOI] [PubMed] [Google Scholar]
- Rangel A, Camerer C, Montague P. A framework for studying the neurobiology of value-based decision making. Nat Rev Neurosci. 2008;9:545–556. doi: 10.1038/nrn2357. [DOI] [PMC free article] [PubMed] [Google Scholar]
- Ratcliff R, Frank M. Reinforcement-based decision making in corticostriatal circuits: mutual constraints by neurocomputational and diffusion models. Neural Comput. 2012 doi: 10.1162/NECO_a_00270. in press. [DOI] [PubMed] [Google Scholar]
- Redgrave P, Prescott T, Gurney K. The basal ganglia: a vertebrate solution to the selection problem? Neuroscience. 1999;89:1009–1024. doi: 10.1016/s0306-4522(98)00319-4. [DOI] [PubMed] [Google Scholar]
- Schall J. Neural basis of deciding, choosing and acting. Nat Rev Neurosci. 2001;2:33–42. doi: 10.1038/35049054. [DOI] [PubMed] [Google Scholar]
- Shadlen M, Newsome W. Neural basis of a perceptual decision in the parietal cortex (area LIP) of the rhesus monkey. J Neurophysiol. 2001;86:1916–1936. doi: 10.1152/jn.2001.86.4.1916. [DOI] [PubMed] [Google Scholar]
- Wang XJ. Decision making in recurrent neuronal circuits. Neuron. 2008;60:215–234. doi: 10.1016/j.neuron.2008.09.034. [DOI] [PMC free article] [PubMed] [Google Scholar]