Abstract
We critically examined a series of exact kinetic models for their ability to describe binding of a typical α-helical amphipathic peptide to lipid bilayers. Binding of the model peptide lysette-26 was measured through fluorescence resonance energy transfer from a Trp residue on the peptide to a fluorescently-labeled acceptor lipid included in vesicles composed of 1-palmitoyl-2-oleoyl-sn-glycero-3-phosphocholine. Experimental data was collected varying peptide and lipid concentrations over an order of magnitude. The kinetic models were fit to all the experimental data simultaneously. Of the four models examined, the simplest one that is sufficient to correctly describe the experimental data includes two coupled equilibria, one between peptide monomers in solution and bound to the lipid membrane, and a second one between lipid–bound peptides that oligomerize to form dimers. We found that individual kinetic binding curves are insufficient to distinguish among kinetic models of peptide binding to lipid bilayers, but that a number of models can be excluded based on inspection of a simple set of experiments.
Keywords: amphipathic peptides, α-helical peptides, antimicrobial peptides, peptide binding, kinetics of binding, peptide folding, lipid vesicles, LUV
INTRODUCTION
Peptide-membrane interactions occur widely in biological systems. For many amphipathic peptides, binding to the lipid bilayer is the first committed step in a series of events that lead to membrane perturbation or peptide translocation. The early bilayer-associated states are usually short-lived, and their formation depends on both peptide and lipid structure. Thus, the interpretation of structure-function analyses must include kinetic studies that are able to characterize transient states. Moreover, the attribution of kinetic phases to molecular events requires the solution and testing of exact kinetic models.
The importance of the initial peptide binding to the membrane-water interface in the interpretation of peptide activity has been recognized, and a number of models have been proposed and studied qualitatively or semi-quantitatively (1–9). However, the suggested models tend to neglect second-order effects, such as peptide oligomerization in solution or on the membrane. Although scarce, exact kinetic models have been used to characterize peptide–membrane and protein–membrane interactions (10–12). The processes studied, however, are more complex than binding of antimicrobial or cytolytic peptides to lipid bilayers or involve peptides that insert irreversibly, and for which intermediate states have been shown to exist by independent methods (13). The goal of the current work is to present a rigorous approach to evaluate and contrast the merits of different kinetic models of peptides binding, which has not been previously attempted.
Linear, amphipathic peptides are often largely unstructured in solution, and peptide binding to the membrane is accompanied by rapid folding to an α-helix at the membrane–water interface (14, 15). If binding is well separated in time from all subsequent events, the kinetics of peptide binding should follow simple first-order kinetics. However, in many cases, binding kinetics of α-helical peptides to lipid vesicles have been found to deviate significantly from single exponential behavior, to a degree that depends on the actual peptide studied and experimental conditions. We chose to study the binding of lysette-26, a shortened sequence variant of staphylococcal δ-lysin. Lysette-26 is a model peptide that captures the behavior of cationic, α-helical peptides, and, like most members of this family, has a tendency to aggregate in aqueous solution beyond a certain concentration, but is largely unstructured at low peptide concentrations (15). It preferentially binds to anionic lipid membranes, and causes release of content from lipid vesicles. Lysette-26 was selected for its ability to efficiently bind to zwitterionic 1-palmitoyl-2-oleoyl-sn-glycero-3-phosphocholine (POPC) bilayers, while being more water-soluble than the parent peptide. Using single-component lipid vesicles has the advantage that secondary effects caused by peptide-induced demixing of lipid species in multi-component bilayers are avoided, as is vesicle aggregation, which is promoted by cationic peptides in the presence of anionic lipids.
We considered several plausible models of peptide binding to lipid bilayers. Of those examined, a simple two-step model, consisting of peptide binding to the membrane followed by oligomerization to a dimer, was sufficient to describe the experimental data. We also show that a single kinetic trace of peptide binding to a lipid bilayer is insufficient to discriminate among kinetic models. However, the solutions to the exact models allow accurate predictions of experimental kinetic data as a function of both peptide and lipid concentration. Thus, if binding of peptides is measured under those conditions, a number of kinetic models can be easily excluded.
EXPERIMENTAL METHODS
Chemicals
1-Palmitoyl-2-oleoyl-sn-glycero-3-phosphocholine (POPC) and 1-palmitoyl-2-oleoyl-sn-glycero-3-phosphoethanolamine (POPE) were purchased from Avanti Polar Lipids (Alabaster, AL). 7-Methoxycoumarin (7-MC) was purchased as the succinimidyl ester from Invitrogen (Carlsbad, CA). 1-Palmitoyl-2-oleoyl-sn-glycero-3-phosphoethanolamine-N-(7-methoxycoumarin) (7MC-POPE), POPE labeled with 7MC through an amide bond to the amino group of the ethanolamine headgroup, was synthesized as previously described (16). Organic solvents (High performance Liquid Chromatography/American Chemical Society grade) were purchased from Burdick & Jackson (Muskegon, MI). Lipids and probes were tested by TLC and used without further purification. Lysette-26 (IISTIGDWVKLIIDTVNKFTKK) was custom synthesizd by New England Peptide LLC (Gardner, MA) at 95% purity. Stock solutions of lysette-26 were prepared by dissolving lyophilized peptide in distilled water at a final concentration of about 200 µM and stored at −80°C. The peptide concentration of the stock solution was determined precisely by measuring the absorbance at 280 nm, and using a molar extinction coefficient of tryptophan of 5600 M−1cm−1.
Preparation of large unilamellar vesicles
Large unilamellar vesicles (LUVs) were prepared by mixing the lipids in chloroform in a round-bottom flask. For vesicles containing 7MC-POPE, the probes were added to the lipid in chloroform solution at a final probe concentration of 2 mol%. The solvent was rapidly evaporated using a rotary evaporator (Büchi R-3000, Flawil, Switzerland) at 60°C. The lipid film was then placed under vacuum for a minimum of 4 hours and hydrated by the addition of buffer containing 20 mM MOPS, pH 7.5, 0.1 mM EGTA, 0.02% NaN3, and 100 mM KCl. The suspension of multilamellar vesicles was subjected to five freeze-thaw cycles, and then extruded 10 × through two stacked polycarbonate filters of 0.1 µm pore size (Nuclepore, Whatman, Florham, NJ), using a water-jacketed high pressure extruder (Lipex Biomembranes, Vancouver, Canada) at room temperature. Lipid concentrations were assayed by the Bartlett phosphate method (17), modified as previously described (18).
Circular Dichroism (CD)
CD spectra of lysette-26 in solution and bound to POPC vesicles were obtained on a Chirascan CD spectrometer (Applied Photophysics, Leatherhead, Surrey, U.K.), in a 0.1 cm pathlength quartz cuvet (Starna Cells Inc, Atascadero, CA). All CD spectra were taken in 10 mM phosphate buffer, pH 7.5. The CD spectrum of lysette-26 in buffer was taken at a peptide concentration of 2 µM. The spectrum of the peptide bound to POPC was taken at a peptide concentration of 10 µM and a lipid concentration of 1 mM, using a LUV suspension. Lysette-26 is fully bound at this lipid concentration. The use of concentrated LUV suspensions in CD measurements has been discussed in detail and shown to yield accurate results (19). A lipid baseline spectrum was subtracted from all peptide spectra and the resulting trace smoothed in Chirascan Pro-Data, maintaining random residuals. Fractional helicities were determined according to Luo and Baldwin (20). The fractional helicity (fH) of a peptide is
| (1) |
where Θobs is the measured helicity. The helicity of the random coil (ΘC) was set to 1500, and ΘH, the helicity of the complete helix was calculated according to
| (2) |
The number of residues is given by Nres, T is the temperature in degrees Celsius, x = 2.5, and ΘH(0) = −44000 (20).
Kinetics of lysette-26 binding to lipid vesicles
Peptide working solutions were prepared by diluting the concentrated stock solutions in buffer containing 20 mM MOPS, pH 7.5, 0.1 mM EGTA, 100 mM KCl, and 0.02% NaN3. The kinetics of association of lysette-26 with LUVs were recorded on an Applied Photophysics SX.18MV stopped-flow fluorimeter (Leatherhead, Surrey, UK) at room temperature. Fluorescence resonance energy transfer (FRET) between the intrinsic Trp residue of lysette-26 and 7MC-POPE incorporated in the lipid membrane was used to monitor peptide binding and dissociation from LUVs (21). The Trp residue was excited at 280 nm through a monochromator using a slit width of 1 mm. Energy transfer to 7MC-POPE, which absorbs maximally at 348 nm, was monitored by measuring the emission of 7MC-POPE (λmax 396 nm) through a GG-385 long-pass filter (Edmund Industrial Optics, Barrington, NJ). Peptide binding leads to an increase in fluorescence emission from the lipid acceptor, which was monitored as a function of time.
MODELS
In the simplest possible case, binding of a peptide monomer to a lipid bilayer occurs in a single reversible step from solution to the membrane-water interface:
| (3) |
where Ps refers to the peptide in solution, L to the lipid vesicles, and Pb to the lipid-bound peptide. The number of lipid vesicles remains constant throughout the experiment since multiple peptides can bind to the same vesicle, and the lipid concentration is chosen so that it is in excess. Under these conditions, peptides bind independent of how many peptides are already bound and binding becomes a pseudo first-order process. The appearance of the membrane-bound peptide (Pb) will follow a single-exponential time course with an apparent rate constant of binding, kapp = konL + koff, where kon and koff are the microscopic rate constants for binding and desorption from the bilayer. For this simple scenario, the apparent rate constant of binding should depend only on lipid but not on peptide concentration. In many cases, however, peptide binding is not well described by a single exponential which is a clear indication that binding is not described by the simple equilibrium in equation 3.
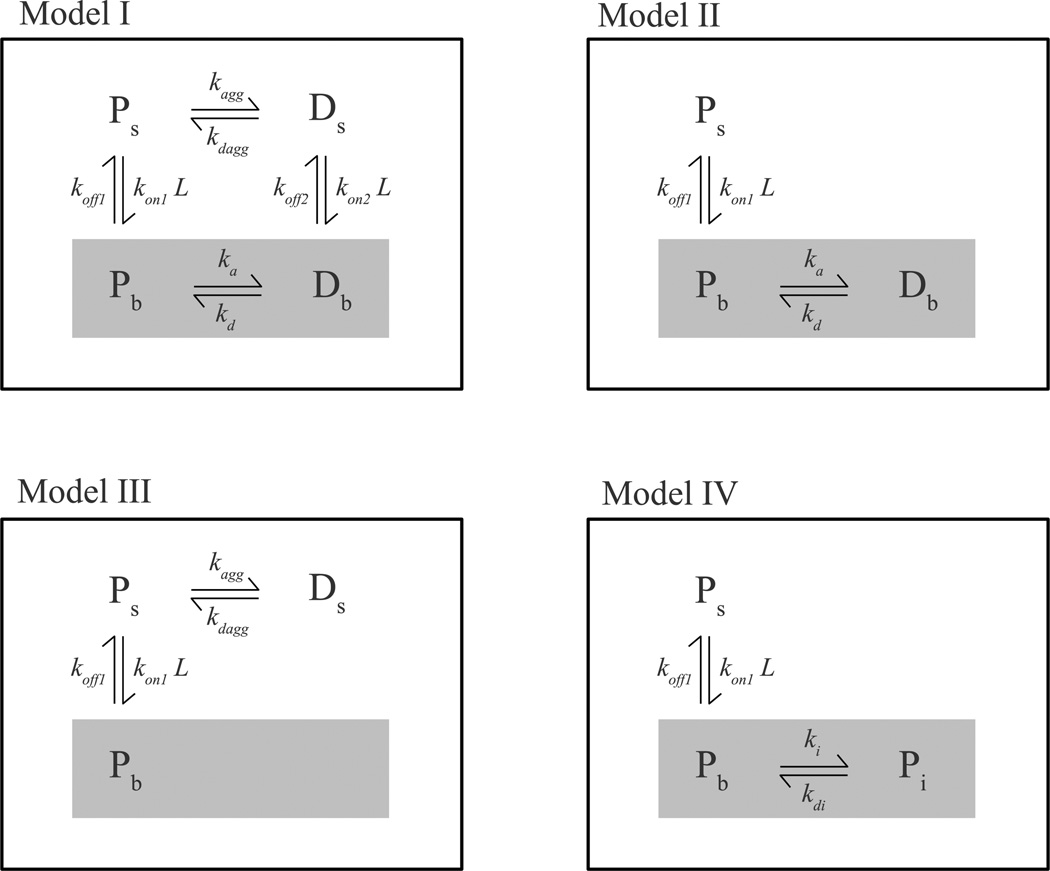
Four models (I–IV) were considered to describe peptide binding to lipid bilayer membranes (Figure 1). The models were formulated as sets of coupled differential equations, which were solved by numerical integration with a fifth-order Runge-Kutta method with constant step size (22). The numerical solutions were directly fit to the experimental data with a simplex algorithm (22). The quality of the fits was evaluated using a χ2 test.
FIGURE 1.
Models I through IV used to describe the experimental data. See text for a complete description. The shaded areas highlight membrane-associated states.
Model I, the complete model, is described by the following set of differential equations:
| (4) |
| (5) |
| (6) |
| (7) |
where Ps are peptide monomers and Ds, peptide dimers, both in solution. Pb and Db are peptide monomers and dimers bound to the bilayer, and L the lipid concentration (peptide binding occurs to an entire lipid vesicle; however, we express vesicle concentrations in terms of their lipid concentration, which is the more common practice). The concentrations of all lipid-bound peptide species are expressed relative to the aqueous solution volume, hence the division by L in the last terms of equations 5–6. The initial concentrations of peptide monomers and dimers in solution were calculated as follows. Experimentally, the peptide solution and lipid suspension were allowed to equilibrate at room temperature in the reservoir syringes. The monomer concentration in the reservoir syringes is where Ks = kagg/kdagg and 2Pt, the total peptide concentration in the reservoir syringes. The concentration of peptide dimers in solution in the reservoir syringes, 2Ds, is obtained from 2Ds(0) = Ks(2Ps(0))2. At t = 0, equal volumes of lipid suspension and peptide solution are mixed. The total peptide concentration in the reaction chamber at t = 0 is then halved, equal to Pt, and the initial concentrations of monomer and dimer in solution in the reaction chamber are Ps and Ds. Since Ks is obtained from the fit, the initial concentrations of the solution species were recalculated iteratively until self-consistency was achieved. Model I has seven independent fit parameters (rate constants); the eighth parameter, koff2, was calculated from the other rate constants, using the constraint imposed by the thermodynamic cycle (Figure 1), that where KL = ka/kd, K1 = kon1/koff1, K2 = kon2/kkoff2 and Ks = kagg/kdagg. Thus, koff2 = kon2kaggkoff12kd/(kon12kakdagg). Both membrane-bound states of the peptide were assumed to contribute to the FRET signal. The relative contribution of the dimer was fixed at twice that of the monomer.The fit results were not very sensitive to small changes in the fluorescence yield of the membrane-bound species. Also, including oligomers larger than dimers did not lead to improved fits.
Model II is derived from the complete model I by removing the peptide dimer state in solution (Ds) and the corresponding equilibria. The remaining two equilibria describe binding of the peptide monomer to the bilayer and the subsequent dimerization of the bound monomer (Figure 1). The set of differential equations for the complete model (equations 3–6) was modified accordingly. The initial peptide concentration in solution was set equal to Pt. In model II, the number of independent fit parameters is reduced to four rate constants and the constraint imposed by the thermodynamic cycle is removed. Both the bound monomer and dimer are assumed to contribute to the measured signal.
Model III is also derived from model I, this time by removing the membrane-bound dimer (Db) from the complete thermodynamic cycle (Figure 1). The system is now characterized by an equilibrium between peptide monomers and dimers in solution, and an equilibrium between the peptide monomer in solution and bound to the bilayer. The number of independent parameters is again reduced to four. The initial peptide monomer and dimer concentrations in solution were calculated as described above for model I.
Model IV is a linear scheme without peptide dimers. The peptide monomer in solution is in equilibrium with a lipid-bound monomer, which can undergo a second step (Figure 1). The set of differential equations describing model IV are:
| (8) |
| (9) |
| (10) |
where Pi refers to a state of the peptide formed after binding, such as an inserted or folded peptide monomer. The rate constants for the formation and dissipation of this state are ki and kdi, respectively. The concentration of peptide monomer in solution at t = 0 was set equal to Pt. Model IV has five independent parameters, four rate constants and the relative quantum yield of the final state.
RESULTS
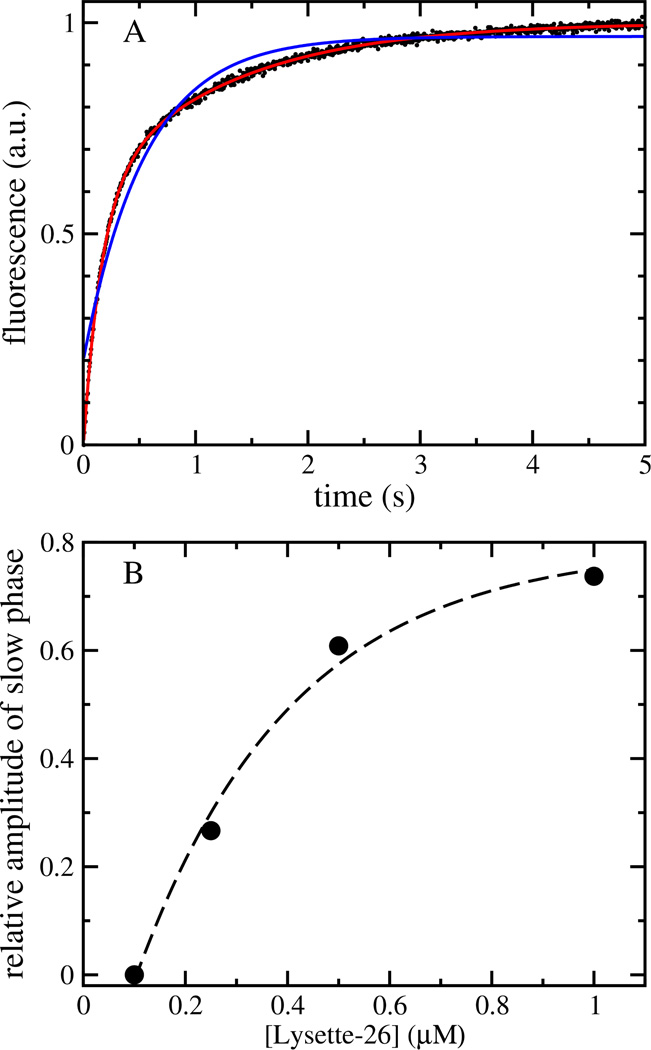
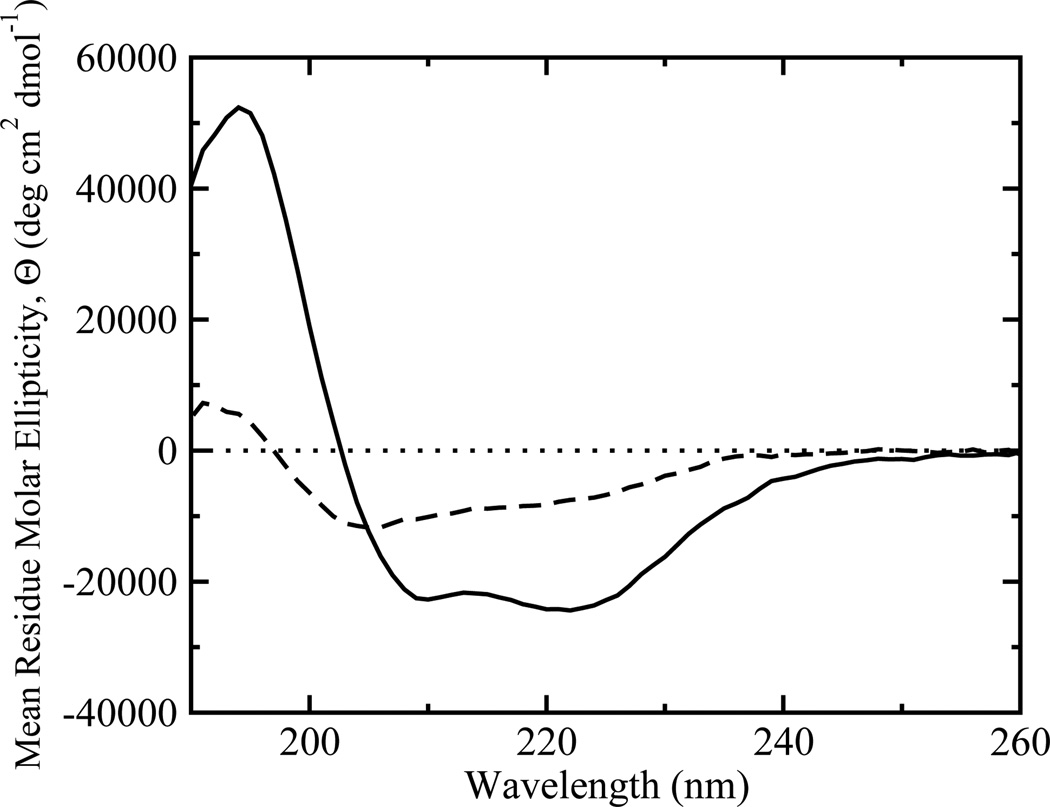
Binding of lysette-26 to POPC vesicles was measured by the increase in the FRET signal as a function of time. The traces often deviate significantly from single-exponential behavior (Figure 2). This means that the simple binding equilibrium described by equation 3 is insufficient to account for the experimental data. At a given lipid concentration, the observed deviation from single-exponential behavior strongly depends on peptide concentration (Figure 2), suggesting the involvement of peptide oligomerization either in solution or on the membrane. Agadir, an algorithm used to predict the structure of monomeric peptides in solution (23, 24), yields a helicity < 1% in solution for monomeric lysette-26. However, CD spectra in buffer indicate a helicity of 20 ± 6 % (Figure 3), suggesting the presence of peptide oligomers in solution, even at low peptide concentrations (2 µM), which could be responsible for the complex kinetics.
FIGURE 2.
Kinetics of lysette-26 binding to POPC LUVs. (A) Increase in the emission of 7MC-POPE as a result of peptide binding to lipid vesicles. Peptide concentration was 1 µM, and the lipid concentration, 100 µM. The experimental data (average of 10 individual traces) is shown as black dots. The blue line is a one-exponential fit, and the red line through the datapoints a two-exponential fit to the data. (B) Relative amplitude of the slower kinetic phase obtained from a two-exponential fit to data collectd as a function of peptide concentration. The data was obtained using a lipid concentration of 50 µM.
FIGURE 3.
Circular dichroism spectra of lysette-26 in solution and bound to POPC LUVs. The dashed line is a spectrum of a 2 µM solution of lysette-26, and the solid line is a spectrum of lysette-26 fully bound to lipid vesicles (10 µM peptide and 1mM lipid).
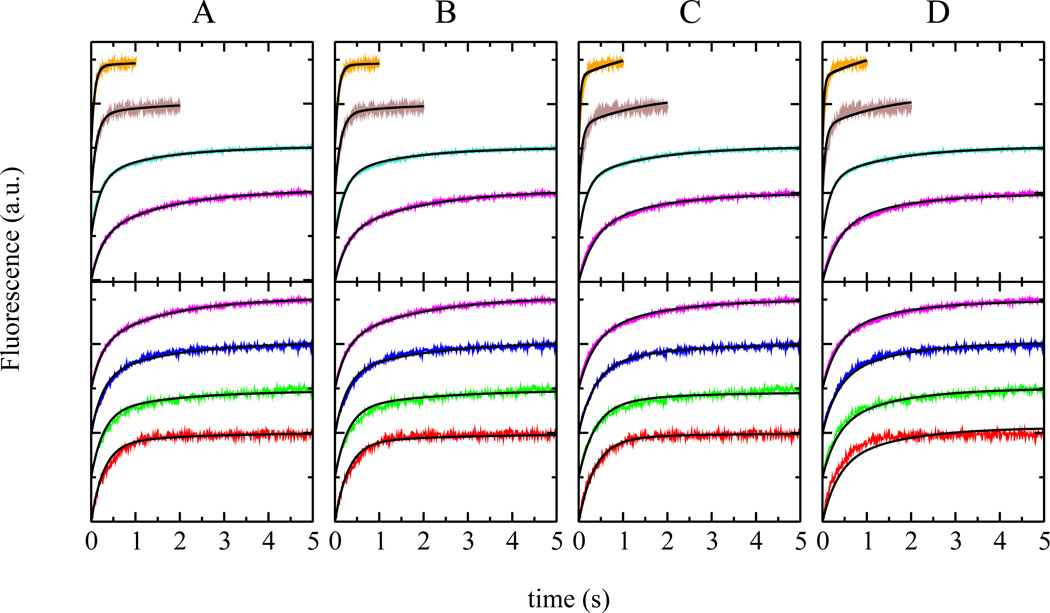
In the following, we describe the results obtained from fitting a series of kinetic models (Figure 1) to the experimental binding kinetics. We begin with a moderately complex but complete model that includes peptide dimerization both in solution and on the membrane. We then proceed to prune this model with the goal to reduce its complexity and thereby identify the essential processes that give rise to the experimental kinetics. Finally, for the sake of completeness, we consider a simple kinetic model that does not involve peptide oligomerization or other second-order effects, but rather an additional process that can be interpreted as a slow folding step or insertion into the bilayer (4, 8, 9). The applicability of each model was judged by its success in fitting the experimental data, varying peptide and lipid concentrations over an order of magnitude. Experimental peptide concentrations varied from 0.1 to 1.0 µM, and lipid concentrations from 50 to 500 µM. This approach significantly constrains the fit parameters, as it calls for the ability to simultaneously describe a range of kinetically complex data. Figure 4 shows experimental binding traces that are essentially single-exponential at low peptide and high lipid concentrations, and traces that deviate significantly from single-exponential behavior at high peptide or low lipid concentrations.
FIGURE 4.
Global fit of models I through IV to the experimental data. (A) model I, (B) model II, (C) model III, (D) model IV. Experimental data are shown in color and the fit curves in black. The top panels show binding data as a function of lipid concentration at a constant peptide concentration of 1µM. Lipid concentrations used were 500 µM (orange, uppermost trace, 10 traces averaged), 250 µM (brown, 10 traces averaged), 100 µM (cyan, 10 traces averaged), and 50 µM (violet, average of 14 individual traces). The lower panels show binding data as a function of peptide concentration at a constant lipid concentration of 50 µM. Peptide concentrations used were 1 µM (violet, 14 traces averaged), 0.5 µM (blue, 29 traces averaged), 0.25 µM (green, 10 traces averaged), and 0.1 µM (red, 85 traces averaged). The curves have been shifted on the y-axis for clarity.
The complete model (I) constitutes a thermodynamic cycle that includes peptide monomers in solution in equilibrium with a peptide dimer, also in solution (Figure 1). Both of these species bind reversibly to the lipid bilayer, where the bound peptide monomer and dimer species are again in equilibrium. The experimental data was obtained in two sets; the first as a function of lipid concentration (Figure 4, top panels), and the second as a function of peptide concentration (Figure 4, bottom panels). The model was fit to all experimental traces simultaneously in a global fit; the results are shown in Figure 4A and summarized in Table 1. The model clearly describes the experimental data well. The rate constant for binding of the dimer, kon2, and the ratio kagg/kdagg = Ks are correlated. In general, good fits were obtained if the value of Ks was such that either the dimer concentration in solution was very small, or its binding to the vesicle (kon2) very slow. This strongly suggests that the solution dimer does not significantly contribute to the fit quality. Including aggregates larger than a dimer did not further improve the quality of the fits.
Table 1.
Results from fitting models I through IV to the experimental data. The experimental and calculated curves for the global fit using the values below are shown in Figure 4. For models I and II the relative error in the rate constants is on the order of 40%.
| Model I | Model II | Model III | Model IV | |
|---|---|---|---|---|
| kon1 (M−1s−1) | 2.2×10⁴ | 2.2×10⁴ | 5.6×10⁴ | 5.9×10⁴ |
| koff1 (s−1) | 2.4 | 2.2 | 0.022 | 7.1×10⁻⁵ |
| kon2 (M−1 s−1) | 0.38 | - | - | - |
| koff2 (s−1) | 3.8×10⁻⁶ | - | - | - |
| kd (s−1) | 0.56 | 0.41 | - | - |
| ka (M−1 s−1) | 65 | 40 | - | - |
| kdagg (s−1) | 0.026 | - | 0.64 | - |
| kagg (M−1 s−1) | 2.7×10³ | - | 1.0×10⁵ | - |
| kdi (s−1) | - | - | - | 0.67 |
| ki (s−1) | - | - | - | 1.1×10⁻³ |
| fmona | 0.76 | - | - | - |
| Χ2 | 0.99 | 1.2 | 1.9 | 2.3 |
fmon is the fraction of monomers in solution at a peptide concentration of 2 µM. It is not a fit parameter but calculated from kdagg and kagg as described in Models
Model II is a simplified model with four independent rate constants that takes only the monomer–dimer equilibrium on the membrane into account and assumes that peptide monomers are the only species in solution (Figure 1). The results from a global fit of model II to the experimental data is shown in Figure 4B. Clearly, this model captures the essential behavior of the experimental binding data as a function of both peptide and lipid concentrations, and the overall fit quality is comparable to the one obtained using model I (Figure 4A). The fit results from model II are also included in Table 1.
Model III is another simplified version of the complete model I (Figure 1). In contrast to model II, however, it includes an equilibrium between peptide monomers and dimers in solution, and reversible binding of the peptide monomer to the lipid bilayer. Figure 4C shows the results from a global fit of model III to the experimental data. The model succeeds in describing the experimental data at low lipid concentrations but fails to account for the gradual loss of the slower kinetic component from the experimental data at higher lipid concentrations.
Model IV does not include peptide oligomerization, or any other higher-order processes (Figure 1). It assumes that the only solution state is a peptide monomer that binds reversibly to the bilayer. The bound monomer then undergoes a second reversible step, which we refer to as insertion. It should be noted that the second step could be interpreted as any process subsequent to binding. The global fit results are shown in Figure 4D. Although the linear model succeeds in describing any individual binding curve, even under conditions where the curve deviates significantly from first-order kinetics, this model fails to accurately account for the experimentally observed behavior over the entire range of lipid and peptide concentrations.
DISCUSSION
The kinetic analysis of peptide binding to lipid bilayers is a powerful tool to determine the mechanism of action, because some intermediate states exist only transiently and are thus not amenable to equilibrium studies (18, 26). Also, kinetic measurements are an effective method to obtain reliable equilibrium constants for the binding of amphipathic peptides to lipid bilayers, because they avoid the use of high peptide concentrations and high peptide-to-lipid ratios used in traditional titration experiments, which may distort the binding isotherm. We show here that if kinetic data are to be used in the construction of models describing peptide binding to lipid bilayers, an exact analysis of kinetic binding experiments is necessary.
Amphipathic, α-helical peptides have a tendency to aggregate or oligomerize, both in solution and on the membrane, to a degree that depends on charge, hydrophobicity, and hydrophobic moment (15). Lysette-26 is no exception to this rule and we have, therefore, explicitly included peptide oligomerization in a description of its binding to lipid bilayers. We showed that model II, a simple two-step model, is sufficient to describe the experimental data globally, although every model tested here was able to fit any single experimental trace shown in Figure 4, contrary to what has been suggested (5, 9). From the observation that model II gives excellent fits to the experimental data, we conclude that oligomerization of lysette-26 in solution is unlikely to contribute to the observed kinetics to a significant degree. The kinetic data are compatible with the interpretation that the major species binding to the bilayer is a monomer. This is interesting because the CD data (Figure 3) show 20% peptide helicity at a peptide concentration of 2 µM, suggesting that about 20% of the peptide is oligomerized in solution. This value coincides, within the error, with the peptide fraction that exists as dimers in solution (1-fmon=0.24) as determined from the fit using model I (Table 1), at the same peptide concentration. Yet, the presence of solution dimers has a negligible effect on the binding kinetics, even at the higher peptide concentrations. This observation allows us to conclude that the solution dimer is unlikely to bind to the bilayer.
The observed deviation from single-exponential binding is thus primarily due to second-order processes taking place on the membrane (oligomerization of membrane-bound peptides), and not to multiple, consecutive kinetic steps. Whether the dimer is, in fact, adsorbed at the membrane–water interface or inserted into the bilayer is impossible to conclude from kinetic data alone. However, the Wimley-White hydrophobicity scale (14) predicts a large, positive Gibbs free energy of transfer from aqueous solution to octanol (which serves as a model for the bilayer interior) for lysette-26, making permanent peptide insertion into the bilayer highly unlikely. This is in contrast to peptide binding to the membrane surface, which is characterized by a favorable Gibbs free energy of binding ΔGo = −RT ln(kon1/koff1) = −3.9 kcal/mol, as calculated from the present data.
Deviation from single-exponential behavior may, of course, be due to other, non–trivial reasons. For instance, we have neglected second-order effects on the membrane caused by bound peptides in the current analysis. Peptides that interact strongly with the lipid bilayer may cause significant distortion, even if transient, of the lipid matrix, possibly leading to time-dependent rate-constants and apparent multi-exponential binding kinetics. However, in the case of lysette-26, the rate of peptide desorption from POPC vesicles is independent of the amount of peptide bound over the ranges of bound-peptide to lipid ratios used here (data not shown). Thus, under the chosen experimental conditions (peptide concentrations, 0.1 to 1.0 µM; lipid concentrations, 50 to 500 µM), secondary effects on the lipid bilayer are probably negligible since the bound peptide-to-lipid ratio was always small, ranging from about 1/150 to 1/1500.
Linear first-order kinetic schemes related to model IV have been frequently used to describe peptide binding to lipid bilayers (3–9, 13). In models of this type, however, it is usually overlooked that the amplitudes associated with the exponential phases are not freely adjustable parameters, but are themselves exact functions of the microscopic rate constants (25). In fact, a closer look at model IV shows that it will give rise to biexponential kinetics only under a very limited set of conditions.
To illustrate this point, consider, for the sake of simplicity, that the back rate-constants are small enough to be negligible. In this case, the model is reduced to
| (11) |
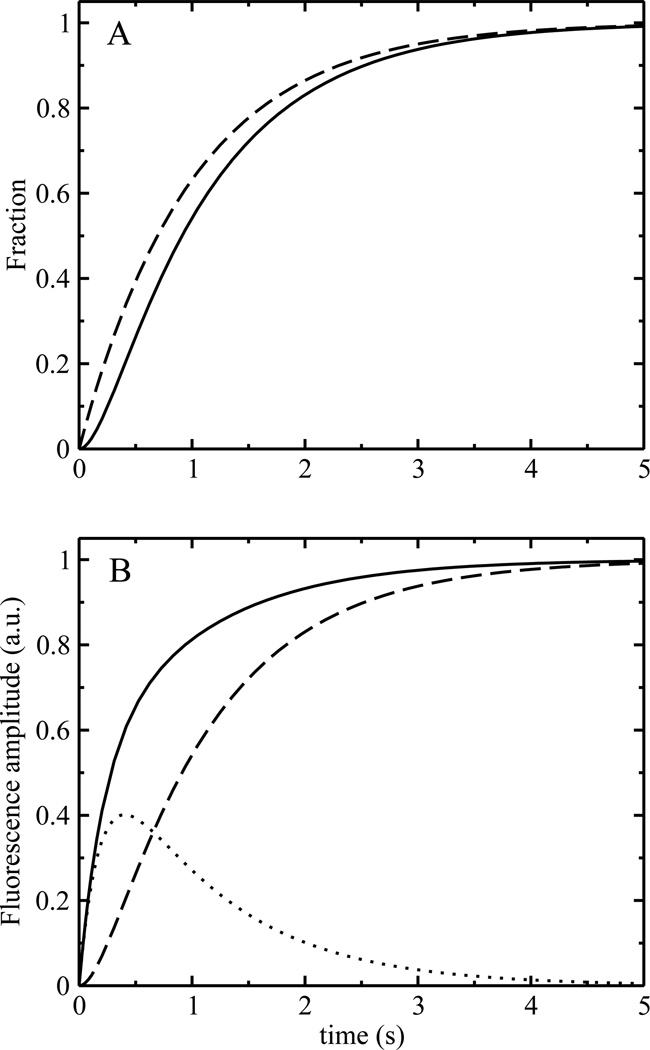
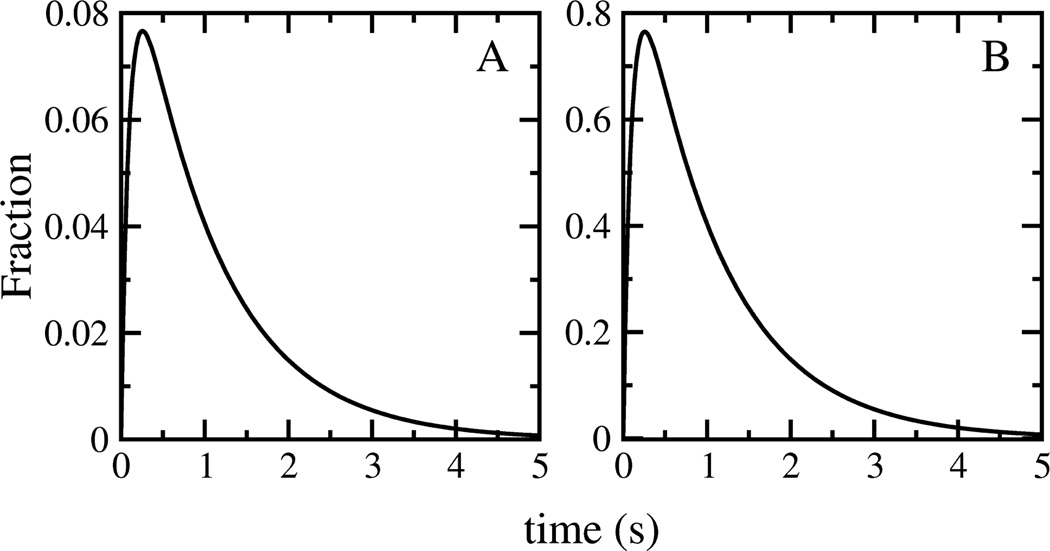
which is characterized by two rate constants, k1 and k2. If the final state is experimentally distinguishable from the other two, and the two forward rate constants (k1 and k2) are of the same order of magnitude, the time course of the final state will show two exponential phases; one with a positive, the other with a negative amplitude. The result is a sigmoidal curve (Figure 5A, solid line). If the second process (k2) is much faster than the first (k1), the negative amplitude associated with the faster rate constant will become negligible and the process characterized by the large rate constant will cease to contribute significantly to the observed kinetics. Under these conditions, the final state will appear with a single apparent rate constant, determined by the now rate-limiting first step (Figure 5A, dashed line). In the context of model IV, this first step corresponds to the initial binding of peptide monomers to the bilayer, and not to peptide insertion or folding at the membrane–water interface. Two exponential phases with positive amplitudes may appear if both membrane-bound states contribute to the experimental signal. But for that to occur, the two forward rate constants must be of comparable magnitudes, and the relative contribution of the intermediate state to the experimental signal must be significantly larger than that of the final state. For example, Figure 5B shows a relative contribution of the intermediate state that is three times larger. Moreover, even in the case where two exponential phases can be distinguished, their assignment to actual processes is not straightforward. In the simplified model (eq 11), the order of the rate constants can be inverted without a change in the time course of the final or the intermediate state; only the amplitude of the intermediate state changes (Figure 6). Thus, faster processes do not necessarily occur first in a sequence of events, and without knowledge of the amplitudes associated with the intermediates formed, the assignment of an apparent rate constant to an individual process is arbitrary.
FIGURE 5.
Theoretical traces for a linear model of the type described in model IV. The two back-reaction rate constants were set to 0.1 s−1, which further simplifies the model to the one summarized by eq 11. (A) Evolution of the final state as a function of k1 and k2. Solid line: k1=1 s−1, k2=5 s−1. Dashed line: k1=1 s−1, k2=1000 s−1. (B) Theoretical signals for the intermediate and final state assuming that both contribute to the signal, k1=1 s−1, k2=5 s−1. Dashed line: final state, dotted line: intermediate state multiplied by a factor of 3, to indicate that the relative amplitude of this state to the overall signal was assumed to be three times that of the final state (see text). Solid line: overall signal, corresponding to the sum of the dashed and dotted lines.
FIGURE 6.
Time course of the intermediate state as a function of the order of rate constants for the reaction described in eq 11. (A) k1=1 s−1, k2=10 s−1. (B) k1=10 s−1, k2=1 s−1. Note the different y-axis scales.
We showed that differentiating between models for peptide–membrane interactions calls for a detailed kinetic analysis. However, it is of interest to note that, at least in the case of lysette-26, the microscopic rate constants for binding and dissociation from the bilayer can be extracted from multiphasic experimental data with reasonably high confidence using a simple fit involving sums of exponentials and plotting the apparent rate constant of the major phase as a function of lipid concentration. For lysette-26, this simple analysis yields kon = 1.3 ± 0.4 × 10⁴ M−1s−1 and koff = 3.2 ± 1.7 s−1, quite similar to the values obtained for monomer binding using the exact models I and II (Table 1).
CONCLUSIONS
Lysette-26 is a typical member of the class of linear, amphipathic, α-helical peptides. As such, its behavior can be taken as representative of other membrane-active peptides, with the caveat that these are likely to differ from lysette-26 with respect to the values of the rate constants describing oligomerization in aqueous solution and on the lipid bilayer. Our analysis shows that the observation of multiphasic binding kinetics may indicate the occurrence of processes other than binding, or simply a deviation from first-order behavior caused by peptide oligomerization on the membrane. An important corollary is that the observation of single-exponential binding kinetics cannot be taken as sufficient evidence for simple, one-step binding. If binding data are to be used in the construction of models describing peptide binding to lipid bilayers, an exact analysis of kinetic binding experiments is preferable, and a number of models can be excluded based on a simple set of experiments.
Acknowledgment
This work was supported by NIH grants AI088567 and GM072507. We thank Paulo Almeida for many discussions and for providing us with the basic Fortran code used to construct the fit routines.
References
- 1.Sekharam KM, Bradrick TD, Georghiou S. Biochim. Biophys. Acta. 1991;1063:171–174. doi: 10.1016/0005-2736(91)90367-h. [DOI] [PubMed] [Google Scholar]
- 2.Bradrick TD, Philippetis A, Georghiou S. Biophys. J. 1995;69:1999–2010. doi: 10.1016/S0006-3495(95)80070-6. [DOI] [PMC free article] [PubMed] [Google Scholar]
- 3.Golding C, Senior S, Wilson MT, OShea P. Biochemistry. 1996;35:10931–10937. doi: 10.1021/bi960905i. [DOI] [PubMed] [Google Scholar]
- 4.Wang W, Smith DK, Moulding K, Chen HM. J. Biol. Chem. 1998;42:27438–27448. doi: 10.1074/jbc.273.42.27438. [DOI] [PubMed] [Google Scholar]
- 5.Bryson EA, Rankin SE, Carey M, Watts A, Pinheiro TJT. Biochemistry. 1999;38:9758–9767. doi: 10.1021/bi990119o. [DOI] [PubMed] [Google Scholar]
- 6.Meijberg W, Booth PJ. J. Mol. Biol. 2002;319:839–853. doi: 10.1016/S0022-2836(02)00342-X. [DOI] [PubMed] [Google Scholar]
- 7.Constantinescu I, Lafleur M. Biochim. Biophys. Acta. 2004;1667:26–37. doi: 10.1016/j.bbamem.2004.08.012. [DOI] [PubMed] [Google Scholar]
- 8.Tucker MJ, Tang J, Gai F. J. Phys. Chem. B. 2006;110:8105–8109. doi: 10.1021/jp060900n. [DOI] [PubMed] [Google Scholar]
- 9.Tang J, Signarvic RS, DeGrado WF, Gai F. Biochemistry. 2007;46:13856–13863. doi: 10.1021/bi7018404. [DOI] [PubMed] [Google Scholar]
- 10.Lorch M, Booth PJ. J. Mol. Biol. 2004;344:1109–1121. doi: 10.1016/j.jmb.2004.09.090. [DOI] [PubMed] [Google Scholar]
- 11.Ennaceur SM, Hicks MR, Pridmore CJ, Dafforn TR, Rodger A, Sanderson JM. Biophys. J. 2009;96:1399–1407. doi: 10.1016/j.bpj.2008.10.039. [DOI] [PMC free article] [PubMed] [Google Scholar]
- 12.Andreev OA, Karabadzhak AG, Weerakkody D, Andreev GO, Engelman DM, Reshetnyak YK. Proc. Natl. Acad. Sci. USA. 2010;107:4081–4086. doi: 10.1073/pnas.0914330107. [DOI] [PMC free article] [PubMed] [Google Scholar]
- 13.Tang J, Yin H, Qiu JD, Tucker MJ, DeGrado WF, Gai F. J. Am. Chem. Soc. 2009;131:3816–3817. doi: 10.1021/ja809007f. [DOI] [PMC free article] [PubMed] [Google Scholar]
- 14.White SH, Wimley WC. Annu. Rev. Biophys. Biomol. Struct. 1999;(28):319–365. doi: 10.1146/annurev.biophys.28.1.319. 1999. [DOI] [PubMed] [Google Scholar]
- 15.Tossi A, Sandri L, Giangaspero A. Biopolymers. 2000;55:4. doi: 10.1002/1097-0282(2000)55:1<4::AID-BIP30>3.0.CO;2-M. [DOI] [PubMed] [Google Scholar]
- 16.Gregory SM, Cavenaugh A, Journigan V, Pokorny A, Almeida PFF. Biophys. J. 2008;94:1667–1680. doi: 10.1529/biophysj.107.118760. [DOI] [PMC free article] [PubMed] [Google Scholar]
- 17.Bartlett GR. J. Biol. Chem. 1959;234:466–468. [PubMed] [Google Scholar]
- 18.Pokorny A, Birkbeck H, Almeida PFF. Biochemistry. 2002;41:11044–11056. doi: 10.1021/bi020244r. [DOI] [PubMed] [Google Scholar]
- 19.Ladokhin AS, Fernandez-Vidal M, White SH. J. Membr. Biol. 2010;236:247–253. doi: 10.1007/s00232-010-9291-0. [DOI] [PMC free article] [PubMed] [Google Scholar]
- 20.Luo P, Baldwin RL. Biochemistry. 1997;36:8413–8421. doi: 10.1021/bi9707133. [DOI] [PubMed] [Google Scholar]
- 21.Lakowicz JR. Principles of Fluorescence Spectroscopy. 3rd edition. New York: Springer; 2006. pp. 443–467. [Google Scholar]
- 22.Press WH, Teukolsky SA, Vetterling WT, Flannery BP. Numerical Recipes in Fortran. 2nd ed. New York: Cambridge University Press; [Google Scholar]
- 23. http://agadir.crg.es/
- 24.Munoz V, Serrano L. Biopolymers. 1997;41:495–509. doi: 10.1002/(SICI)1097-0282(19970415)41:5<495::AID-BIP2>3.0.CO;2-H. [DOI] [PubMed] [Google Scholar]
- 25.Gutfreund H. Kinetics for the Life Sciences: Receptors, Transmitters and Catalysts. New York: Cambridge University Press; 1995. [Google Scholar]
- 26.Pokorny A, Almeida PFF. Biochemistry. 2009;48:8083–8093. doi: 10.1021/bi900914g. [DOI] [PMC free article] [PubMed] [Google Scholar]


