

Abstract
Many animals use photoperiod cues to synchronize reproduction with environmental conditions and thereby improve their reproductive success. The circadian clock, which creates endogenous behavioral and physiological rhythms typically entrained to photoperiod, is well characterized at the molecular level. Recent work provided evidence for an association between Clock poly-Q length polymorphism and latitude and, within a population, an association with the date of laying and the length of the incubation period. Despite relatively high overall breeding synchrony, the timing of clutch initiation has a large impact on the fitness of swallows in the genus Tachycineta. We compared length polymorphism in the Clock poly-Q region among five populations from five different Tachycineta species that breed across a hemisphere-wide latitudinal gradient (Fig. 1). Clock poly-Q variation was not associated with latitude; however, there was an association between Clock poly-Q allele diversity and the degree of clutch size decline within breeding seasons. We did not find evidence for an association between Clock poly-Q variation and date of clutch initiation in for any of the five Tachycineta species, nor did we found a relationship between incubation duration and Clock genotype. Thus, there is no general association between latitude, breeding phenology, and Clock polymorphism in this clade of closely related birds.
Figure 1.
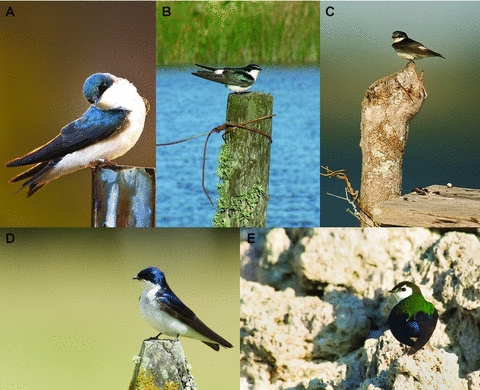
Photos of Tachycineta swallows that were used in this study: A) T. bicolor from Ithaca, New York, B) T. leucorrhoa from Chascomús, Argentina, C) T. albilinea from Hill Bank, Belize, D) T. meyeni from Puerto Varas, Chile, and E) T. thalassina from Mono Lake, California, Photographers: B: Valentina Ferretti; A, C-E: David Winkler.
Keywords: Circadian, Clock, polyglutamine, Tachycineta, time of breeding, tree swallow
Introduction
The phenology of reproduction has a critical influence on fitness in many animals. Thus, in order to optimize their reproductive effort in a seasonally varying environment, individuals have to estimate the best time for reproduction in advance by relying on cues from the changing environment. Most animals use photoperiod as the primary cue for their phenological timing (Saunders 1977; Aschoff 1981), and differences among individuals in the details of the physiological cue-response mechanism and how they fare in different environments are likely to have fitness consequences.
In birds, one of the most important and well-studied phenological traits is the date of clutch initiation. Selection on the timing of reproduction is expected to be stronger for species that usually raise only one brood per year, such as insectivorous birds that breed at higher latitudes with short seasonal reproductive windows and which rely on ephemeral resources (Charmantier et al. 2008) or have constraining molt schedules. Theory suggests that birds raising a single brood per year will be selected to lay at the time that is optimal for that one clutch, whereas birds raising multiple broods per year will lay at times that optimize their reproductive success over all of these clutches (Crick et al. 1993). Previous work on many bird species has shown that females that successfully time their reproductive effort produce more offspring (e.g., Perrins 1970; Verhulst and Tinbergen 1991; Sheldon et al. 2003; Charmantier et al. 2008). Interindividual variation in the time of breeding is often quite high, with some components of this variation having a heritable basis (Boag and van Noordwijk 1987; Svensson 1997; van der Jeugd and McCleery 2002; Sheldon et al. 2003). Thus variation in response to photoperiod cues will influence the timing of clutch initiation and therefore affect the individual's fitness.
Circadian rhythms, the endogenous ∼24-h biochemical, physiological, and behavioral cycles which exist in most organisms, are controlled by biological clocks that are well characterized genetically and biochemically (reviewed by Bell–Pedersen et al. 2005). Although endogenous, many clocks are entrained to, or synchronized by, photoperiodic zeitgebers (“time givers” or external time cues). Many of the genetic and biochemical aspects of the biological clock are shared among diverse taxa from insects to mammals (Panda et al. 2002), and genetic polymorphism in circadian clock genes has been associated with behavioral and ecological variation in many organisms (Katzenberg et al. 1998; Tauber and Kyriacou 2005; Johnsen et al. 2007; O’Malley and Banks 2008; Liedvogel et al. 2009). The vertebrate protein encoded by the circadian gene, Clock, is a transcription activator (as a heterodimer together with BMAL1) in the core circadian oscillator (Young and Kay 2001; Panda et al. 2002; Ko and Takahashi 2006). CLOCK protein sequence is -conserved across many avian taxa, yet considerable variation exists in the poly-Q (polyglutamine) repeat region (Fidler and Gwinner 2003) of this protein, in a region that in mammals (Avivi et al. 2001) and amphibians (Hayasaka et al. 2002) influences the transcription-activating potential of the heterodimer complex. In birds, cross-population analyses have shown a general association between Clock poly-Q allele length and latitude in the Blue Tit (Cyanistes caeruleus), but not in the Bluethroat (Luscinia svecica) (Johnsen et al. 2007).
Even though clutch initiation date is likely a quantitative trait influenced by many genes and their interactions with the environment, a recent within-population study in the Blue Tit showed that females with fewer poly-Q repeats bred earlier during the breeding season (Liedvogel et al. 2009). The same study found that females with fewer poly-Q repeats had shorter incubation periods, an intriguing pattern for which the authors had no functional explanation. The pace of embryonic development could be regulated by clock genes because embryos entrain to photoperiod (e.g., Sturnus vulgaris, Gwinner et al. 1997) and metabolic rate is greater in light than in dark (e.g., Columba livia, Prinzinger and Hinninger 1992; Passer domesticus, Cooper et al. 2011). However, similar analysis of a sympatric Great Tit (Parus major) population revealed low variability in Clock poly-Q and lack of association between either time of breeding or incubation duration and Clock poly-Q genotype (Liedvogel and Sheldon 2010). This evidence that Clock genetic variation influences avian reproductive timing in some but not all species suggests that the generality of this phenomenon should be further explored via similar investigations of other bird species.
In this study, we examined Clock poly-Q allelic length variation in populations of five of the nine species of swallows in the genus Tachycineta. Tachycineta swallows breed along an expansive latitudinal gradient in the Western Hemisphere, from the southern tip of South America to Alaska and northern Canada (Turner 2004). The populations studied here represent north-temperate, south-temperate, and tropical species that exhibit differences in many life-history traits that are likely influenced by the phenology of their annual cycles (Table 1). These species represent the two subclades within the monophyletic genus Tachycineta that are associated with geography: the North American/Caribbean clade (T. bicolor and T. thalassina) and a South/Central American clade (T. albilinea, T. leucorrhoa, and T. meyeni) (Whittingham et al. 2002; Cerasale et al. in review).
Table 1.
Characteristics of the Tachycineta populations used in this study
| Species | Population location | Breeding latitude | Breeding season | No. of broods | Migratory behavior |
|---|---|---|---|---|---|
| T. bicolor | Ithaca, NY | 42°30′ N | May-Jul | 1 | Migratory |
| T. thalassina | Mono Lake, CA | 38° N | Jun-Aug | 1 | Migratory |
| T. albilinea | Hill Bank, Belize | 17°30′ N | Mar-Jun | 2 | Resident |
| T. leucorrhoa | Chascomús, Argentina | 35°30′ S | Oct-Jan | 2 | Migratory |
| T. meyeni | Ushuaia, Argentina | 55° S | Nov-Feb | 2 | Migratory |
Our aims were to: (1) compare variation in Clock poly-Q region in Tachycineta swallows to variation reported in previous studies for other bird species, (2) test for a relationship between breeding latitude and Clock poly-Q variation, (3) test for a relationship between the seasonal decline in clutch size and Clock poly-Q allelic variation in order to examine the effect of selection pressure on clutch initiation date on Clock poly-Q variation, and (4) examine the relationship between Clock poly-Q variation and phenology of reproduction, as shown by timing of clutch initiation and incubation duration.
Methods
Study populations, breeding biology, and sample collection
We studied five populations from five species of Tachycineta swallows breeding in nest boxes: (1) T. bicolor from Ithaca, New York, USA, between 2002 and 2010; (2) T. thalassina from Mono Lake, California, USA, between 2008 and 2009; (3) T. albilinea from Hill Bank, Belize, in 2001, 2003, and 2009; (4) T. leucorrhoa from Chascomús, Argentina, in 2007 and 2008; and (5) T. meyeni from Ushuaia, Argentina, in 2006, 2008 and 2009. For each of these sites, these years represent the best combination of phenology data and blood samples obtained for large samples of individuals from the population (Table A1). We monitored the same populations in the multiple years.
In each of these colonies, we monitored nest boxes with repeated visits to record nest building and the dates of egg laying and hatching. Most of the adults were captured and uniquely marked with metal bands. Nestlings were measured and ringed between the ages of 6 and 12 days. Detailed information on the study populations and relevant field methods are included in Winkler and Allen (1996) and at http://golondrinas.cornell.edu. Blood samples were collected from adults and nestlings and were stored in lysis buffer until DNA was extracted.
For the association between lay date or incubation duration and Clock poly-Q variation, we limited our analyses only to breeding females, as there is no evidence that males strongly influence the timing of clutch initiation and because a previous study on Blue Tits (C. caeruleus) found an association between lay date and Clock poly-Q variation only for females (Liedvogel et al. 2009). We included only the first breeding attempt of the season in cases where females were known to have attempted multiple nestings. We measured the incubation period as the number of days from the laying of the last egg to the hatching of the first chick, excluding nest attempts for which either variable could not be estimated with ±1-day precision.
Analysis of Clock poly-Q alleles
Genomic DNA was extracted from blood using the E-Z 96 Tissue DNA kit (Omega Bio-Tek, Norcross, GA) or using the DNAeasy blood Extraction kit (Qiagen, Valencia, CA). To examine variability in Tachycineta Clock poly-Q region and verify the genetic sequence, we first amplified this region (corresponding to human Clock gene exon 20; Steeves et al. 1999) from four to eight individuals from each of the Tachycineta species using the sequencing primers developed by Johnsen et al. (2007). Ten-microliter polymerase chain reaction (PCR) amplifications included 10–100 ng DNA, 10 µM Tris-HCl, 50 µM KCl, 4 mM MgCl2, 0.25 mM of each nucleotide, 0.25 mM from each primer, and 0.025 U jumpstart Taq polymerase (Sigma-Aldrich, St. Louis, Missouri). PCR amplification conditions were: initial denaturation at 95°C for 4 min 30 sec; 30 cycles of denaturing at 95°C for 1 min, annealing at 64°C for 1 min, and extension at 72°C for 2 min, then a final extension at 72°C for 4 min 30 sec. PCR products were purified using Exonuclease and Shrimp Alkaline Phosphatase enzymatic reactions (United States Biochemical, Cleveland, OH). Purified products were cycle-sequenced in both directions using amplification primers and ABI BigDye Terminator chemistry. Sequencing products were cleaned using Sephadex columns and electrophoresed in an ABI 3730 Automated DNA Analyzer (Applied Biosystems, Foster City, CA). We aligned forward and reverse strands for each specimen and checked them using Sequencher 4.7 (Gene Codes Corp., Ann Arbor, MI). All sequence data are deposited in GenBank (Accession numbers JN896947-JN896985). The amplified sequence generated for all Tachycineta species matched the expected sequence for this gene in birds and was aligned to other avian species Clock gene in a BLAST search. We sequenced the Clock poly-Q region for 27 Tachycineta individuals. All Tachycineta sequences were identical to each other except for differences in their number of poly-Q repeats (Fig. 2). There were four synonymous differences between Tachycineta and Blue Tit sequences upstream and downstream of the poly-Q repeat. The first and last glutamine amino acids in the poly-Q repeat were coded by CAA codons, whereas the middle ones were coded exclusively by CAG codons. Thus, the only variation among the sequenced Tachycineta individuals was in the number of CAG codons.
Figure 2.
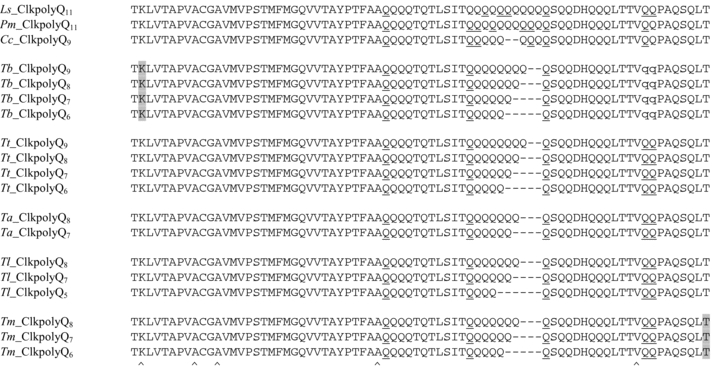
Amino acid alignment of Clock alleles from Tachycineta swallows (T. bicolor; Tb, T. thalassina; Tt, T. albilinea; Ta, T. leucorrhoa; Tl, T. meyeni; Tm) together with published Blue Tit (Cyanistes caeruleus; Cc), Great Tit (Parus Major; Pm), and Bluethroat (Luscinia svecica; Ls) alleles. For each sequence, the species name and number of Clock poly-Q repeats are shown. The predicted protein sequences of Tachycineta Clock poly-Q repeats only differ in the number of CAG codon (coded by Q) repeats (the first and last glutamine (Q) amino acids in the poly-Q repeat were coded by CAA codons). Q residues coded by CAA are underlined and lower-case Qs are within-population polymorphic sites encoded by either CAA or CAG. Caret symbol indicates synonymous substitutions (other than in glutamine) between the Tachycineta species in the flanking regions of the poly-Q repeat. Amino acids highlighted in gray represent synonymous substitutions between Tachycineta species.
All individuals were then screened for length polymorphism in the Clock poly-Q region using the genotyping primer set developed by Johnsen et al. (2007) in which the forward primer was labeled at the 5′ end with 6-FAM fluorescent dye. The PCR protocol was similar to the one used for sequencing (see above). PCR products were genotyped on an ABI 3100 Genetic Analyzer (Applied Biosystems) with GeneScan-500 LIZ (Applied Biosystems) as the molecular size standard. Allele sizes were estimated using Genemapper version 3.7 (Applied Biosystems) together with control samples with known repeat numbers determined by sequencing. We were able to successfully genotype all Tachycineta samples (n = 1016).
Statistical analysis
Observed and expected heterozygosities for the Clock poly-Q region for each species were calculated using ARLEQUIN version 3.11 (Excoffier et al. 2005). We tested for departures from Hardy–Weinberg equilibrium (HWE) using GENEPOP version 4 (Raymond and Rousset 1995; Rousset 2008) with parameters of 10,000 dememorization, 10,000 batches, and 10,000 iterations. We used contingency tables to test whether allele frequencies were different between years for each species.
To test for a relationship between length polymorphism in the Clock poly-Q region and breeding phenology we used either mean Clock poly-Q allele size or the Clock poly-Q genotype. We examined the effect of Clock poly-Q region on lay date in separate analyses for each species using linear mixed models in which lay date was the dependent variable, female identity (band number) as a random effect to account for repeated measure for same females in different years, and breeding year and mean Clock poly-Q allele size (or Clock poly-Q genotype) as fixed effects. The effect of Clock poly-Q region on incubation duration was examined using linear mixed models in which incubation duration was the dependent variable, female's band number as a random effect and year, lay date, clutch size, and mean Clock poly-Q allele size (or Clock poly-Q genotype) as fixed effects. For T. bicolor, we also had information on female's age group (classified as “first year” or “after first year”) thus female's age was included as a fixed effect in all T. bicolor models. Data on incubation duration were not available for T. meyeni, therefore we were not able to examine the relationship between Clock poly-Q region and incubation duration for this species.
To examine fitness consequence on timing of breeding, we used generalized linear mixed models (SAS 9.1, SAS Institute Inc., Cary, NC) for the relationship between clutch size and lay date, with female's band number as a random effect and year and lay date as fixed effects (female's age was included as fixed effect in T. bicolor model). The effects (slopes) generated from this model of seasonal decline in clutch size were also used to examine the relationship between number of Clock poly-Q alleles and the effect of seasonal decline in clutch size using Spearman rank-order correlation. We used this test also to examine the correlation between population Clock poly-Q mean allele size and latitude.
Results
Clock poly-Q variation in Tachycineta
We genotyped a total of 1016 individuals from five Tachycineta species. Overall, we found five different length-variant alleles in Tachycineta, ClkpolyQ5,6,7,8,9, corresponding to 5–9 poly-Q repeats (Table 2). Maximum allelic polymorphism was four alleles (in T. bicolor and T. thalassina) and was as low as two alleles in T. albilinea, and the sample size ranged from 548 to 48 individuals per species. Observed heterozygosity ranged from 0.047 for T. leucorrhoa to 0.472 for T. bicolor. Genotype frequency in none of the five species deviated from HWE (all P > 0.05). In all species, one or two common alleles accounted for more than 90% of the allelic variation. We found no difference in genotype frequency between years for any of the species (Table A2).
Table 2.
Clock poly-Q allele frequencies, number of individuals (N), number of alleles (K), mean allele size (with se), and observed heterozygosities (H) for the five species of Tachycineta used in this study. Allele frequencies did not deviate from Hardy–Weinberg equilibrium for any populations (all P > 0.05)
| Allele proportion | ||||||||||
|---|---|---|---|---|---|---|---|---|---|---|
| Species | Latitude | N | K | Mean allele size (se) | Q5 | Q6 | Q7 | Q8 | Q9 | H |
| T. bicolor | 42°30′ N | 548 | 4 | 8.27 (0.02) | 0.000 | 0.020 | 0.014 | 0.640 | 0.326 | 0.472 |
| T. thalassina | 38° N | 48 | 4 | 7.78 (0.05) | 0.000 | 0.063 | 0.104 | 0.823 | 0.010 | 0.354 |
| T. albilinea | 17°30′ N | 163 | 2 | 7.79 (0.02) | 0.000 | 0.000 | 0.215 | 0.785 | 0.000 | 0.343 |
| T. leucorrhoa | 35°30′ S | 169 | 3 | 7.01 (0.01) | 0.006 | 0.000 | 0.970 | 0.024 | 0.000 | 0.047 |
| T. meyeni | 55° S | 88 | 3 | 7.53 (0.04) | 0.000 | 0.017 | 0.438 | 0.545 | 0.000 | 0.443 |
Clock poly-Q and latitude
The association between population Clock poly-Q mean allele size and latitude was examined across the five Tachycineta species. Despite the wide range of variation in breeding latitudes, there was no correlation between breeding latitude and Clock poly-Q mean allele size (Fig. 3; N = 5, rs = 0.20, t = 0.35, P = 0.747).
Figure 3.
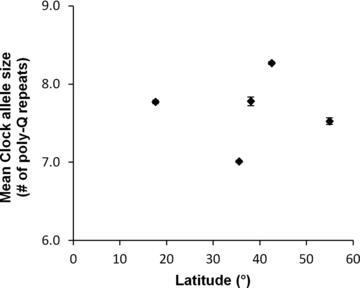
Relationship between mean Clock poly-Q allele size and breeding latitude in five populations of five species of Tachycineta swallows. Detailed data are provided in Table 2.
Clock genotype and reproductive phenology
In each of the five species, we examined the relationship between females’Clock poly-Q genotypes and two breeding phenology variables: lay date and incubation duration. We found no evidence for a relationship between Clock poly-Q and lay date for any of the five Tachycineta species (Table 3). Female's age had a strong effect on lay date in T. bicolor (there was no information on female's age for the other species) in which first-year females started laying later than older females.
Table 3.
Relationship between lay date and Clock poly-Q average allele size for Tachycineta species. Linear mixed models included female's band number as a random effect and breeding year and mean Clock poly-Q allele size as fixed effects (Female's age was included as a fixed effect only for T. bicolor since this information was not available for the other species). Similar models with Clock poly-Q genotype as fixed effect generated quantitatively similar results (not presented)
| Species | Covariable | Estimate (SE) | df | F | P-value |
|---|---|---|---|---|---|
| T. bicolor | Age | 1, 697 | 108.92 | <0.0001 | |
| Year | 7, 652 | 43.57 | <0.0001 | ||
| Clock average allele size | 0.494 (0.612) | 1, 462 | 0.65 | 0.419 | |
| T. thalassina | Year | 1, 32 | 5.06 | 0.031 | |
| Clock average allele size | −0.287 (0.515) | 1, 32 | 0.31 | 0.581 | |
| T. albilinea | Year | 2, 69.1 | 9.04 | <0.001 | |
| Clock average allele size | 0.622 (1.384) | 1, 71.7 | 0.20 | 0.655 | |
| T. leucorrhoa | Year | 1, 67 | 1.95 | 0.167 | |
| Clock average allele size | 3.810 (2.129) | 1, 102 | 3.20 | 0.077 | |
| T. meyeni | Year | 2, 54 | 15.65 | <0.0001 | |
| Clock average allele size | −0.210 (0.712) | 1, 54 | 0.09 | 0.769 |
We did not find any relationship between female's Clock poly-Q and incubation duration for any of the Tachycineta species (Table 4; data on incubation duration was not available for T. meyeni). The effects of clutch size and lay date on incubation duration were not consistent across species. Similar models for either lay date or incubation duration with Clock poly-Q genotype instead of Clock poly-Q mean allele as fixed effect generated similar results (not presented).
Table 4.
Relationship between incubation duration and Clock poly-Q average allele size for Tachycineta species. Linear mixed models included female's band number as a random effect and breeding year, lay date, clutch size, and mean Clock poly-Q allele size as fixed effects (female's age was included as a fixed effect only for T. bicolor since this information was not available for the other species). Similar models with Clock poly-Q genotype as fixed effect generated quantitatively similar results (not presented). Data on incubation duration were not available for T. meyeni
| Species | Covariable | Estimate (SE) | df | F | P-value |
|---|---|---|---|---|---|
| T. bicolor | Age | 1, 630 | 0.80 | 0.372 | |
| Year | 7, 559 | 17.64 | <0.0001 | ||
| Lay date | −0.075 (0.008) | 1, 635 | 80.38 | <0.0001 | |
| Clutch size | −0.518 (0.059) | 1, 638 | 78.19 | <0.0001 | |
| Clock average allele size | 0.114 (0.126) | 1, 392 | 0.83 | 0.362 | |
| T. thalassina | Year | 1, 9.91 | 15.21 | 0.003 | |
| Lay date | −0.104 (0.042) | 1, 29 | 6.11 | 0.020 | |
| Clutch size | 0.176 (0.255) | 7, 30.9 | 0.48 | 0.495 | |
| Clock average allele size | 0.151 (0.143) | 1, 23.8 | 1.12 | 0.300 | |
| T. albilinea | Year | 2, 68.9 | 2.41 | 0.097 | |
| Lay date | −0.019 (0.020) | 1, 84.6 | 0.99 | 0.323 | |
| Clutch size | 0.052 (0.354) | 1, 85 | 0.02 | 0.884 | |
| Clock average allele size | 0.138 (0.271) | 1, 66.3 | 0.26 | 0.613 | |
| T. leucorrhoa | Year | 1, 60.6 | 1.60 | 0.211 | |
| Lay date | 0.011 (0.010) | 1, 101 | 1.27 | 0.262 | |
| Clutch size | −0.407 (0.165) | 1, 102 | 6.12 | 0.015 | |
| Clock average allele size | −0.395 (0.225) | 1, 100 | 3.08 | 0.082 |
Seasonal effect on clutch size
In order to estimate the potential selection on timing of breeding, we examined the relationship between clutch size (a measure of potential reproductive success) and lay date for all Tachycineta species. We found a decrease in clutch size with the progress of the breeding season for all Tachycineta species (Table 5), however this trend was only marginally significant for T. albilinea.
Table 5.
Relationship between clutch size and lay date for the Tachycineta species. Linear mixed models included female's band number as a random effect and breeding year and lay date as fixed effects (female's age was included as a fixed effect only for T. bicolor since this information was not available for the other species)
| Species | Covariable | Estimate (SE) | df | F | P-value |
|---|---|---|---|---|---|
| T. bicolor | Age | 1, 706 | 0.80 | 0.372 | |
| Year | 7, 706 | 2.27 | 0.028 | ||
| Lay date | −0.058 (0.006) | 1, 706 | 98.63 | <0.0001 | |
| T. thalassina | Year | 1, 12.7 | 2.83 | 0.117 | |
| Lay date | −0.064 (0.019) | 1, 13.4 | 11.81 | 0.004 | |
| T. albilinea | Year | 2, 58.4 | 1.42 | 0.250 | |
| Lay date | −0.013 (0.007) | 1, 98 | 3.71 | 0.057 | |
| T. leucorrhoa | Year | 1, 56.9 | 1.25 | 0.269 | |
| Lay date | −0.014 (0.006) | 1, 103 | 5.56 | 0.020 | |
| T. meyeni | Year | 2, 56.2 | 1.69 | 0.193 | |
| Lay date | −0.023 (0.011) | 1, 58.6 | 4.24 | 0.044 |
We have used the effect of seasonal decline in clutch size as an estimate of the intensity of selection on lay date and explore its relationship with Clock poly-Q allelic diversity. There was a significant relationship between the rate of seasonal decline in clutch size (the slope of the regression, presented in Table 5) and Clock poly-Q allelic diversity for Tachycineta (Fig. 4; N = 5, rs = −0.95, t = 5.20, P = 0.014).
Figure 4.
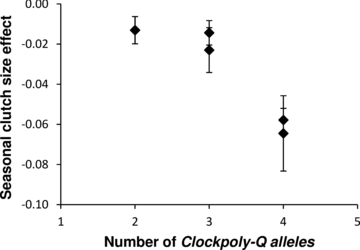
The effect of seasonal decline in clutch size (regression slope) and Clock poly-Q allelic diversity (number of alleles) in Tachycineta.
Discussion
The molecular genetic properties of the circadian clock have been well characterized for a wide range of organisms. Although most of the circadian genes are conserved even among diverse taxa, including birds, the poly-Q region of the circadian gene Clock exhibits both between-species and within-species variation along with within-individual heterozygosity in birds (Fidler and Gwinner 2003; Johnsen et al. 2007). This variation provides an opportunity to examine the direct relationship between genetic variation and life-history traits that may be associated with the circadian clock in wild bird populations. However, available results from the few wild bird populations that have been examined have not been conclusive (Johnsen et al. 2007; Liedvogel et al. 2009; Liedvogel and Sheldon 2010). Thus, the generality of the association between life-history traits and Clock poly-Q variation should be explored in other bird species. Swallows from the genus Tachycineta provide an excellent system to examine this relationship since they breed in a wide range of latitudes and exhibit variation in life-history traits that may be associated with the circadian clock.
Allelic variation in Tachycineta (Table 2) is lower than values reported previously for Blue Tit or Bluethroat (Johnsen et al. 2007), and more similar to the values reported for a Great Tit population (Liedvogel and Sheldon 2010), with shorter alleles compared to those of the other species (Q5–9 in Tachycineta compared to Q9–17 in Blue Tit, Q11–15 Great Tit, and Q10–16 in Bluethroat). Longer tandem repeats are more likely to be more polymorphic (Weber 1990; Edwards et al. 1991), therefore the lower variation in Tachycineta may be explained by their shorter Clock poly-Q repeats. However, polymorphism can be relatively low even in birds with long Clock poly-Q repeats (Liedvogel and Sheldon 2010).
Breeding latitudes of Tachycineta in our study ranged from 42° North to 55° South and included intervening tropical species. However, we were not able to detect any correlation between Clock poly-Q allele size and breeding latitude (Fig. 3). Unfortunately, we only had data on the Clock gene for five of nine Tachycineta species, thus data on the remaining species may increase our power to detect such a relationship. Each species in our study is represented by only one population. Therefore, this result could be due to either differences between the species or latitudinal differences, which cannot be distinguished. Therefore, more populations from each of the Tachycineta species should be sampled to examine the relationship between breeding latitude and Clock genotype. It is possible that this association is present only within-species and due to species differences, would not be observed even across closely related species.
Breeding phenology is important for reproductive success in most bird species including swallows (Stutchbury and Robertson 1988; Winkler and Allen 1996; Sheldon et al. 2003; Charmantier et al. 2008). In this study, the fitness consequences of breeding phenology are evident from the interaction between clutch size and date of clutch initiation, in which clutch size declines with the progress of the breeding season for Tachycineta species (Table 5). We failed to detect a pattern between Clock genotype and date of clutch initiation for females (Table 3). Unlike Blue Tits (Liedvogel et al. 2009), Tachycineta females with longer Clock poly-Q alleles did not initiate their clutches later. This is in accordance with the low variability of the Clock poly-Q in Tachycineta and similar to findings for a Great Tit population (Liedvogel and Sheldon 2010). Sample size for the Tachycineta species was very variable (Table A1), therefore it is possible that sample size limitations have prevented us from detecting a correlation between clutch initiation date and Clock genotype especially for species with the lower sample size. However, population sample size was not related to allele diversity (populations with highest and lowest sample sizes had the same number of alleles). Given the overall low variability of the Clock poly-Q in Tachycineta (even for T. bicolor with relatively high sample size), it is unlikely that we would have missed a pattern such as the one observed for the Blue Tit, in which the main effect was due to the more common alleles (Liedvogel et al. 2009).
Incubation duration is another feature of breeding phenology that we addressed in this study. Liedvogel et al. (2009) found an association between incubation duration and Clock poly-Q genotype, according to which incubation duration was shorter in both male and female Blue Tits with fewer Clock poly-Q repeats. We did not find any evidence for an association between incubation duration and Clock poly-Q genotype for Tachycineta females (Table 4). Currently, there is no a priori prediction for the relationship between Clock genotype and incubation duration, and the little data available do not allow conclusions about the functionality of this relationship. Further research is needed to examine this relationship and determine its generality in birds.
The relationship between Clock allele diversity and the slope of the seasonal decline in clutch size (Fig. 4) is counterintuitive, since, if the steep slope of clutch size with lay date suggests strong selection on lay date, then a greater number of alleles in the more strongly selected populations would be surprising. Alternatively, selection may actually act to increase polymorphism in photoperiodic response mechanisms in more variable environments nearer the poles, resulting in more Clock poly-Q alleles where clutch size-lay date slopes are steepest. It has been suggested that tandem-repeat length polymorphism, such as the Clock CAG repeat, may be selectively advantageous by itself (Wren et al. 2000; Johnsen et al. 2007). Therefore, it is possible that in cases where selection on clutch initiation date is stronger, for example, in populations that lay only one clutch per season such as T. bicolor and T. thalassina (Table 1), where reproductive success of early breeders is higher (Winkler and Allen 1996; Stutchbury and Robertson 1988), the population exhibits increased polymorphism in Clock poly-Q. This could be a result of between-year changes that shift the selection from year to year (change in “optimal” allele) or as a result of balancing selection on a suite of alleles (Wren et al. 2000). Of course, all of these selective interpretations must be weighed against a neutral hypothesis. In this case, the number of alleles may reflect the different effective population sizes of the species being compared, as T. bicolor and T. thalassina (the two species that have the most alleles) very likely have larger effective populations than do the other species. A more rigorous test of this hypothesis must await actual data on effective population sizes.
This study on Clock poly-Q variation in Tachycineta swallows increases the confusion regarding its association with life-history traits among avian taxa. Tachycineta swallows exhibit relatively low levels of Clock poly-Q variation, with no apparent correlation with latitude. Within-population analyses showed no evidence for a relationship between Clock poly-Q and clutch initiation date or between Clock poly-Q and incubation duration. Sample size varied between the Tachycineta populations included in this study, thus power differences might explain some of the negative results we obtained. However, the sample sizes used for these populations should have been large enough to capture the genetic variation in this locus, which was universally very low and therefore cannot account for the substantial differentiation among the species in these life-history traits. More generally, Clock poly-Q variation is diverse among bird species and accumulating data suggest that the association between Clock poly-Q variation and breeding latitude or within-population breeding phenology is probably not general for avian species.
It is interesting, however, that we have added a new member to the list of life-history features that can be influenced by Clock poly-Q variation in birds. This raises two interesting questions at the molecular genetic level: (1) why does each successive study seem to find an association of Clock poly-Q variation with a new phenotypic trait, and (2) why does every study of this system fail to replicate the patterns seen in other species? We suspect that the answer to the first question is merely that the circadian clock system in general is regulated and differentiates in both ecological and evolutionary time in very complicated ways. We have only begun to scratch the surface, and understanding this complexity will take many years of work. But there is no question that this genetic system is important and pervasive in its effects on reproductive biology.
One possible answer to the second question of the failure to find reported associations between Clock poly-Q and breeding phenotypes is that the variation in timing of breeding and incubation duration that are present in different species may be associated with variation in other genes in the circadian clock system. An investigation of variation of other loci that are part of the core circadian clock pathway, such as Bmal1, Per, and Cry (reviewed in Bell–Pedersen et al. 2005) might be interesting, however, given the conserved nature of these genes (Saleem et al. 2001; Fidler and Gwinner 2003), high levels of variation in coding regions of these other genes seems unlikely. Another possible answer would be that phenotypic variation in these traits is associated with molecular variation at different levels, including variation in expression patterns among species, populations, and individuals, and even among different organs within individuals (Yoshimura et al. 2000). It must be remembered in contemplating studies of gene expression patterns that the circadian clock system is highly variable in its levels of gene expression of the various genes throughout the day (Yoshimura et al. 2000), and patterns of gene expression are likely to be extremely time dependent. In contemplating gene expression studies, we have been at a loss to know how to standardize time of collection of samples in free-living populations for the appropriate comparisons among individuals and populations. Epigenetic effects, such as DNA methylation, provide additional levels of molecular variation that might be associated with phenotypic differentiation observed in life-history traits (reviewed in Jaenisch and Bird 2003).
These approaches will be challenging to implement for wild populations, and adequate methods should probably be developed first using model species, which allow controlled manipulations, behavioral experimentation in the laboratory, and captive breeding. The challenge then becomes to choose a model system with breeding biology that is controlled largely by the circadian system, as many model avian systems are derived from wild species that are probably controlled more by variations in food and rain than by photoperiod.
Acknowledgments
We thank the many people who served the “Golondrinas de las Americas” project for assistance in collecting Tachycineta genetic samples and breeding data. For laboratory assistance we thank A. Talaba and L. Stenzler. We thank M. Carling, M. Liedvogel, B. Kempenaers and two anonymous reviewers for comments and suggestions. This research was supported by the Cornell Lab of Ornithology and National Science Foundation grants DEB-0814277 to IJL and DEB-0717021, IOS-0744753, and OISE-0730180 to DWW.
Appendix
Table A1.
Female sample sizes per year for each of the Tachycineta species used in this study for the association between Clock poly-Q length polymorphism and life-history traits (lay date or incubation duration)
| Year | T. bicolor | T. thalassina | T. albilinea | T. leucorrhoa | T. meyeni |
|---|---|---|---|---|---|
| 2001 | 29 | ||||
| 2002 | 112 | ||||
| 2003 | 92 | 36 | |||
| 2004 | 34 | ||||
| 2005 | 76 | ||||
| 2006 | 52 | 6 | |||
| 2007 | 87 | 51 | |||
| 2008 | 100 | 13 | 22 | ||
| 2009 | 111 | 19 | 32 | 27 | |
| 2010 | 112 | ||||
| Total observations | 724 | 32 | 97 | 103 | 55 |
| Total females | 449 | 26 | 85 | 81 | 46 |
Table A2.
Results for tests for among-year differences in Clock poly-Q allele frequencies for each of the Tachycineta species
| Species | χ2 | df | P-value |
|---|---|---|---|
| T. bicolor | 20.97 | 21 | 0.461 |
| T. thalassina | 1.26 | 1 | 0.261 |
| T. albilinea | 1.40 | 2 | 0.497 |
| T. leucorrhoa | 0.186 | 1 | 0.667 |
| T. meyeni | 1.64 | 4 | 0.801 |
References
- Aschoff J. A survey on biological rhythms. In: Aschoff J, editor. Biological rhythms. Handbook of behavioral neurobiology. New York: Plenum; 1981. pp. 3–10. [Google Scholar]
- Avivi A, Albrecht U, Oster H, Joel A, Beiles A, Nevo E. Biological clock in total darkness: the Clock/MOP3 circadian system of the blind subterranean mole rat. Proc. Natl. Acad. Sci. USA. 2001;98:13751–13756. doi: 10.1073/pnas.181484498. [DOI] [PMC free article] [PubMed] [Google Scholar]
- Bell-Pedersen D, Cassone VM, Earnest DJ, Golden SS, Hardin PE, Thomas TL, Zoran MJ. Circadian rhythms from multiple oscillators: Lessons from diverse organisms. Nat. Rev. Genet. 2005;6:544–556. doi: 10.1038/nrg1633. [DOI] [PMC free article] [PubMed] [Google Scholar]
- Boag PT, van Noordwijk AJ. Quantitative genetics. In: Cooke F, Buckley PA, editors. Avian genetics: a population and ecological approach. London: Academic Press; 1987. pp. 45–78. [Google Scholar]
- Cerasale D, Dor R, Winkler DW, Lovette IJ. Phylogeny of the Tachycineta genus of New World swallows: Insights from complete mitochondrial genomes. Mol. Phylogenet. Evol. doi: 10.1016/j.ympev.2011.12.014. In review. [DOI] [PubMed] [Google Scholar]
- Charmantier A, McCleery RH, Cole LR, Perrins C, Kruuk LEB, Sheldon BC. Adaptive phenotypic plasticity in response to climate change in a wild bird population. Science. 2008;320:800–803. doi: 10.1126/science.1157174. [DOI] [PubMed] [Google Scholar]
- Cooper CB, Voss MA, Ardia DR, Austin SH, Robinson WD. Light increases the rate of embryonic development: implications for latitudinal trends in incubation period. Funct. Ecol. 2011;25:769–776. [Google Scholar]
- Crick HQP, Gibbons DW, Magrath RD. Seasonal changes in clutch size in British birds. J. Anim. Ecol. 1993;62:263–273. [Google Scholar]
- Edwards A, Civitello A, Hammond HA, Caskey CT. DNA typing and genetic mapping with trimeric and tetrameric tandem repeats. Am. J. Hum. Genet. 1991;49:746–756. [PMC free article] [PubMed] [Google Scholar]
- Excoffier L, Laval G, Schneider S. Arlequin (version 3.0): an integrated software package for population genetics data analysis. Evol. Bioinform. 2005;1:47–50. [PMC free article] [PubMed] [Google Scholar]
- Fidler AE, Gwinner E. Comparative analysis of Avian BMALI and CLOCK protein sequences: a search for features associated with owl nocturnal behaviour. Comp. Biochem. Physiol. B Biochem. Mol. Biol. 2003;136:861–874. doi: 10.1016/s1096-4959(03)00276-8. [DOI] [PubMed] [Google Scholar]
- Gwinner E, Zeman M, Klaassen M. Synchronization by low-amplitude light-dark cycles of 24-hour pineal and plasma melatonin rhythms of hatchling European starlings (Sturnus vulgaris. J. Pineal Res. 1997;23:176–181. doi: 10.1111/j.1600-079x.1997.tb00352.x. [DOI] [PubMed] [Google Scholar]
- Hayasaka N, LaRue SI, Green CB. In vivo disruption of Xenopus CLOCK in the retinal photoreceptor cells abolishes circadian melatonin rhythmicity without affecting its production levels. J. Neurosci. 2002;22:1600–1607. doi: 10.1523/JNEUROSCI.22-05-01600.2002. [DOI] [PMC free article] [PubMed] [Google Scholar]
- Jaenisch R, Bird A. Epigenetic regulation of gene expression: how the genome integrates intrinsic and environmental signals. Nat. Genet. 2003;33:245–254. doi: 10.1038/ng1089. [DOI] [PubMed] [Google Scholar]
- Johnsen A, Fidler AE, Kuhn S, Carter KL, Hoffmann A, Barr IR, Biard C, Charmantier A, Eens M, Korsten P, et al. Avian Clock gene polymorphism: evidence for a latitudinal cline in allele frequencies. Mol. Ecol. 2007;16:4867–4880. doi: 10.1111/j.1365-294X.2007.03552.x. [DOI] [PubMed] [Google Scholar]
- Katzenberg D, Young T, Finn L, Lin L, King DP, Takahashi JS, Mignot E. A CLOCK polymorphism associated with human diurnal preference. Sleep. 1998;21:569–576. doi: 10.1093/sleep/21.6.569. [DOI] [PubMed] [Google Scholar]
- Ko CH, Takahashi JS. Molecular components of the mammalian circadian clock. Hum. Mol. Genet. 2006;15:R271–R277. doi: 10.1093/hmg/ddl207. [DOI] [PubMed] [Google Scholar]
- Liedvogel M, Sheldon BC. Low variability and absence of phenotypic correlates of Clock gene variation in a great tit Parus major population. J. Avian Biol. 2010;41:543–550. [Google Scholar]
- Liedvogel M, Szulkin M, Knowles SCL, Wood MJ, Sheldon BC. Phenotypic correlates of Clock gene variation in a wild Blue Tit population: evidence for a role in seasonal timing of reproduction. Mol. Ecol. 2009;18:2444–2456. doi: 10.1111/j.1365-294X.2009.04204.x. [DOI] [PubMed] [Google Scholar]
- O’Malley KG, Banks MA. A latitudinal cline in the Chinook salmon (Oncorhynchus tshawytschaClock gene: evidence for selection on PolyQ length variants. Proc. R. Soc. Lond. B Biol. Sci. 2008;275:2813–2821. doi: 10.1098/rspb.2008.0524. [DOI] [PMC free article] [PubMed] [Google Scholar]
- Panda S, Hogenesch JB, Kay SA. Circadian rhythms from flies to human. Nature. 2002;417:329–335. doi: 10.1038/417329a. [DOI] [PubMed] [Google Scholar]
- Perrins CM. The timing of birds’ breeding seasons. Ibis. 1970;112:242–255. [Google Scholar]
- Prinzinger R, Hinninger C. (Endogenous?) diurnal rhythm in the energy metabolism of pigeon embryos. Naturwissenschaften. 1992;79:278–279. [Google Scholar]
- Raymond M, Rousset F. GENEPOP (version-1.2)—population-genetics software for exact tests and ecumenicism. J. Hered. 1995;86:248–249. [Google Scholar]
- Rousset F. GENEPOP ‘ 007: a complete re-implementation of the GENEPOP software for Windows and Linux. Mol. Ecol. Res. 2008;8:103–106. doi: 10.1111/j.1471-8286.2007.01931.x. [DOI] [PubMed] [Google Scholar]
- Saleem Q, Anand A, Jain S, Brahmachari SK. The polyglutamine motif is highly conserved at the Clock locus in various organisms and is not polymorphic in humans. Hum. Genet. 2001;109:136–142. doi: 10.1007/s004390100550. [DOI] [PubMed] [Google Scholar]
- Saunders DS. An introduction to biological rhythms. Glasgow and London: Blackie; 1977. [Google Scholar]
- Sheldon BC, Kruuk LEB, Merila J. Natural selection and inheritance of breeding time and clutch size in the collared flycatcher. Evolution. 2003;57:406–420. doi: 10.1111/j.0014-3820.2003.tb00274.x. [DOI] [PubMed] [Google Scholar]
- Steeves TDL, King DP, Zhao Yl, Sangoram AM, Du FH, Bowcock AM, Moore RY, Takahashi JS. Molecular cloning and characterization of the human CLOCK gene: expression in the suprachiasmatic nuclei. Genomics. 1999;57:189–200. doi: 10.1006/geno.1998.5675. [DOI] [PubMed] [Google Scholar]
- Stutchbury BJ, Robertson RJ. Within-season and age-related patterns of reproductive performance in female tree swallows (Tachycineta bicolor. Can. J. Zool. 1988;66:827–834. [Google Scholar]
- Svensson E. Natural selection on avian breeding time: causality, fecundity-dependent, and fecundity-independent selection. Evolution. 1997;51:1276–1283. doi: 10.1111/j.1558-5646.1997.tb03974.x. [DOI] [PubMed] [Google Scholar]
- Tauber E, Kyriacou CP. Molecular evolution and population genetics of circadian clock genes. Methods Enzymol. 2005;393:797–817. doi: 10.1016/S0076-6879(05)93042-5. [DOI] [PubMed] [Google Scholar]
- Turner A. Family Hirundinidae (swallows and martins) In: Del Hoyo J, Elliott A, Christie D, editors. The birds of the World. Vol. 9. Barcelona, Spain: Lynx Edicions; 2004. pp. 602–685. [Google Scholar]
- van der Jeugd HP, McCleery R. Effects of spatial autocorrelation, natal philopatry and phenotypic plasticity on the heritability of laying date. J. Evol. Biol. 2002;15:380–387. [Google Scholar]
- Verhulst S, Tinbergen JM. Experimental evidence for a causal relationship between timing and success of reproduction in the Great Tit, Parus m. major. J. Anim. Ecol. 1991;60:269–282. [Google Scholar]
- Weber JL. Informativeness of human (dC-dA)n· (dG-dT)n polymorphisms. Genomics. 1990;7:524–530. doi: 10.1016/0888-7543(90)90195-z. [DOI] [PubMed] [Google Scholar]
- Whittingham LA, Slikas B, Winkler DW, Sheldon FH. Phylogeny of the tree swallow genus, Tachycineta (Aves: Hirundinidae), by Bayesian analysis of mitochondrial DNA sequences. Mol. Phylogenet. Evol. 2002;22:430–441. doi: 10.1006/mpev.2001.1073. [DOI] [PubMed] [Google Scholar]
- Winkler DW, Allen PE. The seasonal decline in Tree Swallow clutch size: physiological constraint or strategic adjustment? Ecology. 1996;77:922–932. [Google Scholar]
- Wren JD, Forgacs E, Fondon JW, Pertsemlidis, Cheng SY, Gallardo T, Williams RS, Shohet RV, Minna JD, Garner HR. Repeat polymorphisms within gene regions: phenotypic and evolutionary implications. Am. J. Hum. Genet. 2000;67:345–356. doi: 10.1086/303013. [DOI] [PMC free article] [PubMed] [Google Scholar]
- Yoshimura T, Suzuki Y, Makino E, Suzuki T, Kuroiwa A, Matsuda Y, Namikawa T, Ebihara S. Molecular analysis of avian circadian clock genes. Mol. Brain Res. 2000;78:207–215. doi: 10.1016/s0169-328x(00)00091-7. [DOI] [PubMed] [Google Scholar]
- Young MW, Kay SA. Time zones: a comparative genetics of circadian clocks. Nat. Rev. Genet. 2001;2:702–715. doi: 10.1038/35088576. [DOI] [PubMed] [Google Scholar]