

Abstract
Midbrain dopamine neurons respond to reward-predictive stimuli. In the natural environment reward-predictive stimuli are often perceptually complicated. Thus, to discriminate one stimulus from another, elaborate sensory processing is necessary. Given that previous studies have used simpler types of reward-predictive stimuli, it has yet to be clear whether and, if so, how dopamine neurons obtain reward information from perceptually complicated stimuli. To investigate this, we recorded the activities of monkey dopamine neurons while they were performing discrimination between two coherent motion directions in random-dot motion stimuli. These coherent directions were paired with different magnitudes of reward. We found that dopamine neurons showed reward-predictive responses to random-dot motion stimuli. Moreover, dopamine neurons showed temporally extended activity correlated with changes in reward prediction (i.e., reward prediction error) from coarse to fine scales between initial motion detection and subsequent motion discrimination phases. Noticeably, dopamine reward-predictive responses became differential in a later phase than previously reported. This response pattern was consistent with the time course of processing required for the estimation of expected reward value that parallels the motion direction discrimination processing. The results demonstrate that dopamine neurons are able to reflect the reward value of perceptually complicated stimuli, and suggest that dopamine neurons use the moment-to-moment reward prediction associated with environmental stimuli to compute a reward prediction error.
Introduction
Dopamine plays a central role in reward information processing (Schultz, 1998; Wise, 2004). Specifically, midbrain dopamine neurons are thought to encode a reward prediction error signal, which is the discrepancy between a predicted and actual outcome (Schultz, 1998). In addition, dopamine neurons show reward-predictive activity in response to stimuli that are associated with reward. In particular, this activity reflects the anticipated reward magnitude, reward probability, and other related variables within various behavioral contexts ranging from simple Pavlovian paradigms to sophisticated instrumental paradigms (Satoh et al., 2003; Morris et al., 2004, 2006; Nakahara et al., 2004; Bayer and Glimcher, 2005; Pan et al., 2005; Tobler et al., 2005; Ravel and Richmond, 2006; Roesch et al., 2008; Kobayashi and Schultz, 2008).
In the natural environment, reward-predictive stimuli exhibit a wide variation in terms of perceptual complexity. Here, we refer to perceptually complicated stimuli such as those which are discriminated through elaborate sensory processing in the cerebral cortex. For example, global motion signals such as found in random-dot motion (RDM) stimuli are processed in higher-order visual cortices such as the middle temporal (MT) and the medial superior temporal (MST) areas (Newsome et al., 1989; Salzman et al., 1990; Britten et al., 1992; Celebrini and Newsome, 1994), and a lesion of such brain regions disrupts discrimination performance (Newsome and Paré, 1988). Additionally, association cortices such as the lateral intraparietal (LIP) area also play an important role in making decisions regarding motion direction (Shadlen and Newsome, 2001; Roitman and Shadlen, 2002; Ditterich et al., 2003; Hanks et al., 2006). Thus, to acquire reward-related information from such perceptually complicated stimuli, stimulus features should first be processed and discriminated in respectively dedicated sensory areas of the cerebral cortex before reward value assignment.
Despite the prevalence of perceptually complicated stimuli in the environment, it has yet to be clear whether and, if so, how dopamine neurons obtain reward information from such stimuli because most previous studies have used simpler types of reward-predictive stimuli. To address these questions, we recorded neuronal activities of monkey dopamine neurons while they performed a discrimination task involving RDM stimuli consisting of a subset of dots moving in the same direction, together with the remaining dots moving randomly. We used the direction of the RDM stimulus as the reward-predictive feature. Different directions of motion stimuli were associated with different reward magnitudes. We varied the difficulty of the direction discrimination by manipulating the proportion of coherently moving dots (i.e., motion coherence). As described earlier, previous studies have shown that cortical visual processing is necessary to discriminate the direction of such motion stimuli. Because the visual cortical processing required for this discrimination takes several hundreds of milliseconds (Roitman and Shadlen, 2002), the use of reward-predictive RDM stimuli allowed us to observe when reward-predictive responses occurred and were updated. Thus, this behavioral paradigm enabled us to investigate dopamine responses to perceptually complicated reward-predictive stimuli.
Materials and Methods
Subjects.
Data were obtained from two male Japanese monkeys (Macaca fuscata, monkeys L and K), weighing 7–9.5 kg. The monkeys were moderately deprived of water and had to perform the behavioral task to obtain juice rewards. After the initial training used to familiarize the monkeys to a primate chair and the experimental room, they underwent surgery in which a head holder post was attached to the skull with dental cement. Care and surgical procedures were in accordance with the U.S. National Institutes of Health Guide for the Care and Use of Laboratory Animals and with Tamagawa University guidelines for the use and care of laboratory animals in research.
Behavioral task.
The monkeys were trained on a motion direction discrimination task (Fig. 1 A). They sat in a primate chair in a dimly lit experimental room and faced a 22 inch computer monitor (refresh rate, 60 Hz, CV921X, Totoku) placed at a distance of ∼55 cm. We used a set of dynamic RDM stimuli with two directions (right and left), and four coherence levels (0, 10, 25, and 50% for monkey L; 0, 5, 15, and 50% for monkey K; different sets of coherence levels were used between the monkeys to roughly match their performance levels). At the zero coherence level, motion direction was randomly assigned as either “rightward” in half of the trials or “leftward” in the other half. In an RDM display, a set of dots was presented for one video frame within a virtual 16.2° diameter circular aperture at the center of the monitor (dot density, 18.8 dots deg−2 s−1), and reappeared three video frames later (∼50 ms = 16.7 ms × 3 frames later) (Shadlen and Newsome, 2001; Roitman and Shadlen, 2002). When replotted, a portion of dots was plotted in a constantly offset position to create apparent motion, whereas the remaining dots were plotted in random positions. In sum, a set of dots in the first video frame was replotted in the fourth video frame. The other two sets of dots were shown in the second and third video frames, and replotted in the fifth and sixth video frames, respectively. Speed of motion was varied between the monkeys to roughly match their respective performance levels (6.5° s−1 for monkey L; 16.2° s−1 for monkey K). A trial started with the appearance of a fixation point (FP) at the center of the monitor. After a variable delay of 0.5–1.5 s (with flat distribution), a dynamic RDM stimulus and two peripheral targets were presented at the same time, after which the monkeys were free to make a saccade to one of two targets to indicate their direction choice. The RDM stimulus disappeared when the monkey made an eye movement. The time interval between the onsets of the FP and the RDM stimulus was designated as the pre-RDM interval. When the monkey chose correctly, a high pitch feedback tone (1000 Hz, 0.2 s) was delivered after a 0.5 s gaze at the target, and a juice reward was delivered immediately after the offset of the tone. When the choice was incorrect, only a low pitch feedback tone (400 Hz, 0.2 s) was delivered, and there was an additional 5 s timeout as a penalty. It should be noted that the feedback tones did not carry information about reward magnitude. An intertrial interval lasted from 4 to 6 s. An asymmetric reward schedule was used (Fig. 1 B).
Figure 1.

Behavioral task and behavioral performance. A, Time course of the motion direction discrimination task. B, Schema of asymmetric reward schedule. Reward-direction contingencies were reversed from block to block. The size of a white teardrop mark indicates reward magnitude associated with the particular motion direction (large mark, 0.38 ml; small mark, 0.16 ml). The amount of reward upon correct response was determined by the direction of the motion stimulus. Coherence levels for monkey K are shown at the upper row for display purposes. C, Effects of motion coherence and the reward schedule on monkeys' choices. Monkeys tended to respond in the direction associated with a large reward. Rightward large-reward blocks (black) and rightward small-reward blocks (gray) are shown separately. Circles and error bars represent the means and SDs of the choice rate across all sessions, respectively. Choice data were fitted to a logistic function. The vertical axis indicates the proportion of rightward saccades. The horizontal axis indicates the motion coherence (a positive value indicates a rightward motion; a negative value indicates a leftward motion). D, Saccadic reaction time. The data were sorted by motion coherence levels and directions, which are associated with large reward (black bars) and small reward (gray bars). Only correct trials were analyzed. Error bars represent SDs across all sessions.
One particular direction of motion was associated with a large reward (0.38 ml) in a given block, and the other was associated with a small reward (0.16 ml). The direction-reward contingency was fixed throughout a given block and reversed in the subsequent block. The trial types (combinations of motion direction and coherence) were pseudo-randomized within a sub-block of 14 trials. In one sub-block, there were two trials per direction at each coherence level except for the zero coherence level, and there were two trials (randomly assigned as rightward and leftward) for the zero coherence condition. Trials whose motions indicated large rewards (the large-reward condition) and those whose motions indicated small rewards (the small-reward condition) were intermixed. A block consisted of 9–12 sub-blocks. To motivate monkeys to perform correctly even when they anticipated a small reward, incorrect trials were followed by a trial with the same trial type (i.e., a correction trial). This prevented the monkeys from passing the small-reward trials. Since the monkeys appeared to use a different task strategy in correction trials (i.e., simply switching the previously erroneous choice), as was evidenced by their very high correct choice rate (>95% accuracy even at the zero coherence level in both monkeys), we excluded the data from correction trials for analysis unless otherwise noted.
Localization of the recording sites.
After completion of behavioral training, we estimated the location of the substantia nigra (SN) by proton density-enhanced magnetic resonance (MR) images (Oikawa et al., 2002). We placed a round recording chamber (Crist Instrument) on the skull with dental cement so that the center of the recording chamber targeted the substantia nigra pars compacta (SNc). The recording chamber was tilted 30° laterally in the coronal plane. The chamber's coordinate system was adjusted according to the MR images (Kawagoe et al., 1998). All MR imaging procedures were performed under deep general anesthesia.
Recording and data acquisition.
The monkey's head was fixed during the recording experiments. Eye movements were monitored by an infrared camera system at a sampling rate of 240 Hz (Eye Trac 6000, ASL). Using a hydraulic manipulator (MO-95, Narishige), an epoxy-coated tungsten electrode (shank diameter, 0.25 mm, 0.5–1.5 MΩ measured at 1000 Hz, FHC) was inserted into the brain within a stainless 23G guide tube that extended through a plastic grid (Crist Instrument). The neural activity was amplified, filtered (gain, 10,000×, bandpass filter, 10–3000 Hz, notch filter, 50 Hz, Iso-DAM8, WPI; high-pass filter, 50 Hz, P-84, NF Corporation), and sorted online using a template-matching algorithm (ASD, Alpha-Omega Engineering). Upon reaching the target area (as judged by the electrode depth and by the electrophysiological characteristics of the structures encountered along the penetration), dopamine neurons were identified according to their low tonic irregular spontaneous firing rates (<10 Hz), relatively long duration of action potentials (>1.5 ms), and transient responses to unexpected reward delivery. Spike-detection pulses and behavioral events were sampled and stored at 1000 Hz (TEMPO, Reflective computing).
Behavioral data analysis.
We expected that the monkeys' direction choices would be biased due to the asymmetric reward schedule. To quantify monkeys' choice behavior, we fitted choice data to a logistic function using the psignifit toolbox version 2.5.6 for Matlab (http://bootstrap-software.org/psignifit/) which implements the maximum-likelihood method (Wichmann and Hill, 2001a). The proportion of rightward choices as a function of motion coherence was fitted to the following equation.
 |
where C indicates the motion coherence (−0.5 ≤ C ≤ 0.5; the positive and negative values corresponding to rightward and leftward directions, respectively), α represents the bias in units of the motion coherence, β determines the steepness of the psychometric curve, and γ and λ indicate the lower and upper boundaries of the psychometric curve, respectively. The bias indicates the motion coherence at which the proportion of rightward choices is 50%. The sensitivity for discrimination is represented by the slope of the psychometric curve at the point of bias. The bias and the slope were used for the statistical significance testing (H0: difference between the biases or the slopes = 0; randomization test, iterations = 4000) (Wichmann and Hill, 2001b). In this study, γ and λ were nearly zero, and thus ignored in the results.
Neural data analysis.
We analyzed only the trials in which the monkey made directional choices and we excluded trials in which the monkey broke fixation before the onset of the RDM stimuli. Since behavioral changes after the reversal of the direction-reward contingency (e.g., changes in reaction times) were found to occur within two sub-blocks, we excluded the data from the two sub-blocks after the contingency reversal so that we could focus on the neural activity after learning rather than during learning. Dopamine responses evoked by the task event were calculated as the difference between baseline activity and neural activity during the standard peri-event time window, which was determined based on neural selectivity at the population level. Neural selectivity was assessed for each bin of population responses (sliding window analysis; bin width = 20 ms, sliding step = 20 ms), and standard time windows were determined as the bins that showed a significant difference (from the first of three consecutive bins to the last bin; p < 0.05, Wilcoxon paired signed-rank test). Baseline activity was measured during the 200 ms before the corresponding event. For the analysis of FP-evoked responses, we used the time window during which dopamine neurons showed significantly differential activity from the baseline, 100–259 and 100–239 ms after the onset of the FP for monkeys L and K, respectively. For RDM-evoked responses, to separately analyze trial-type-independent and trial-type-dependent dopamine responses, two time windows were determined by three sliding window analyses: activity modulation from the baseline, comparison between correct large- and small-reward conditions (indicative of modulation by reward magnitude), and comparison between zero and high coherence levels (indicative of modulation by reward probability). One time window, which reflected trial-type-independent responses, was defined as the interval from the time when neural activity began to show a significant modulation compared with the baseline, to the time immediately before neural activity began to show a significant trial-type-dependent modulation, namely, at 80–219 and 100–199 ms after the onset of the RDM stimuli for monkeys L and K, respectively. We referred to this time interval as the early period. The other time window, which reflected trial-type-dependent responses, was defined as the interval during which neural activity showed a significant modulation by trial type (either direction or coherence), namely, at 220–439 and 200–519 ms after the onset of the RDM stimuli for monkeys L and K, respectively. We referred to this time interval as the late period. For the analysis of feedback-tone-evoked responses, we used the time window during which neural activity was modulated by the trial outcome (correct or erroneous), namely, at 100–299 and 140–379 ms after the onset of the feedback tones for monkeys L and K, respectively. Because putative dopamine neurons showed qualitatively similar responses in the present study, these time windows were applied to all recorded neurons. We collapsed dopamine responses across the saccade directions because we found that dopamine activity was modulated by reward-related variables rather than saccade direction (contraversive vs ipsiversive), consistent with previous studies (Kawagoe et al., 2004; Matsumoto and Hikosaka, 2007). In addition, although midbrain dopamine neurons have not been believed to have distinct receptive fields (Schultz, 1998), potential receptive field effects of dopamine neurons were minimized by presenting the RDM stimulus at the center of the monitor. For display purposes, we created a population spike-density function by averaging all spike-density functions of single neurons using Gaussian kernel smoothing with σ = 10 ms. For population analysis, the minimum acceptable number of trials per condition was set to five. We also set the minimum acceptable number of neurons per condition to five. All data analyses were conducted using custom-made software coded with Matlab 7 (MathWorks).
Histological examination.
At the end of the recording experiments with monkey K, we made small lesions at the electrode positions in the right hemisphere by applying DC currents (20 μA for 20–60 s). We decided not to mark the recording sites in the left hemisphere due to bleeding complications at 3 of 35 sites. After the recording experiments were completed, we gave the monkey a lethal dose of pentobarbital sodium. The brain was transcardially perfused with 4% paraformaldehyde in PBS, and cut in 60 μm-thick serial coronal sections, which were subsequently subjected to Nissl staining and to anti-tyrosine hydroxylase (TH) immunohistochemistry (every six sections; anti-TH antibody, 1:1000, Novus). The recording area was estimated based on the location of the microlesions. The anteroposterior extent of the recorded area was determined according to the brain atlas of Kusama and Mabuchi (1970).
Results
Behavior
Two Japanese monkeys performed a visual discrimination task involving the RDM stimuli (Fig. 1 A). The monkeys indicated directional choices with saccadic eye movements. Only correct responses were rewarded with juice (correct responses were randomly determined at the zero coherence level). We used four different levels of motion coherence. As expected, when the data were collapsed across the two directions, the probabilities for correct choice increased with the degree of coherence (49.0 ± 12.1, 66.9 ± 6.5, 85.1 ± 7.2, and 98.8 ± 0.2% at 0, 10, 25, and 50% coherence levels, respectively, for monkey L; 52.1 ± 12.7, 64.0 ± 9.5, 82.8 ± 8.1, and 99.8 ± 0.7% at 0, 5, 15, and 50% coherence levels, respectively, for monkey K; mean ± SD across sessions, N = 41 and 35 for monkeys L and K, respectively). In the following analysis, we considered the correct performance rate as reward probability at the particular coherence level.
The monkeys' choice behavior was biased because we used an asymmetric reward schedule (Fig. 1 B). To quantify the effect of reward contingency on choice behavior, choice data were fitted to a logistic function (Fig. 1 C). There was a significant difference in the biases during different reward contingencies (p < 0.05 for both monkeys by randomization test, iterations = 4000). The biases in “rightward large-reward” blocks and “rightward small-reward” blocks were −0.1522 and 0.0687 for monkey L, −0.0582 and 0.0748 for monkey K, in units of the motion coherence. In contrast, no significant difference was found in the slopes during different reward contingencies (the slopes in the rightward large-reward blocks and rightward small-reward blocks were 2.2379 and 2.3843 for monkey L and 3.3793 and 2.8217 for monkey K; p > 0.05 for both monkeys by randomization test, iterations = 4000). These results suggested that, whereas the sensitivity did not change as a result of direction-reward contingency, the bias in fact did change, such that both monkeys became more likely to choose the direction associated with a large reward in a given block.
Saccadic reaction times also differed according to the direction-reward contingency (Fig. 1 D). A two-way ANOVA was applied with the factors of motion coherence (zero, low, medium, and high coherence levels), and direction (those associated with large and small reward magnitudes). Reaction times to motions indicating large rewards were significantly shorter than those to motions indicating small rewards (p < 0.001 for both monkeys, two-way ANOVA). Reaction time modulation by coherence levels also reached significance (p < 0.001 for both monkeys, two-way ANOVA). There was no significant interaction between direction and coherence factors (p > 0.10 for both monkeys, two-way ANOVA).
Neurophysiology
General
Proton density-enhanced MR images were used to localize the SN. Dopamine neurons were identified based on electrophysiological criteria, neuronal characteristics of the neighboring structures and responsiveness to unexpected reward delivery. We recorded activity from 76 putative dopamine neurons (41 from monkey L and 35 from monkey K). All reconstructed recording sites in the right hemisphere of monkey K were located in or around the SNc, as verified by histological examination (Fig. 2). The recording sites for monkey L were estimated from both MR images and depth profiles of neural activity along electrode penetrations.
Figure 2.

Recording sites. A, A representative digitized image of the recording sites with Nissl staining. Tilted lines indicate electrode tracks. Ticks represent microlesions. Filled circles indicate the recording sites of putative dopamine neurons. Scale bar, 500 μm. Inset, Magnified image around the microlesion (a rectangular area in the Nissl staining image) from an adjacent slice with anti-TH immunohistochemistry. Black neurons correspond to TH-immunoreactive cells. B, Reconstruction of the recording sites in the right hemisphere of monkey K. Numbers indicate the anteroposterior level. Tilted lines indicate electrode tracks. Filled circles indicate the recording sites of putative dopamine neurons. We delineated the areas rich with dopamine neurons according to the anti-TH staining slices. SNr, Substantia nigra pars reticulata; NIII, oculomotor nerve outlets; RNm, magnocellular red nucleus.
A typical response from a dopamine neuron is shown in Figure 3 A. The pictured dopamine neuron responded to reward-predictive RDM stimuli in a more temporally extended form than has been previously reported (Schultz, 1998). The early part of these responses did not change according to trial type (a combination of motion direction and coherence), while the late part did. We also observed trial-type-independent early and trial-type-dependent late components of dopamine responses at the population level (Fig. 3 B). To analyze the modulation by trial type, we divided RDM-evoked responses into two time windows based on neural selectivity at the population level (see Materials and Methods).
Figure 3.

Dopamine responses at the single neuron and population levels aligned with the time of RDM or saccade onset. A, Typical RDM-evoked responses of a single dopamine neuron (monkey L). Spike raster plots and histograms are aligned with the time of RDM onset (binwidth = 20 ms). Spike raster plots are sorted by saccadic reaction times for display purposes. Gray cross marks in spike raster plots indicate the time of saccade onset. The vertical axis shows the firing rate of dopamine activity. Each column corresponds to the trial conditions in which a certain amount of reward, either large (0.38 ml) or small (0.16 ml), was delivered upon a correct response. Each row shows each coherence level. Only correct trials were shown except at the zero coherence level. At the zero coherence level, we showed all trials and sorted neural activity based on the monkeys' choices. B, Population RDM-evoked responses of monkeys L and K (N = 41 and 35, respectively). The data are aligned with the time of RDM onset. The vertical axis shows the firing rate of dopamine activity. Line colors indicate reward conditions (black, large-reward condition; gray, small-reward condition). Dashed vertical and horizontal lines indicate the means and SDs of the time of saccadic onset, respectively. Each row shows each coherence level. C, Population saccade-aligned responses of monkeys L and K (N = 41 and 35, respectively). The data are aligned with the time of saccade onset. The vertical axis shows the firing rate of dopamine activity. Line colors indicate reward conditions (black, large-reward condition; gray, small-reward condition). Dashed vertical and horizontal lines indicate the means and SDs of the time of RDM onset, respectively. Each row shows coherence level.
We confirmed that neural selectivity at the population level held true at the single neuron level. A majority of single dopamine neurons showed significant modulation of the late-period responses by trial type, the main effect of reward magnitude associated with the motion direction (65/76 neurons), and the main effect of reward probability associated with the motion coherence (48/76 neurons), and interaction found among 26/76 neurons (p < 0.05, two-way ANOVA). In contrast, a few dopamine neurons showed significant modulation in their early-period responses according to trial type (main effect of reward magnitude associated with the motion direction, 5/76 neurons; main effect of reward probability associated with the motion coherence, 4/76 neurons; interaction, 4/76 neurons; p < 0.05, two-way ANOVA). In the following analyses, we used all putative dopamine neurons (76 neurons) unless otherwise noted.
We also examined population dopamine activity aligned with the time of saccade onset, which indicated the boundary of decision formation (Fig. 3 C). The early-period RDM-evoked responses were smaller in the saccade-onset-aligned condition than those in the RDM-onset-aligned condition. This suggested that the early-period RDM-evoked responses were tightly coupled with the onset of the RDM stimulus. In contrast, a more pronounced reduction of late-period RDM-evoked responses in the saccade-onset-aligned condition was not found, when compared with the RDM-onset-aligned condition. This suggested that the late-period RDM-evoked responses were coupled with the onset of the RDM stimulus to a similar extent as with the saccade onset.
Coding of prediction errors in reward value
We found that dopamine neurons showed temporally extended responses, which consisted of trial-type-independent early-period responses and trial-type-dependent late-period responses. Since the motion direction indicates reward magnitude and the motion coherence determines the correct performance rate (which in turn determines reward probability at the particular coherence level), the trial type specifies the expected reward value. This indicated that late-period RDM-evoked responses reflected trial-type-dependent expected reward value around the time of motion discrimination. We further reasoned that the extended dopamine responses reflected a change in reward prediction between the times at which RDM stimuli were detected and then were discriminated.
We first consider how reward prediction varied during the present task. Because discrimination of an RDM stimulus takes longer than discrimination of a simpler visual stimulus, reward prediction would change during the time course of the motion discrimination process. We conjecture that reward prediction occurs in four stages during this task. First, reward prediction should be nearly zero before the beginning of a trial. Second, upon trial commencement, reward prediction should be the average reward magnitude obtained within a session (V session) until the RDM stimulus has been discriminated. Third, reward prediction would thereafter change in accordance with the average reward magnitude obtained for a given trial type (V trialtype). Fourth, reward prediction should become certain (V reward; either 0.38, 0.16 or 0 ml) once the feedback tones were presented. Thus, there would be three distinct changes in reward prediction, which are referred to as δsession (= V session − 0), δtrialtype (= V trialtype − V session), and δreward (= V reward − V trialtype).
Next, we consider which dopamine responses corresponded to δsession, δtrialtype, and δreward. According to previous studies, dopamine neurons show phasic activation in response to external task events, particularly when the events update reward information (Schultz, 1998). First, for dopamine responses that reflected trial-type-independent δsession, we examined three possibilities: (1) FP-evoked responses alone, (2) early-period RDM-evoked responses alone, and (3) summation of both responses. Second, we considered that late-period RDM-responses reflected δtrialtype because these responses were trial-type-dependent. Third, we reasoned that feedback-tone-evoked responses reflected δreward, because the feedback tones indicated whether or not the monkey actually obtained reward at the end of the trial.
We examined how well reward prediction error explained dopamine responses (Fig. 4). Only data from correct trials were used to compute dopamine responses except for zero coherence motions. For zero coherence motions, late-period RDM-evoked responses and V trialtype were calculated using all trials at the zero coherence level, regardless of whether trial outcome was correct or erroneous. Late-period RDM-evoked responses were positively correlated with the reward prediction error, δtrialtype, in the large-reward condition (black circles in Fig. 4; r = 0.8804 and 0.9166 for monkeys L and K, respectively). In contrast, late-period RDM-evoked responses were not sensitive to reward prediction error in either the small-reward condition or zero coherence condition (white circles and diamonds in Fig. 4, respectively).
Figure 4.
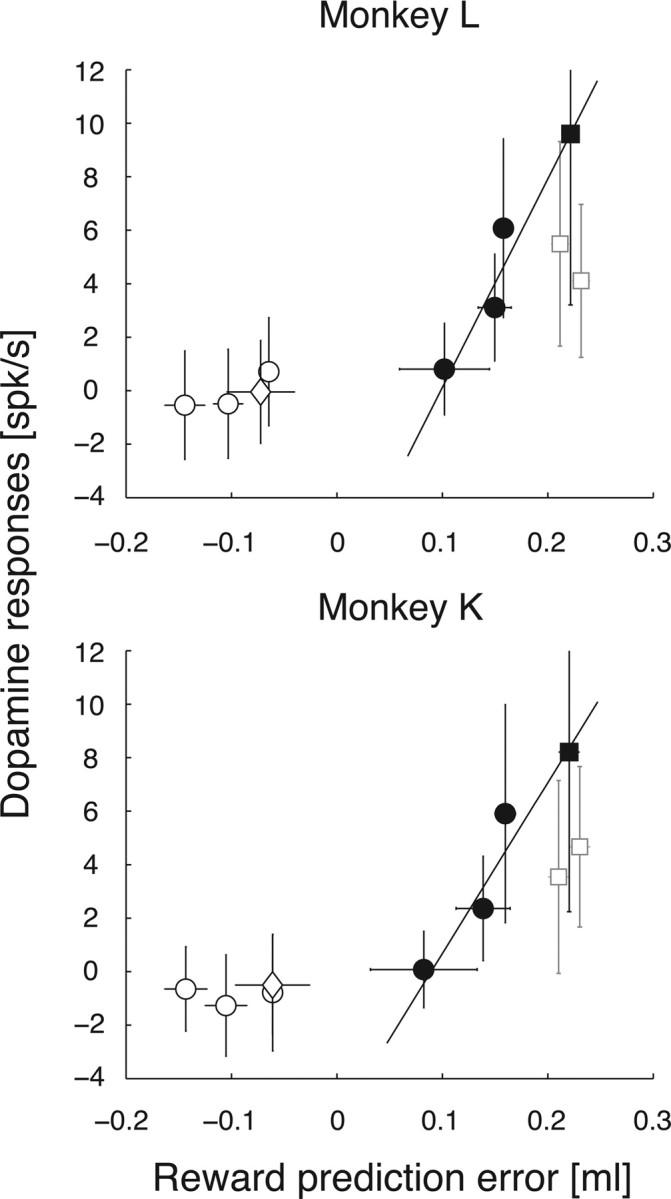
Prediction error coding in reward value. Comparison between dopamine responses and reward prediction errors. Reward prediction errors are calculated as an average amount of juice reward (see Results). The line is fit to the data points corresponding to late-period RDM-evoked responses in the large-reward condition (black circles) and the summation of FP-evoked and early-period RDM-evoked responses (black square) by weighted type II regression (Press et al., 1992). Late-period RDM-evoked responses in the small-reward condition and zero coherence condition are represented by white circles and diamond, respectively. FP-evoked (gray square in the left) and early-period RDM-evoked responses (gray square in the right) are shown for comparison with the summation of both responses (black square). These points are horizontally jittered only for display purposes. Horizontal and vertical error bars represent SDs. The vertical axis shows dopamine responses. The horizontal axis shows reward prediction errors as juice quantity.
Next, to examine three possibilities regarding δsession, we included another data point (black or gray squares in Fig. 4) into the correlation analysis. Pairing the summation of FP-evoked and early-period RDM-evoked responses (black squares in Fig. 4) with δsession yielded better positive correlation between dopamine responses and reward prediction error (r = 0.9670 and 0.9672 for monkeys L and K, respectively), compared with two other possibilities [r = 0.6169 and 0.8059 for monkeys L and K, with only FP-evoked responses (left gray square in Fig. 4) considered; r = 0.8036 and 0.7032 for monkeys L and K, with only early-period RDM-evoked responses (right gray square in Fig. 4) considered]. This suggested that FP-evoked and RDM-evoked dopamine responses could be accounted for by reward prediction error when reward prediction error was positive and that these responses reflected changes in reward prediction between periods of motion detection and discrimination.
Feedback-tone-evoked responses also showed reward prediction error coding (Fig. 5). At the zero coherence level, dopamine responses and V reward were calculated separately for correct and erroneous trials and V trialtype was calculated using all trials in the zero coherence condition. Dopamine responses in correct trials were positively correlated with reward prediction error (r = 0.7672 and 0.9090 for monkeys L and K, respectively). In contrast, dopamine responses in error trials were not sensitive to reward prediction error. In particular, dopamine responses to error feedback tones showed response suppression, indicating the presence of a negative prediction error.
Figure 5.

Population dopamine responses aligned with the time of feedback tone onset. A, Population spike density functions are aligned with the time of feedback tone onset. As poor discrimination for less coherent motion resulted in low reward probability, the reward prediction error would be large at low coherence levels. Indeed, dopamine responses to feedback tones were the largest at zero coherence and decreased with increasing motion coherence. In addition, there was a significant suppression in dopamine activity in response to the error feedback tones, indicating negative reward prediction error coding. The vertical axis shows the firing rate of dopamine activity. Black and gray solid lines indicate dopamine activity in large- and small-reward correct trials, respectively. Red solid lines correspond to dopamine activity in small-reward error trials, resulting in no reward delivery. Because there were not enough trials for this condition, dopamine activity of small-reward correct trials was missing at the zero coherence level. Each row shows each coherence level. Note that the actual reward was delivered 200 ms after the feedback tone signaling a correct response. B, Comparison between feedback-tone-evoked responses and reward prediction errors. Reward prediction errors are calculated as an average amount of juice reward (see Results). The line is fit to the data points corresponding to correct trials (black and gray symbols) by weighted type II regression (Press et al., 1992). Dopamine responses in error trials are represented by red symbols. The large-reward, small-reward, and zero coherence condition are represented by circles, squares, and diamond, respectively. Horizontal and vertical error bars represent SDs. The vertical axis shows dopamine responses. The horizontal axis shows reward prediction errors as juice quantity.
Moreover, we examined the effect of reward history on both FP-evoked and the early-period RDM-evoked responses. As previous studies have shown that recent reward history influences dopamine activity (Nakahara et al., 2004; Bayer and Glimcher, 2005), it is possible that FP-evoked or early-period RDM-evoked responses (which reflected δsession), were affected by reward history. We performed a linear regression analysis separately for FP-evoked and early-period RDM-evoked responses: Y i = β0 + β1 O i-1 + β2 O i-2 + β3 O i-3 + … + β10 O i-10, where Y i and O i indicate dopamine responses and the obtained reward magnitude on the ith trial (we included the data from correction trials for O i), and the β represent regression coefficients. For either FP-evoked or early-period RDM-evoked responses, results of the regression analysis showed that each regression coefficient (β1-10) was not significantly different from zero in a majority of dopamine neurons [68–75 of 76 neurons (89.5–98.7%), p > 0.05]. This suggests that FP-evoked and early-period RDM-evoked responses did not reflect the recent reward history.
Coding of temporal prediction errors of the occurrence of reward-predictive stimuli
Previous studies showed that dopamine activity reflected a temporal prediction error of the occurrence of the primary reward. In Pavlovian conditioning, when an expected reward is omitted, dopamine activity shows suppression compared with baseline activity just after the predicted timing of reward delivery (Hollerman and Schultz, 1998). Moreover, dopamine neurons show gradual decreases in baseline activity when reward expectation grew gradually during a variable conditioned stimulus–reward interval in Pavlovian conditioning (Fiorillo et al., 2008). These results suggest that, when the delivery of the primary reward becomes more predictable, dopamine neurons show a decrease in activity.
We examined whether this was the case with reward-predictive sensory stimuli, of a different sensory modality than the primary reward. In the present study, since the duration of the pre-RDM interval was randomly sampled from a uniform distribution between 0.5 and 1.5 s, the conditional probability of RDM occurrence increased toward the end of the variable pre-RDM interval. Thus, the onset of the RDM stimuli became increasingly more predictable, and the prediction error for RDM appearance should decrease with elapsed time. If neuronal activity reflected a prediction error with regard to RDM occurrence, the activity should decrease as the pre-RDM interval increases.
A population analysis showed that dopamine early-period activity decreased with the duration of the pre-RDM interval (Fig. 6 A). Linear regression analysis revealed a significant negative correlation between the early-period activity and the pre-RDM interval (p = 1.0 × 10⁻⁴ and 0.016 for monkeys L and K, respectively; H0: slope of regression line = 0; Fig. 6 B, white squares), whereas the late-period activity did not show a significant modulation (p > 0.10 for both monkeys; H0: slope of regression line = 0; Fig. 6 B, black circles). Thus, consistent with our hypothesis, we found that the early-period activity decreased with increasing pre-RDM intervals, suggesting that the early-period activity reflected temporal prediction errors of the occurrence of RDM stimuli.
Figure 6.

Temporal prediction error coding. A, Population spike density functions sorted by the duration of the pre-RDM interval (N = 41 and 35 for monkeys L and K, respectively). The data are aligned with RDM onset. The early-period activity decreases with the duration of the pre-RDM interval. The vertical axis shows the firing rate of dopamine activity. Line colors indicate the duration of the pre-RDM interval (see inset). B, Coding of prediction errors against increasing expectation of the appearance of the RDM stimulus. The early-period activity was negatively correlated with the duration of the pre-RDM interval (white squares; Y = 16.1 − 4.59X for monkey L, Y = 13.3 − 2.83X for monkey K; where Y denotes the firing rate, and X denotes the duration of the pre-RDM interval), whereas the late-period activity showed far smaller modulation (black circles; Y = 4.88 + 0.35X for monkey L, Y = 6.52 − 0.08X for monkey K). Symbols represent the grand averages of dopamine activity of the trials in which the pre-RDM interval was within a 200 ms window centered at the time indicated by the horizontal axis. Note that all motion directions and coherence levels were collapsed. Error bars indicate SDs. C, Schematic illustration of decomposition of the early-period activity. The early-period activity can be decomposed into baseline activity and RDM-evoked response. Baseline activity was measured during the 200 ms before RDM onset. RDM-evoked response was calculated by subtracting baseline activity from the early-period activity. D, Reductions in baseline activity and in RDM-evoked response contributed to time-dependent decrease in the early-period activity. We decomposed the early-period activity into two factors: baseline activity and RDM-evoked response. Both baseline activity (white squares; Y = 6.16 − 1.46X for monkey L, Y = 6.16 − 0.74X for monkey K) and RDM-evoked response (black circles; Y = 9.91 − 3.13X for monkey L, Y = 6.64 − 2.09X for monkey K) were negatively correlated with the duration of the pre-RDM interval. Symbols represent the grand averages of dopamine activity of the trials in which the pre-RDM interval was within a 200 ms window centered at the time indicated by the horizontal axis. Note that all motion directions and coherence levels were collapsed. Error bars indicate SDs.
The early-period activity can be decomposed into baseline activity and an early-period RDM-evoked response (Fig. 6 C). We examined whether the time-dependent decrease in the early-period activity was due to a reduction in baseline activity or in the early-period RDM-evoked response. To examine this quantitatively, we plotted baseline activity and early-period RDM-evoked response as a function of the duration of preceding pre-RDM interval (Fig. 6 D). Both baseline activity (p = 4.2 × 10⁻⁴ and 0.028 for monkeys L and K, respectively; H0: slope of regression line = 0; Fig. 6 D, white squares) and RDM-evoked response (p = 4.0 × 10⁻⁴ and 0.047 for monkeys L and K, respectively; H0: slope of regression line = 0; Fig. 6 D, black circles) showed a significant reduction in magnitude with increasing elapsed time. Accordingly, the decrease in the early-period activity reflects reductions both in baseline activity and in RDM-evoked response.
Relation between neuronal profile and recording depth
Results of our analyses showed that temporally extended dopamine responses were sensitive to the temporal predictability of RDM appearance (i.e., the early-period RDM-evoked responses) and to expected reward value (particularly, late-period RDM-evoked responses). To test whether these sensitivities are reflected in differently located populations of dopamine neurons, we examined the relation between these neuronal sensitivities and the recording depth of each neuron. Because we had used an oblique approach to the SN, deeper recording sites corresponded to more ventromedial regions of the SN. As an index of sensitivity for temporal predictability, we used the slope of the linear regression: Y i = β0 + βT T i (Y i and T i indicate the early-period RDM-evoked responses and the duration of the pre-RDM interval on the ith trial, respectively, and β represent regression coefficients). As indices of sensitivity for reward value, we used the slopes of the linear regressions: Y i = β0 + βR R i (Y i and R i, respectively, indicating the late-period RDM-evoked responses on the ith trial and average reward magnitude of the corresponding trial type within a session, and β representing regression coefficients), and Y i = β0 + βO Oi (Y i and O i indicating the feedback-tone-evoked responses and the obtained reward magnitude on the ith trial, respectively, and β representing regression coefficients).
There was no correlation found between recording depth and sensitivity for temporal predictability (Fig. 7 A; p > 0.10 for both monkeys). This suggests that dopamine neurons that are sensitive to temporal predictability are not segregated in the dorsolateral-ventromedial axis of the SN. In contrast, there were significantly positive correlations between recording depth and reward sensitivities (Fig. 7 B,C; p < 0.05 for both monkeys). This suggests that dopamine neurons in the ventromedial SN [possibly including ventral tegmental area (VTA) neurons] tend to show higher sensitivity to reward value than those in the dorsolateral SN. The magnitudes of baseline activity, FP-evoked responses, and early-period RDM-evoked responses were not correlated with recording depth (p > 0.10 for both monkeys).
Figure 7.

Neuronal profile and recording depth. Relation between recording depth and neuronal profile: neuronal sensitivity for temporal predictability (A) and for reward value (B, C). The vertical axis shows neuronal sensitivity, which was indexed by the slope of the corresponding regression line (see Results). The horizontal axis shows recording depth, which was measured from a reference depth (i.e., the tip of the guide tube). This depth corresponded to the depth just beneath the dura. Each point represents an individual neuron. Black symbols represent the neurons in which the slopes were significantly different from zero.
Discussion
In the present study, we examined dopamine responses to reward-predictive RDM stimuli to test whether and how dopamine neurons respond to perceptually complicated reward-predictive stimuli. Because visual cortical processing required for discrimination of the RDM direction takes longer than visual discrimination of simple stimuli, the use of reward-predictive RDM stimuli allowed us to see when reward-predictive responses occurred and were updated. We found that dopamine neurons showed temporally extended responses to perceptually complicated reward-predictive stimuli. These extended responses consisted of trial-type-independent early-period activity and trial-type-dependent late-period activity, and might reflect changes in reward prediction between the point of detection and the point of discriminating the RDM stimulus. In particular, dopamine reward-predictive responses became differential much later than has been previously reported. This pattern of neuronal activities is consistent with the time course required for estimation of expected reward value that parallels the motion discrimination processing. These results demonstrate that dopamine neurons are able to obtain reward information from perceptually complicated reward-predictive stimuli, and suggest that dopamine prediction error signals are computed by using moment-to-moment reward prediction of reward-predictive stimuli.
By using perceptually complicated reward-predictive stimuli, we can dissociate trial-type-independent early-period activity from trial-type-dependent late-period activity. In particular, this trial-type-dependent activity appeared in a later phase than previously reported. Whereas differential reward-predictive responses appeared ∼100 ms after the onset of conditioned stimuli in most previous studies, in the present study, the trial-type-dependent activity appeared ∼200–220 ms after RDM onset. This is consistent with a time course in which neural discrimination begins at ∼200 ms after RDM onset in the LIP area (Roitman and Shadlen, 2002). In previous studies, a trial-type-dependent component may appear earlier, overlapping a trial-type-independent component, and thus, only monophasic activation may have been reported. This probably reflects the much shorter time required for discrimination of simpler conditioned stimuli used in previous studies.
These observations are consistent with a theoretical account regarding the stimulus generalization responses from the viewpoint of the perceptual aspects of reward-predictive stimuli (Kakade and Dayan, 2002). The stimulus generalization responses are the composite response pattern of brief activation and subsequent suppression to sensory stimuli that are not associated with reward (Schultz and Romo, 1990; Horvitz et al., 1997; Waelti et al., 2001; Tobler et al., 2003). Because such sensory stimuli were often perceptually similar to conditioned stimuli, there should be a delay between the detection and discrimination of those stimuli. Kakade and Dayan proposed that due to the time taken for the discrimination, dopamine neurons first show average responses before the stimuli are discriminated. Once the stimuli are discriminated, dopamine neurons show differential activity depending on the reward associated with those stimuli, resulting in the composite pattern of the stimulus generalization responses. Our experimental results support their proposal, suggesting that reward-related responses of dopamine neurons reflect ongoing discrimination and valuation processes in the brain.
Our results also showed that temporally extended dopamine responses reflected reward prediction error between the times of motion detection and discrimination. Although high correlation coefficients do not necessarily indicate that dopamine neurons use reward prediction error coding between the point of motion detection and discrimination, some evidence supports this hypothesis. First, the brain appears to have some reward expectation before motion discrimination. For example, we found that dopamine neurons did not show considerable late-period RDM-evoked responses in the small-reward condition despite the fact that the monkeys were supposed to have a significant amount of reward upon correct choices. This indicates that late-period RDM-evoked responses reflected a change of reward prediction from a reference point, but not from zero. A reasonable assumption might be to consider the average reward value obtained in a session as a reference point. Results of the linear regression analysis showed no effect of recent reward history on dopamine responses, suggesting that the reference reward value was quite stable, possibly due to the long-term behavioral training and neural recording experiments. Second, the appearance of FP-evoked reward-predictive neural responses in the amygdala have previously been reported (Belova et al., 2008). It is plausible that the appearance of the FP and/or the RDM stimulus has motivational value because it indicates successful transition of task state. Third, dopamine responses have been known to show a substantially linear relationship with reward prediction error within the range of the amount of juice reward that we used in our study (Tobler et al., 2005). Together, our results showed that when reward prediction error took a positive value, dopamine neurons showed reward prediction error coding throughout the task. In contrast, RDM-evoked and feedback-tone-evoked responses were not sensitive to the negative value of reward prediction error. This may be explained by a floor effect due to the low baseline firing rate of dopamine neurons.
Pairing the summation of FP-evoked and early-period RDM-evoked responses with δsession yielded better correlation than the two other hypotheses. If the appearance of the FP perfectly signaled the subsequent sequence of the motion discrimination task, there would be no reward prediction error upon the appearance of the RDM stimulus. However, since there were some uncertainties (e.g., the possibility of other kinds of behavioral task such as the visually guided saccade task, and the temporal uncertainty of the appearance of the RDM stimulus), it might not be surprising that dopamine neurons showed significant early-period RDM-evoked responses.
The results showed that, whereas early-period RDM-evoked responses were tightly aligned with the time of RDM onset, late-period RDM-evoked responses were aligned with the onset of the RDM stimulus as well as with the saccade onset. Because we used the reaction time version of the motion discrimination task, the time of saccade onset indicates the boundary of decision formation. If dopamine neurons only reflect the decision itself, late-period RDM-evoked responses should be tightly aligned with saccade onset. However, this was not the case. In addition, when dopamine responses were aligned with the time of saccade onset, dopamine neurons showed highly variable activities across all coherence levels. This cannot be explained if dopamine neurons encode the variable related to movement decision. This finding was also supported by the fact that the response pattern of dopamine neurons in the saccade-aligned-condition was different from the response pattern of LIP neurons showing build-up activity toward saccade initiation (Roitman and Shadlen, 2002). Thus, dopamine responses are not causally involved in saccade initiation as the LIP activity is. Instead, these results suggest that dopamine neurons dynamically track valuation processes during motion discrimination.
Dopamine early-period activity was inversely correlated with the elapsed time from the onset of the RDM stimuli. This is consistent with prediction errors for the occurrence of RDM stimuli. Such modulation was reported to be seen in response to the primary reward (Hollerman and Schultz, 1998; Fiorillo et al., 2008). Results of further analyses showed that the decreasing dopamine activity was due to reductions both in baseline activity and in RDM-evoked response. Reduction in baseline activity suggests that there may be continuous inhibitory input representing temporal predictability during the delay period. Because no additional external task event occurred during the delay period, this inhibitory input seems to reflect an internal timing mechanism. Although the origin of this input carrying temporal prediction is unknown, it is notable that neural activity relating to elapsed time has been reported in several brain areas (Ghose and Maunsell, 2002; Janssen and Shadlen, 2005).
Whereas there was no correlation between recording depth and neuronal sensitivity for temporal predictability, there were significantly positive correlations between recording depth and neuronal sensitivity for reward value. This indicates that dopamine neurons in the ventromedial SN showed higher neuronal sensitivity to reward value than those in the dorsolateral SN. These results suggest that distinct neural circuits are involved in the processing of those neuronal characteristics. The feature of the late-period responses is slow but detailed representation of reward value associated with perceptually complicated reward-predictive stimuli. This information can be carried by the neural circuits involving the ventromedial SN, which is preferentially connected with the ventral striatum, thought to be involved in value processing (Haber et al., 2000). In contrast, neural signals carrying fast, coarse and temporally predictive information regarding reward-related events may be transmitted diffusely over the whole SN.
A previous study suggested an additional role of nonphasic dopamine responses, namely, that sustained dopamine activity encodes reward uncertainty (Fiorillo et al., 2003). However, late-period RDM-evoked responses in this study were not likely to encode reward uncertainty for several reasons. First, there was no build-up in RDM-evoked responses at the zero coherence level, in which reward probability was 50%, and thus reward uncertainty was maximal. Second, the late-period RDM-evoked responses at the high coherence level showed differential activity between large- and small-reward conditions even though reward probability was almost 100%, and thus there should be the same amount of reward uncertainty in both large- and small-reward conditions. Based on the results, the late-period RDM-evoked responses cannot be explained by reward uncertainty alone. The absence of uncertainty-related responses in our study may be explained by the large difference in the task design, compared with that of the Fiorillo et al. study, pitching classical conditioning against instrumental conditioning.
Footnotes
This work was supported by the Human Frontier Science Program, (R18-04; W.S., T.W., M.S.), Grant-in-Aid for Center for Excellence Research (M.S.), Grant-in-Aid for Scientific Research on Priority Areas “System study on higher-order brain functions” from the Ministry of Education, Culture, Sports, Science, and Technology of Japan (17022037 and 19330161; M.S.), the Wellcome Trust (W.S.), and the National Institutes of Health (R01 EY015980 and RO1 EY019466, T.W.). We thank P. Bossaerts, Y. Niv, and K. Samejima for valuable comments, Y. Takikawa and R. Kawagoe for sharing recording techniques, and the Sakagami laboratory members for their help. K.N. thanks N. Kato and K. Kasai for their encouragement.
References
- Bayer HM, Glimcher PW. Midbrain dopamine neurons encode a quantitative reward prediction error signal. Neuron. 2005;47:129–141. doi: 10.1016/j.neuron.2005.05.020. [DOI] [PMC free article] [PubMed] [Google Scholar]
- Belova MA, Paton JJ, Salzman CD. Moment-to-moment tracking of state value in the amygdala. J Neurosci. 2008;28:10023–10030. doi: 10.1523/JNEUROSCI.1400-08.2008. [DOI] [PMC free article] [PubMed] [Google Scholar]
- Britten KH, Shadlen MN, Newsome WT, Movshon JA. The analysis of visual motion: a comparison of neuronal and psychophysical performance. J Neurosci. 1992;12:4745–4765. doi: 10.1523/JNEUROSCI.12-12-04745.1992. [DOI] [PMC free article] [PubMed] [Google Scholar]
- Celebrini S, Newsome WT. Neuronal and psychophysical sensitivity to motion signals in extrastriate area MST of the macaque monkey. J Neurosci. 1994;14:4109–4124. doi: 10.1523/JNEUROSCI.14-07-04109.1994. [DOI] [PMC free article] [PubMed] [Google Scholar]
- Ditterich J, Mazurek ME, Shadlen MN. Microstimulation of visual cortex affects the speed of perceptual decisions. Nat Neurosci. 2003;6:891–898. doi: 10.1038/nn1094. [DOI] [PubMed] [Google Scholar]
- Fiorillo CD, Tobler PN, Schultz W. Discrete coding of reward probability and uncertainty by dopamine neurons. Science. 2003;299:1898–1902. doi: 10.1126/science.1077349. [DOI] [PubMed] [Google Scholar]
- Fiorillo CD, Newsome WT, Schultz W. The temporal precision of reward prediction in dopamine neurons. Nat Neurosci. 2008;11:966–973. doi: 10.1038/nn.2159. [DOI] [PubMed] [Google Scholar]
- Ghose GM, Maunsell JH. Attentional modulation in visual cortex depends on task timing. Nature. 2002;419:616–620. doi: 10.1038/nature01057. [DOI] [PubMed] [Google Scholar]
- Haber SN, Fudge JL, McFarland NR. Striatonigrostriatal pathways in primates form an ascending spiral from the shell to the dorsolateral striatum. J Neurosci. 2000;20:2369–2382. doi: 10.1523/JNEUROSCI.20-06-02369.2000. [DOI] [PMC free article] [PubMed] [Google Scholar]
- Hanks TD, Ditterich J, Shadlen MN. Microstimulation of macaque area LIP affects decision-making in a motion discrimination task. Nat Neurosci. 2006;9:682–689. doi: 10.1038/nn1683. [DOI] [PMC free article] [PubMed] [Google Scholar]
- Hollerman JR, Schultz W. Dopamine neurons report an error in the temporal prediction of reward during learning. Nat Neurosci. 1998;1:304–309. doi: 10.1038/1124. [DOI] [PubMed] [Google Scholar]
- Horvitz JC, Stewart T, Jacobs BL. Burst activity of ventral tegmental dopamine neurons is elicited by sensory stimuli in the awake cat. Brain Res. 1997;759:251–258. doi: 10.1016/s0006-8993(97)00265-5. [DOI] [PubMed] [Google Scholar]
- Janssen P, Shadlen MN. A representation of the hazard rate of elapsed time in macaque area LIP. Nat Neurosci. 2005;8:234–241. doi: 10.1038/nn1386. [DOI] [PubMed] [Google Scholar]
- Kakade S, Dayan P. Dopamine: generalization and bonuses. Neural Netw. 2002;15:549–559. doi: 10.1016/s0893-6080(02)00048-5. [DOI] [PubMed] [Google Scholar]
- Kawagoe R, Takikawa Y, Hikosaka O. Expectation of reward modulates cognitive signals in the basal ganglia. Nat Neurosci. 1998;1:411–416. doi: 10.1038/1625. [DOI] [PubMed] [Google Scholar]
- Kawagoe R, Takikawa Y, Hikosaka O. Reward-predicting activity of dopamine and caudate neurons—a possible mechanism of motivational control of saccadic eye movement. J Neurophysiol. 2004;91:1013–1024. doi: 10.1152/jn.00721.2003. [DOI] [PubMed] [Google Scholar]
- Kobayashi S, Schultz W. Influence of reward delays on responses of dopamine neurons. J Neurosci. 2008;28:7837–7846. doi: 10.1523/JNEUROSCI.1600-08.2008. [DOI] [PMC free article] [PubMed] [Google Scholar]
- Kusama T, Mabuchi M. Stereotaxic atlas of the brain of Macaca fuscata. Tokyo: University of Tokyo; 1970. [Google Scholar]
- Matsumoto M, Hikosaka O. Lateral habenula as a source of negative reward signals in dopamine neurons. Nature. 2007;447:1111–1115. doi: 10.1038/nature05860. [DOI] [PubMed] [Google Scholar]
- Morris G, Arkadir D, Nevet A, Vaadia E, Bergman H. Coincident but distinct messages of midbrain dopamine and striatal tonically active neurons. Neuron. 2004;43:133–143. doi: 10.1016/j.neuron.2004.06.012. [DOI] [PubMed] [Google Scholar]
- Morris G, Nevet A, Arkadir D, Vaadia E, Bergman H. Midbrain dopamine neurons encode decisions for future action. Nat Neurosci. 2006;9:1057–1063. doi: 10.1038/nn1743. [DOI] [PubMed] [Google Scholar]
- Nakahara H, Itoh H, Kawagoe R, Takikawa Y, Hikosaka O. Dopamine neurons can represent context-dependent prediction error. Neuron. 2004;41:269–280. doi: 10.1016/s0896-6273(03)00869-9. [DOI] [PubMed] [Google Scholar]
- Newsome WT, Paré EB. A selective impairment of motion perception following lesions of the middle temporal visual area (MT) J Neurosci. 1988;8:2201–2211. doi: 10.1523/JNEUROSCI.08-06-02201.1988. [DOI] [PMC free article] [PubMed] [Google Scholar]
- Newsome WT, Britten KH, Movshon JA. Neuronal correlates of a perceptual decision. Nature. 1989;341:52–54. doi: 10.1038/341052a0. [DOI] [PubMed] [Google Scholar]
- Oikawa H, Sasaki M, Tamakawa Y, Ehara S, Tohyama K. The substantia nigra in Parkinson disease: proton density-weighted spin-echo and fast short inversion time inversion-recovery MR findings. AJNR Am J Neuroradiol. 2002;23:1747–1756. [PMC free article] [PubMed] [Google Scholar]
- Pan WX, Schmidt R, Wickens JR, Hyland BI. Dopamine cells respond to predicted events during classical conditioning: evidence for eligibility traces in the reward-learning network. J Neurosci. 2005;25:6235–6242. doi: 10.1523/JNEUROSCI.1478-05.2005. [DOI] [PMC free article] [PubMed] [Google Scholar]
- Press WH, Flannery BP, Teukolsky SA, Vetterling WT. Numerical recipes in C. Cambridge, UK: Cambridge UP; 1992. [Google Scholar]
- Ravel S, Richmond BJ. Dopamine neuronal responses in monkeys performing visually cued reward schedules. Eur J Neurosci. 2006;24:277–290. doi: 10.1111/j.1460-9568.2006.04905.x. [DOI] [PubMed] [Google Scholar]
- Roesch MR, Calu DJ, Schoenbaum G. Dopamine neurons encode the better option in rats deciding between differently delayed or sized rewards. Nat Neurosci. 2007;10:1615–1624. doi: 10.1038/nn2013. [DOI] [PMC free article] [PubMed] [Google Scholar]
- Roitman JD, Shadlen MN. Response of neurons in the lateral intraparietal area during a combined visual discrimination reaction time task. J Neurosci. 2002;22:9475–9489. doi: 10.1523/JNEUROSCI.22-21-09475.2002. [DOI] [PMC free article] [PubMed] [Google Scholar]
- Salzman CD, Britten KH, Newsome WT. Cortical microstimulation influences perceptual judgements of motion direction. Nature. 1990;346:174–177. doi: 10.1038/346174a0. [DOI] [PubMed] [Google Scholar]
- Satoh T, Nakai S, Sato T, Kimura M. Correlated coding of motivation and outcome of decision by dopamine neurons. J Neurosci. 2003;23:9913–9923. doi: 10.1523/JNEUROSCI.23-30-09913.2003. [DOI] [PMC free article] [PubMed] [Google Scholar]
- Schultz W. Predictive reward signal of dopamine neurons. J Neurophysiol. 1998;80:1–27. doi: 10.1152/jn.1998.80.1.1. [DOI] [PubMed] [Google Scholar]
- Schultz W, Romo R. Dopamine neurons of the monkey midbrain: contingencies of responses to stimuli eliciting immediate behavioral reactions. J Neurophysiol. 1990;63:607–624. doi: 10.1152/jn.1990.63.3.607. [DOI] [PubMed] [Google Scholar]
- Shadlen MN, Newsome WT. Neural basis of a perceptual decision in the parietal cortex (area LIP) of the rhesus monkey. J Neurophysiol. 2001;86:1916–1936. doi: 10.1152/jn.2001.86.4.1916. [DOI] [PubMed] [Google Scholar]
- Tobler PN, Dickinson A, Schultz W. Coding of predicted reward omission by dopamine neurons in a conditioned inhibition paradigm. J Neurosci. 2003;23:10402–10410. doi: 10.1523/JNEUROSCI.23-32-10402.2003. [DOI] [PMC free article] [PubMed] [Google Scholar]
- Tobler PN, Fiorillo CD, Schultz W. Adaptive coding of reward value by dopamine neurons. Science. 2005;307:1642–1645. doi: 10.1126/science.1105370. [DOI] [PubMed] [Google Scholar]
- Waelti P, Dickinson A, Schultz W. Dopamine responses comply with basic assumptions of formal learning theory. Nature. 2001;412:43–48. doi: 10.1038/35083500. [DOI] [PubMed] [Google Scholar]
- Wichmann FA, Hill NJ. The psychometric function: I. Fitting, sampling, and goodness of fit. Percept Psychophys. 2001a;63:1293–1313. doi: 10.3758/bf03194544. [DOI] [PubMed] [Google Scholar]
- Wichmann FA, Hill NJ. The psychometric function: II. Bootstrap-based confidence intervals and sampling. Percept Psychophys. 2001b;63:1314–1329. doi: 10.3758/bf03194545. [DOI] [PubMed] [Google Scholar]
- Wise RA. Dopamine, learning and motivation. Nat Rev Neurosci. 2004;5:483–494. doi: 10.1038/nrn1406. [DOI] [PubMed] [Google Scholar]