

Summary
Postnatal oligodendrocyte progenitor cells (OPC) self-renew, generate mature oligodendrocytes, and are a cellular origin of oligodendrogliomas. We show that the proteoglycan NG2 segregates asymmetrically during mitosis to generate OPC cells of distinct fate. NG2 is required for asymmetric segregation of EGFR to the NG2+ progeny, which consequently activates EGFR and undergoes EGF-dependent proliferation and self-renewal. In contrast, the NG2− progeny differentiates. In a mouse model, decreased NG2 asymmetry coincides with premalignant, abnormal self-renewal rather than differentiation and with tumor-initiating potential. Asymmetric division of human NG2+ cells is prevalent in non-neoplastic tissue but is decreased in oligodendrogliomas. Regulators of asymmetric cell division are misexpressed in low-grade oligodendrogliomas. Our results identify loss of asymmetric division associated with the neoplastic transformation of OPC.
Introduction
Studies in mouse models have shown that oligodendrocyte progenitor cells (OPC) carrying tumor-initiating mutations are a cellular origin of oligodendroglioma, a progressive primary malignancy of the adult central nervous system and major glioma class (Lindberg et al., 2009; Persson et al., 2010; Weiss et al., 2003). Glioma cells expressing the OPC marker NG2 have high tumor-initiating potential (Persson et al., 2010). Moreover, differentiation-defective NG2+ cells are the predominant cell type in human low-grade gliomas (Briancon-Marjollet et al., 2010) and in highly invasive rodent gliomas (Assanah et al., 2006). These observations indicate that NG2+ OPC are a cellular origin of oligodendrogliomas and that they persist in tumors and provide long-term growth (Pei and Wechsler-Reya, 2010). Whether premalignant NG2+ OPC carry defects in self-renewal and differentiation, similar to premalignant neural stem cells in a mouse model for astrocytoma (Alcantara Llaguno et al., 2009) and to the brain-tumor-initiating cells in human gliomas (Galli et al., 2004; Hemmati et al., 2003; Singh et al., 2003), is still unclear. Identifying these defects in OPC and unraveling their underlying causes is expected to fill a gap in our understanding of the mechanisms by which normal OPC turn into glioma cells.
Stem and progenitor cells across species undergo asymmetric divisions to simultaneously self-renew and generate differentiating cells (Knoblich, 2010). Polarity proteins provide a cue for cell fate determinants to localize asymmetrically and for the mitotic spindle to align along the polarity axis. This coordinated localization pattern ensures that cell fate determinants partition unequally during cytokinesis and that the two daughter cells acquire distinct fate. In the adult rodent brain, OPC expressing the chondroitin sulfate proteoglycan NG2 are the largest proliferative population. Lineage tracing by retroviral infection and bromodeoxyuridine (BrdU) labeling in vivo have shown that NG2+ OPC divide locally and throughout the adult rodent brain (Dawson et al., 2003; Kang et al., 2010). Moreover, using transgenic mice expressing tamoxifen-inducible NG2creER™ and fluorescent CRE reporter alleles to study the fate of single NG2 cells has revealed that age and their neuroanatomical location determines whether single NG2+ OPC can either self-renew, or generate mature oligodendrocyte, or do both (Zhu et al., 2011).
NG2 potentiates the activity of growth factor receptors such as platelet-derived growth factor receptor alpha (PDGFRα) and fibroblast growth factor receptor (FGFR) in part by enhancing ligand binding (Goretzki et al., 1999). Numbers of proliferative OPC are reduced temporarily in the cerebellum of adult NG2 knockout mice, indicating that NG2 promotes OPC proliferation (Kucharova and Stallcup, 2010). NG2+ cells co-express PDGFRα (Kang et al., 2010) and PDGF signaling plays an instrumental role in promoting OPC proliferation (Wolswijk and Noble, 1992). EGFR segregates asymmetrically and is involved in cell fate choices in embryonic glial progenitor cells (Sun et al., 2005) and in adult neural stem cells (Ferron et al., 2010). The role of epidermal growth factor receptor (EGFR) signaling in NG2+ OPC is less established. EGFR enhances adult oligodendrogenesis and myelination (Aguirre et al., 2007). Moreover, constitutive EGFR signaling in NG2+ OPC prevents their differentiation and leads to hyperplasia (Ivkovic et al., 2008).
Recent studies suggest that proper polarity and asymmetric cell division are lost as normal progenitors progress into precancerous and malignant cells. Asymmetry-defective Drosophila neuroblasts acquire tumor-like growth in vivo and genomic instability in vitro (Caussinus and Gonzalez, 2005). In mammary stem cells and cancer stem cells, the tumor suppressor p53 maintains asymmetric cell divisions (Cicalese et al., 2009). In hematopoietic precursors, oncogene expression disrupts cell polarity and increases symmetric, self-renewing divisions through deregulation of the cell fate determinant Numb (Ito et al., 2010; Wu et al., 2007). Here, we investigate whether NG2+ OPC divide asymmetrically via an interaction of NG2 with asymmetric EGFR segregation and whether losing asymmetric division associates with the neoplastic transformation of OPC.
Results
NG2+ Cells from White Matter Tissue Are Oligodendrocyte Progenitor Cells
First, we determined the optimal temporal and anatomical factors for our analyses of NG2+ OPC divisions. At P60, single NG2+ OPC have been shown to self-renew and generate differentiating oligodendrocytes (Zhu et al., 2011). OPC are enriched in white matter areas such as the corpus callosum (CC). We therefore co-immunostained mouse brains from P60 wild type mice for NG2, phospho-histone-3 (PH3), a mitotic marker, and DAPI to stain nuclei (Figure 1A; data not shown). As judged by overlapping signal for NG2 and PH3, we found that in the CC 8% of NG2+ OPC are in mitosis (Figure 1A; Figure S1B). In contrast, only 0.5% of NG2+ OPC are mitotic in the subventricular zone (SVZ), a large germinal area (Figures S1A and B). Thus, the CC at P60 is suitable to study dividing OPC.
Figure 1. NG2+ cells divide in corpus callosum and exhibit limited self-renewal and oligodendrocyte differentiation ex vivo.
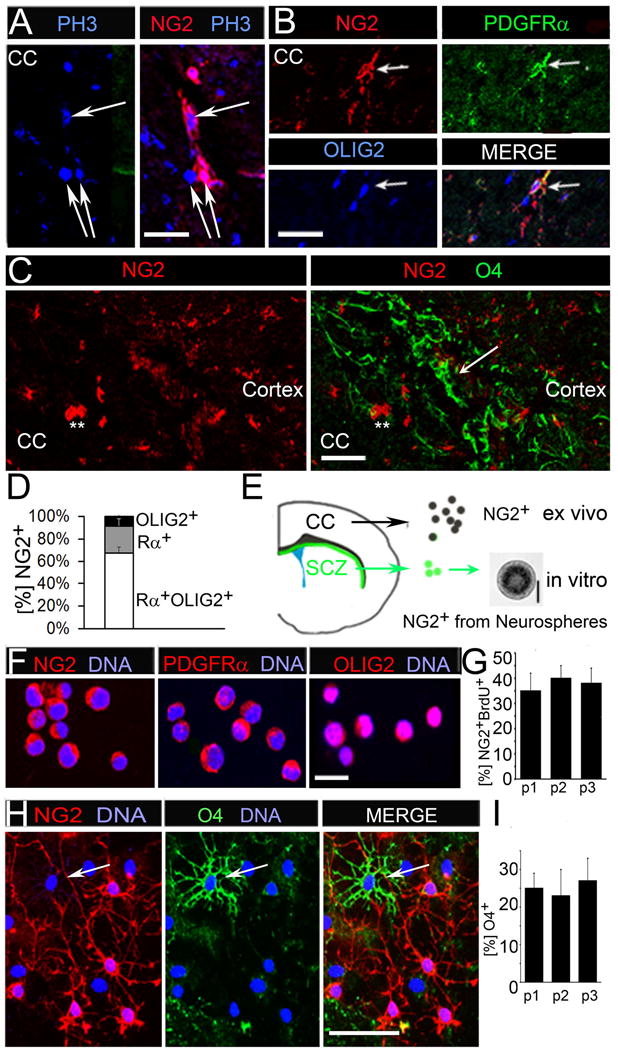
(A) Immunofluorescent co-staining for NG2 and mitosis marker phospho-histone3 (PH3) showing proliferating NG2+ cells in the corpus callosum (CC) of wild type P60 mice.
(B) NG2+ cells co-express OPC markers PDGFRα and OLIG2.
(C) Immunofluorescent co-staining for NG2 (asterisks) and O4 expression (white arrows).
(D) Quantification of OPC marker expression of NG2+ cells in the adult CC. NG2+ cells are PDGFRα/OLIG2/NG2 triple-positive (Rα/OLIG2/NG2; 65%); Rα/NG2 (23%), NG2/OLIG2 (8%) and NG2/O4 (4%) double-positive. 2% of NG2+ cells are OPC marker-negative.
(E) Schematic of a hemisphere of a coronal brain section. NG2+ cells were acutely isolated from CC tissue and also obtained from subcallosal zone (SCZ)-derived neurospheres.
(F) Immunofluorescent staining for NG2, PDGFRα and OLIG2 on acutely isolated NG2+ cells.
(G) BrdU was added to FACS sorted, acutely isolated NG2+ OPC cells after they have grown in culture for 48 hrs, and flow cytometry was used to determine the percentage of NG2 and BrdU double-positive (NG2+BrdU+) cells.
(H) NG2+ cells from p1-p3 were immunostained for NG2 and O4 after ten days in differentiation medium.
(I) Percentage of O4+ cells remained 23-26% for three passages. Scale bars in (A) and (F) 10μM, (B) 50 μM, (C), (E) and (H) 100μM. Error bars are +/− standard error of the mean (SEM). See also Figure S1.
NG2 is also expressed by brain pericytes (Ozerdem et al., 2001). To distinguish OPC from pericytes, co-immunostainings were performed for NG2 and OPC markers, PDGFRα and OLIG2. These stainings showed that 94% of NG2+ cells in the CC express PDGFRα, OLIG2 or both (Figures 1B and D) and are thus OPC. NG2+ OPC are known to differentiate further whereby they lose NG2 expression and gain expression of the immature oligodendrocyte antigen, O4. To determine the overlap of NG2+ and O4+ stages of OPC at P60, we co-stained mouse brains and found that only 4% of NG2+ OPC in the CC co-express O4 (Figures 1C and D). Our observations suggest that the CC NG2+ and O4+ OPC represent distinct stages consistent with an earlier study showing that the O4+ and O4− OPC respond to different mitogenic signals (Gard and Pfeiffer, 1990).
We tested next whether NG2+ cells preserve OPC marker expression, self-renewal and differentiation along the oligodendrocyte lineage in vitro. FACS was used to isolate NG2+ OPC from freshly dissociated CC tissue. In addition, we isolated neural stem cells from the subcallosal zone, a germinal zone adjacent to the CC, expanded them in neurosphere cultures (Seri et al., 2006) and used them as replenishable source for NG2+ OPC (Figure 1E). Staining with OPC markers PDGFRα and OLIG2 revealed that 95% of acutely isolated and neurosphere-derived NG2+ cells express OPC markers (Figure 1F; Figures S1C-E).
Next, we tested whether purified NG2+ OPC, similar to purified rat OPC, exhibit limited self-renewal (Temple and Raff, 1986). Acutely isolated NG2+ OPC were kept under proliferative conditions for 48 hrs then incubated with BrdU for 2 hrs. Using flow cytometry we determined that 35% of the cells were NG2+BrdU+ and are thus proliferative OPC. If the NG2+ cells self-renew, the percentage of NG2+BrdU+ cells should remain stable during subsequent proliferation cycles. To test this, we repeated BrdU labeling and flow cytometry and found that the percentage of NG2+BrdU+ cells remained stable at 35-40% for up to three consecutive divisions. This indicates that the NG2+ OPC self-renew for at least three divisions (Figure 1G), consistent with a recent in vivo report (Simon et al., 2011). The total number of NG2+ cells obtained from neurospheres and ex vivo is similar and it remains unchanged for a minimum of six passages, further pointing towards a stable rate of self-renewal (Figure S1F). To test whether NG2+ OPC also generate differentiating oligodendrocytes in vitro, we took a fraction of NG2+ cells from each passage and subjected them to oligodendrocyte differentiation medium. A quantification of NG2+ and O4+ cells after 10 days revealed that 25% of NG2+ OPC had differentiated into O4+ cells and little overlap of NG2 and O4 expression was detected (Figure 1H). The number of O4+ cells was stable for a minimum of three passages (Figure 1I). These data led us to conclude that NG2+ OPC retain their dual capacity to self-renew and to generate differentiating progeny following isolation.
NG2 Exhibits Polarized Localization and Segregates Asymmetrically
Next we tested whether NG2+ OPC undergo asymmetric divisions. We adapted a pair assay (Shen et al., 2002) to visualize and quantify asymmetric protein distribution in NG2+ OPC (Figure 2A). In brief, dissociated cells were plated at clonal densities. After 12-18 hrs, the cells that have entered mitosis began to form cell pairs. By performing immunofluorescence for OPC markers and DNA, we identified cell pairs and determined whether OPC markers unequally distributed between daughter cells, which indicates asymmetric cell divisions. Surprisingly, NG2 localized to a polarized crescent and segregated asymmetrically (Figure 2A, B). In contrast, we did not detect any asymmetrical pattern of PDGFRα and OLIG2 (Figures S2A and B). In both acutely isolated and neurosphere-derived NG2+ cells, NG2 segregated asymmetrically in 40-46% of cell pairs (Figures 2B, C and E; Figure S2C) and distributed symmetrically and more diffusely in the remaining. Asymmetric segregation of cell fate determinants in neural progenitors depends on an intact actin cytoskeleton (Erben et al., 2008; Sun et al., 2005). To investigate whether similar cytoskeletal constraints are operative in NG2+ cells, we incubated acutely isolated NG2+ cells with latrunculin A, an inhibitor of actin polymerization. We found that latrunculin A inhibited asymmetric segregation of NG2 (aka NG2 asymmetry) (Figures 2D and E), which shows that NG2 segregates asymmetrically in an actin-dependent manner.
Figure 2. NG2 shows polarized localization and segregates asymmetrically in OPC.

(A) Schematic of pair assay. Single cells plated under proliferative conditions enter mitosis and form cell pairs, which are fixed and immunostained. Cell pairs in which proteins partition to one daughter cell are considered asymmetrical.
(B) A representative, neurosphere-derived mitotic cell pair with NG2 asymmetry.
(C) A representative acutely isolated cell pair with NG2 asymmetry.
(D) Cell pair treated with latrunculin A shows cytoplasmic (white arrow) rather then polarized NG2 localization.
(E) Percentage of cell pairs with NG2 asymmetry after latrunculin A and DMSO (control) treatment. **p=0.0087 by Student's t test.
(F) Immunofluorescent co-staining for NG2 and gamma (γ)–Tubulin (γ Tub) to label centrosomes. 1 asterisk = 1 centrosome. White arrow points to patchy NG2 staining in G1/S phase.
(G) Immunofluorescence co-staining for NG2 and alpha (α)-Tubulin (α Tub) to label the mitotic spindle.
(H) Representative cell pair in vivo with NG2 asymmetry after immunofluorescent co-staining for NG2, BrdU and PH3. P60 mice were injected with BrdU prior to sacrifice. White arrows point to NG2+ cell in pair.
(I) Percentage of cell pairs with NG2 asymmetry from acutely isolated cells (ex vivo) and CC tissue (in vivo).
Scale bars in (C), (D), (F), (G) and (H) 10 μm. Error bars are +/− standard error of the mean (SEM). (D; F; G) were performed with neurosphere-derived cells. See also Figure S2.
To define at which stage in the cell cycle NG2 acquires polarized localization, we co-stained cell pairs for NG2 and γ-Tubulin, a centrosomal marker (Figure 2F). We found patchy NG2 localization uniformly around the cortex in G1/S cells. In G2 cells, centrosomes have duplicated and NG2 was restricted to one half of the cell cortex. In M phase cells, the centrosomes have moved to opposite poles and NG2 localized to a cortical crescent on one pole. Co-staining of NG2 and α-Tubulin, a marker for mitotic microtubules was performed to observe NG2 localization during mitosis (Figure 2G). As expected, NG2 localized to a crescent in prophase, as the mitotic spindle assembles. NG2 crescents were overlying one spindle pole in metaphase. In telophase, NG2 segregated exclusively to one daughter cell. Asymmetric localization of NG2 in mitosis was further confirmed in NG2+ PH3+ cells (Figure S2D). NG2 crescents were not detected laterally to the metaphase spindle or on opposite poles. This suggested that after the NG2 crescents formed, they remained stable and segregated asymmetrically.
To determine whether NG2 asymmetry occurred in vivo, we injected wild type P60 mice with BrdU and analyzed brain sections of injected mice by immunofluorescence for BrdU, NG2 and PH3. We frequently found two BrdU+ cells in close vicinity to each other in the CC and cortex, suggesting that these might be pairs. Co-staining with PH3 allowed us to distinguish between two BrdU+ cells that incidentally localized next to each other from newly generated cell pairs, i.e., those that underwent mitosis. NG2 distributed asymmetrically in 52% of BrdU+PH3+ cell pairs (Figures 2H and I; Figure S2E). These data show that NG2 segregates asymmetrically in proliferating OPC in vivo and ex vivo.
OPC Divide Asymmetrically to Generate Cells of Distinct Fate
Asymmetric cell divisions generate progeny of distinct fate. We therefore tested whether NG2 asymmetry associated with distinct proliferative and differentiation capacities in the OPC progeny. Acutely isolated NG2+ cells from wild type mice were kept under proliferative conditions to divide into NG2+ and NG2− progeny for 48 hrs. Subsequently, we added BrdU for 6 hrs and quantified BrdU+ cells in relation to NG2 expression by flow cytometry and in pair assays (Figure 3A). We found that 78% of NG2+ progeny but only 19% of the NG2− progeny had re-entered proliferation as determined by BrdU incorporation (Figures 3B and C). Consistent with these data, in pairs with NG2 asymmetry, 85% of the NG2+ and only 8% of the NG2−progeny incorporated BrdU (Figures 3D and E). In the remaining 7% of cell pairs with NG2 asymmetry BrdU was weak or absent. When both daughter cells were NG2+, i.e. symmetrically dividing, they incorporated BrdU equally (data not shown). We concluded that the NG2+ progeny proliferates at higher rates than the NG2− progeny of asymmetrically dividing OPC. To determine the fate of the NG2− progeny, we sorted NG2+ cells from freshly isolated CC tissue and separated the NG2+ and NG2− progeny again by FACS and subjected them to differentiation conditions (Figure 3F; Figure S3A). Flow cytometry revealed 7% of NG2− progeny expressed O4+ within 24 hrs of differentiation. In contrast, only 1% of NG2+ progeny generated O4+ cells (Figures 3G and H). Moreover, in pairs with NG2 asymmetry, 82% of the NG2− progeny and only 10% of the NG2+ progeny acquired O4 expression after 48 hrs in differentiation medium (Figures 3I and J). In the remaining 8% of cell pairs with NG2 asymmetry and in all cell pairs with symmetric NG2 distribution, O4 staining was weak or absent (not shown). Moreover, under prolonged differentiation conditions 32% of NG2− progeny remained O4+. In contrast, only 16% of NG2+ progeny eventually acquired O4 expression (Figures S3B and C). We concluded that NG2 asymmetry generates OPC progeny with distinct proliferative and differentiation capacities (Figure S3D). NG2 tracks proliferation and biases cells towards self-renewal. In contrast, NG2−progeny of asymmetrically dividing OPC acquire differentiating fate.
Figure 3. OPC undergo asymmetric cell division with NG2 tracking proliferative fate.

(A) Schematic of experimental approach to determine differences in proliferative cell fate. Acutely isolated NG2+ OPC divide into NG2+ and NG2− cells in proliferative medium for 48 hr (division 1). Cells were then treated with BrdU to label those re-entering division within the next 12 hr (division 2). BrdU+ cells in the NG2+ and NG2− progeny were quantified by flow cytometry (B, C) and in pair assays (D, E).
(B) A representative flow cytometry plot showing overlap between NG2 expression and BrdU incorporation. Grey line indicates border set between BrdU− and BrdU+ cells.
(C) Percentage of BrdU+ cells in the NG2+ and NG2− progeny.
(D) A representative cell pair with NG2 asymmetry immunostained for NG2 and BrdU.
(E) Percentage of BrdU staining in cell pairs with NG2 asymmetry.
(F) Schematic of experimental approach to determine differentiating fate. Freshly isolated OPC kept under proliferative conditions for 48 hr (division 1) were re-sorted into NG2+ and NG2−cells, switched to differentiation medium (differentiation) and percentage of O4 expression was assessed by flow cytometry 24 hr after sorting (G, H) and pair assays 48 hrs after plating (I, J).
(G) A representative flow cytometry plot for O4 expression in the NG2− (Left Plot) and NG2+ (Right Plot) population.
(H) Percentage of O4+ cells as determined by flow cytometry.
(I) A representative cell pair with NG2 asymmetry and co-immunostained for O4 and NG2.
(J) Percentage of O4 expression in cell pairs with NG2 asymmetry. Error bars are +/− standard error of the mean (SEM). Scale bars in (D) and (I) 10 μm. See also Figure S3.
NG2 Promotes Asymmetric EGFR Localization and EGF-Dependent Responses
To get mechanistic insights into asymmetric OPC divisions, we tested whether EGFR, which regulates OPC proliferation, segregates asymmetrically in OPC. Indeed, EGFR localized to a polarized crescent and segregated asymmetrically in mitotic cell pairs (Figure 4A). In acutely isolated and neurosphere-derived cells, NG2 and EGFR co-localized and co-segregated in 82% of cell pairs with NG2 asymmetry (Figure 4B; Figure S4A). EGFR autophosphorylation is associated with its ligand-induced activation (Bae and Schlessinger, 2010). To determine, whether asymmetrically segregated EGFR is active, we co-stained cell pairs for NG2 and phospho-EGFR (p-EGFR), using an antibody directed against the phosphorylated auto-phosphorylation site tyrosine 1068. We found that the majority of the NG2+ progeny (>60%) but rarely the NG2− progeny stains for p-EGFR (Figures 4C). Taken together, these data show that EGFR localizes asymmetrically to and is activated in the self-renewing NG2+ OPC but not the differentiating NG2− progeny.
Figure 4. NG2 regulates EGFR asymmetry and EGF-dependent proliferation and self-renewal.

(A) Immunofluorescent co-staining for EGFR and a-Tubulin of neurosphere-derived cells at distinct stages of mitosis.
(B) A representative NG2+ OPC cell pair co-immunostained for NG2 and EGFR (white arrows).
(C) A representative NG2+ OPC cell pair co-immunostained for NG2 and p-EGFR (white arrow). EGF is present in medium.
(D) A representative NG2KO OPC cell pair co-immunostained for PDGFRα+ (Rα) and EGFR showing symmetric EGFR.
(E) Percentage of cell pairs with asymmetric (asym) and symmetric (sym) EGFR.
(F) A representative NG2KO OPC cell pair co-immunostained for PDGFRα+ (Rα) and p-EGFR showing symmetric, faint p-EGFR signal.
(G) Percentage of cell pairs with asymmetric p-EGFR staining.
(H) EGF-starved neurosphere cells were treated with EGF for 48 hrs and cell numbers were determined.
(I) Percentage of PDGFRα and BrdU double positive (Rα+BrdU+) cells with (w/EGF) and without (w/o EGF) EGF.
(J) Percentage of PDGFRα and PH3 double-positive (RαPH3+) cells. OPC were acutely isolated from the CC of P60 NG2WT and NG2KO mice using PDGFRα as selection marker with the exception of (A, H). There, OPC were isolated from low passage subcallosal zone-derived NG2WT and NG2KO neurospheres. Error bars are +/− standard error of the mean (SEM). **Students t-test p<0.01. *Student's t-test p<0.05. Scale bars in (C-D) and (F) 10 μM. See also Figure S4.
To distinguish between an active and passive role of NG2 in asymmetric OPC divisions, we analyzed NG2 knockout (NG2KO) OPC for EGFR asymmetry and EGF-dependent responses (Grako et al., 1999). We used PDGFRα as surface marker for acute isolation of OPC from the CC of adult, viable NG2KO mice and NG2 wild type (NG2WT) littermates. We found that EGFR distributed asymmetrically in only 16% of cell pairs from NG2KO OPC compared to 82% in NG2WT OPC (Figures 4D and E; Figure S4B). Moreover, p-EGFR localized asymmetrically with reduced overall intensity of staining in only 6% of NG2KO OPC (Figures 4F and G). In addition, inhibitory NG2 antibodies blocked EGFR asymmetry and increased symmetrical EGFR distribution in otherwise wild type OPC (Figures S4C and D). Some activated neural stem cells and transit-amplifying cells isolated as CD15+ cells from NG2KO neurospheres (Capela and Temple, 2002) exhibited no change in p-EGFR staining (Figure S4E). This suggests that the effect of NG2 loss on EGFR signaling is specific for NG2+ OPC. To investigate the mechanism by which NG2 might regulate EGFR signaling, we tested EGF ligand binding to NG2KO and NG2WT cells. We found that fluorescent EGF ligand (EGF-488) bound preferentially to the NG2+ progeny of cell pairs with NG2 asymmetry (Figure S4F). EGF still bound albeit symmetrically to cell pairs of NG2KO OPC indicating that NG2 is not essential for EGF binding (Figures S4G and H). These data show that NG2 is required for asymmetric distribution of EGFR to the NG2+ progeny. Consequently, EGFR is activated in the NG2+ but not the NG2− progeny.
We tested next whether NG2 is required for EGF-dependent OPC responses. NG2KO and NG2WT subcallosal neurospheres, respectively, were EGF-depleted and subsequently treated with EGF for 48 hrs. FACS sorted PDGFRα+ OPC were quantified for their proliferative response with a proliferation assay. Following EGF treatment, we detected a 30% cell number increase in NG2WT cultures and only a 5% increase in NG2KO cultures (Figure 4H). Moreover, pre-treatment of neurospheres with inhibitory NG2 antibodies but not with IgG control decreased the proliferation rate of OPC (Figure S4I).
To assess EGF-dependent self-renewal, PDGFRα+ OPC were acutely isolated from NG2KO and NG2WT mice and grown without EGF. Subsequently, half of the cells were stimulated with EGF. BrdU was added and PDGFRα+BrdU+ cells were quantified over three passages by flow cytometry, as before (Figure 1G). NG2WT PDGFRα+BrdU+ cells increased from 18% without EGF to 38% in response to EGF treatment. In contrast, we detected only 16% of NG2KO PDGFRα+BrdU+ cells with EGF and 14% in the absence of EGF (Figure 4I). The lack of EGF -induced proliferation is specific for NG2KO OPC, as self-renewal of CD15+ cells in NG2KO neurospheres was unaffected (Figure S4J). Moreover, BrdU+NG2+ cells were reduced following treatment with inhibitory NG2 antibodies (Figure S4K). These data show that NG2 is required for EGF-dependent proliferation and self-renewal of OPC.
To test whether loss of NG2 would also result in decreased OPC proliferation in vivo, we counted the PDGFRα+PH3+ cells in the CC. In line with an earlier analysis (Kucharova and Stallcup, 2010), we found a small but significant reduction of proliferating OPC in the CC of NG2KO mice at P60 compared to NG2WT littermates (Figure 4J). These data showed that NG2 is required for asymmetric segregation of EGFR and EGF-dependent OPC proliferation and self-renewal.
Decreased Asymmetric Divisions Correlate with Increased Self-renewal at the Expense of Differentiation
The mechanism for neoplastic transformation of NG2+ OPC is ill defined. NG2+ OPC give rise to endogenous, oligodendroglioma-like tumors in transgenic S100β-verbB mice, which constitutively activate EGFR signaling at early postnatal stages (Persson et al., 2010; Weiss et al., 2003). S100β-verbB mice with hemizygous deletion of the tumor suppressor p53 succumb to tumors after a 4-6 months latency period. Homozygous loss of p53 shortened the latency period (Figure S5A). To investigate early changes, we isolated NG2+ cells acutely from the CC of S100β-verbB p53+/− (aka verbB p53+/− OPC) during the latency period at P60 and from control, p53+/− littermates. In pair assays, NG2 and EGFR segregated asymmetrically in only 22% of verbB p53+/− OPC compared to 41% of control OPC (Figures 5A-C). In the remaining 78% of verbB p53+/− OPC NG2 distributed symmetrically. In addition, asymmetric cell division rates decreased in verbB p53+/− NG2+ cell pairs from subcallosal neurospheres and from verbB p53+/−mice in vivo (Figures S5B-D; Figures 5D and E). Noteworthy, homozygous loss of p53 decreased asymmetric cell division rates of NG2+ cells from subcallosal neurospheres (p53−/−: 32%; p53+/+: 46%; p=0.079) (Figure S5D).
Figure 5. Asymmetric OPC divisions are decreased in a mouse glioma model.
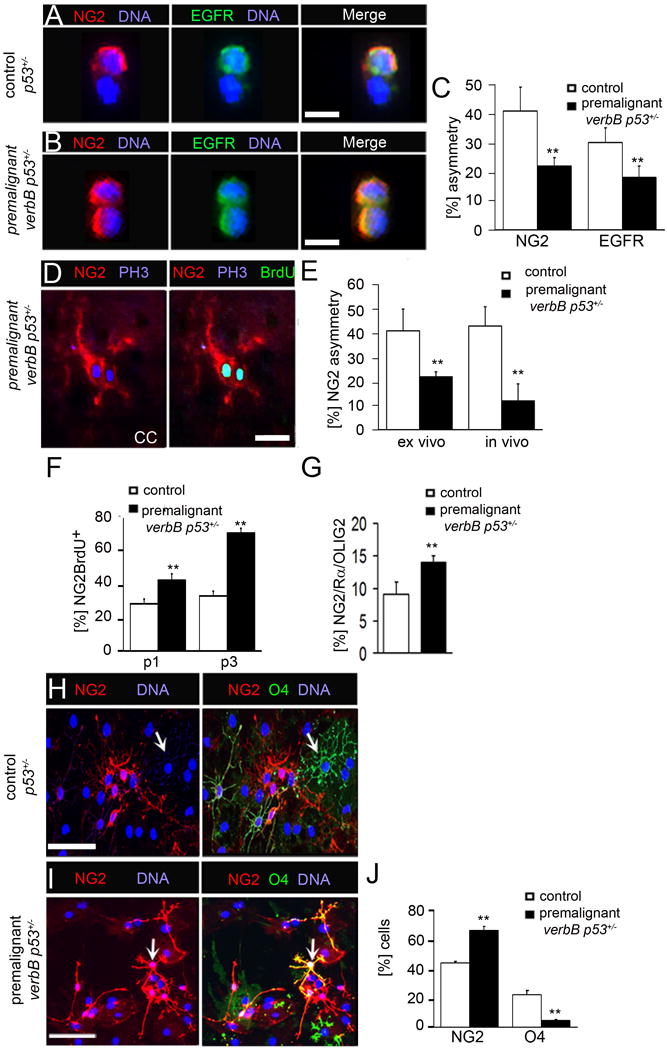
(A) A p53+/− OPC cell pair is stained for NG2 and EGFR.
(B) A verbB p53+/− OPC cell pair is stained for NG2 and EGFR.
(C) Percentage of NG2 and EGFR asymmetry in control and verbB p53+/− OPC following their acute isolation from CC tissue.
(D) An OPC cell pair in the CC of verbB p53+/− mice is stained for NG2, PH3 and BrdU.
(E) Percentages of NG2 asymmetry are 23% in acutely isolated (ex vivo) verbB p53+/− cells and 13% in verbB p53+/− tissue (in vivo), compared to 41% in acutely isolated control, p53+/− OPC and 42% in control, p53+/− CC tissue.
(F) Percentage of NG2+BrdU+ cells in verbB p53+/− OPC and control cells as determined by flow cytometry. 47% and 76% of verbB p53+/− cells at passage 1 (p1) and passage 3 (p3), respectively, are NG2+BrdU+.
(G) OPC numbers, as determined by quantifying triple-positive (NG2/Rα/OLIG2) cells, in the verbB p53+/− and the control CC tissues.
(H) Control and (I) verbB p53+/− OPC plated for differentiation and stained for NG2 and O4. (J) Percentage of NG2+ cells differentiated into O4+ cells 10 d after differentiation. O4 staining non-overlapping with NG2 in control cells (white arrow in H). In contrast, verbB p53+/− O4+ cells with overlapping NG2 staining (yellow staining; white arrow in I). O4 and NG2 double-positive cells were counted as O4+ cells.
Pair assays (A, B), self-renewal (F) and differentiation (H, I) experiments were done with acutely isolated NG2+ cells. Controls are p53+/−. Error bars are +/− standard error of the mean (SEM). **Student's t-test p<0.01. Scale bar in (A) and (B) 10 μM, in (D) is 50 μM and in (F) is 100 μM. See also Figure S5.
We tested next whether lower rates of asymmetric cell division and concurrent increases in symmetric cell division coincide specifically with aberrant self-renewal and impaired differentiation of OPC. We found that self-renewal was increased in acutely isolated verbB p53+/− NG2+ OPC compared to control OPC (Figure 5F). In contrast, the self-renewal of CD15+ adult neural stem cells and transit amplifying cells was unchanged in verbB p53+/− neurospheres (Figure S5E). Overall numbers of OPC were also increased in verbB p53+/− CC tissue to 14% compared to 9% in control tissue (Figure 5G; Figures S5F and G). Under differentiation conditions, verbB p53+/− NG2+ OPC retained NG2 and OLIG2 expression at higher rates and generated only 3% O4+ cells compared to 25% generated by control OPC (Figures 5H-J; Figures S5H-M). Taken together, these data showed that at premalignant stages OPC exhibit reduced rates of asymmetric divisions accompanied by increased symmetric divisions, aberrant self-renewal and impaired oligodendrocyte differentiation.
Asymmetry-defective OPC Have Tumor-Initiating Potential
To investigate the possibility that latent verbB p53+/− OPC are glioma precursors, we evaluated their tumor-initiating potential. NG2+ cells were isolated by FACS from early-passage subcallosal neurospheres of verbB p53+/− latent and p53+/− control P60 mice and from endogenous tumors, which have been reported to develop spontaneously in S100B-verbB p53−/−mice (Weiss et al., 2003). Cells were injected orthotopically into adult mice, which were monitored for symptoms. Within 5-6 months, mice injected with verbB p53+/− NG2+ cells isolated from the latent stage consistently developed symptoms indicative of tumor growth whereas mice injected with p53+/− cells remained asymptomatic. NG2+ tumor-derived cells developed tumors within 2-3 months (Figure 6A). Hematoxylin & eosin staining of fixed brain sections from symptomatic mice revealed massive tumors in the pre-frontal cortex, which infiltrated the brain parenchyma, exhibited high cellularity, and had a “fried egg” cellular appearance typical of oligodendroglial tumors (Figures 6B and C). Immunofluorescence staining revealed that the majority of cells within the tumor mass expressed the OPC markers NG2 and OLIG2 and only a small number expressed astrocytic and neuronal markers, GFAP and Nestin, respectively (Figures 6D and E). Immunohistopathological analyses further confirmed that orthotopic tumors share characteristics of grade II-III oligodendrogliomas with endogenous tumors in S1006-verbB p53−/− mice (Figures S6A-H).
Figure 6. Asymmetry-defective OPC initiate orthotopic tumors.
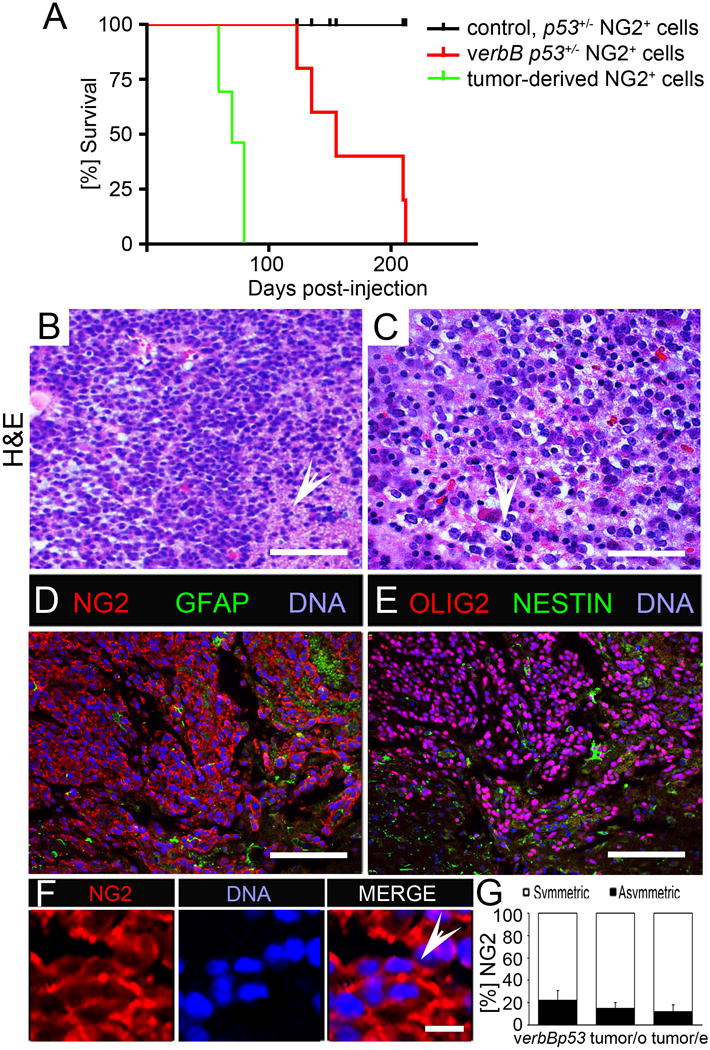
(A) Kaplan-Meier survival curves of mice injected with 100,000 p53+/−, verb p53+/− and tumor-derived NG2+ cells.
(B, C) Hematoxylin & Eosin (H&E) staining of orthotopic tumors from verb p53+/− NG2+ cells. The white arrow in panel B indicates infiltrative tumor cells and the white arrow in panel C indicates a cell with the “fried egg” appearance, a feature typical for oligodendroglial tumors.
(D, E) Immunofluorescent staining of orthotopic tumors for NG2 and GFAP (D) and for OLIG2 and Nestin (E).
(F) NG2 staining of orthotopic tumor at higher magnification. The white arrow points to a mitotic cell pair identified by nuclear staining with symmetric NG2.
(G) Percentage of cell pairs with symmetric (white area) and asymmetric (black area) NG2. NG2 asymmetry is 23% in acutely isolated verbB p53+/− cells and is 18% in cells isolated from orthotopic (tumor/o) and 10% in cells isolated from endogenous tumors (tumor/e).
Error bars are +/− standard error of the mean (SEM). Scale bars in (B), (D), (E) are 100 μM, in (C) 200 μM and in (F) 10 μM. Student's t-test, *p<0.05. See also Figure S6.
Immunofluorescence of tumor tissue detected predominantly symmetric NG2 in mitotic cells (Figure 6F). Pair assays of NG2+ cells derived from either orthotopic or endogenous tumors showed that in tumor-derived cells NG2 asymmetry is reduced further compared to that in verbB p53+/− cells from the latent state (Figure 6G). NG2+ cells from orthotopic tumors can be serially re-transplanted, indicative of self-renewal. Under differentiating conditions in vitro, NG2+ tumor-derived cells failed to differentiate into mature oligodendrocytes (Figure S6I). We concluded that verbB p53+/− NG2+ OPC isolated at latent stages are glioma precursors.
In Human Oligodendrogliomas, NG2+ Cells Lose Asymmetric Divisions and Asymmetry Regulators Are Misexpressed
How NG2+ OPC relate to NG2+ tumor-initiating cells from human oligodendrogliomas is not well understood. To test whether NG2+ cells from human oligodendrogliomas - similar to NG2+ glioma precursors - show abnormal asymmetric cell division rates, we isolated NG2+ cells by magnetic activated cell sorting from surgical specimens from grade II and grade III oligodendrogliomas. NG2+ cells isolated from epilepsy temporal lobes were used as non-neoplastic controls (Figure 7A). In pair assays, the rates of asymmetric NG2 and EGFR segregation in tumor-derived NG2+ cells were reduced to 8-48% (Figures 7B, C). In contrast NG2 and EGFR segregated asymmetrically in 75-78% of non-neoplastic human NG2+ cells (Figure 7B and D). We tested next whether loss of NG2 and EGFR asymmetry associates with particular genetic alterations frequently found in oligodendrogliomas. We confirmed that all oligodendrogliomas have combined allelic loss of chromosomal arms 1p and 19q (1p19q co-deleted) (Jenkins et al., 2006). EGFR amplifications portend progression to high-grade disease and recurrence in oligodendrogliomas (Ducray et al., 2008). Indeed, aneuploidy and high EGFR score were documented in the recurrent grade II and the grade III tumors. NG2 asymmetry was not consistently decreased further in tumors with increased tumor grade, recurrence, or high EGFR scores (Figure 7B).
Figure 7. Human oligodendrogliomas have NG2+ cells with reduced asymmetric cell division and misexpress genes encoding conserved asymmetry regulators.
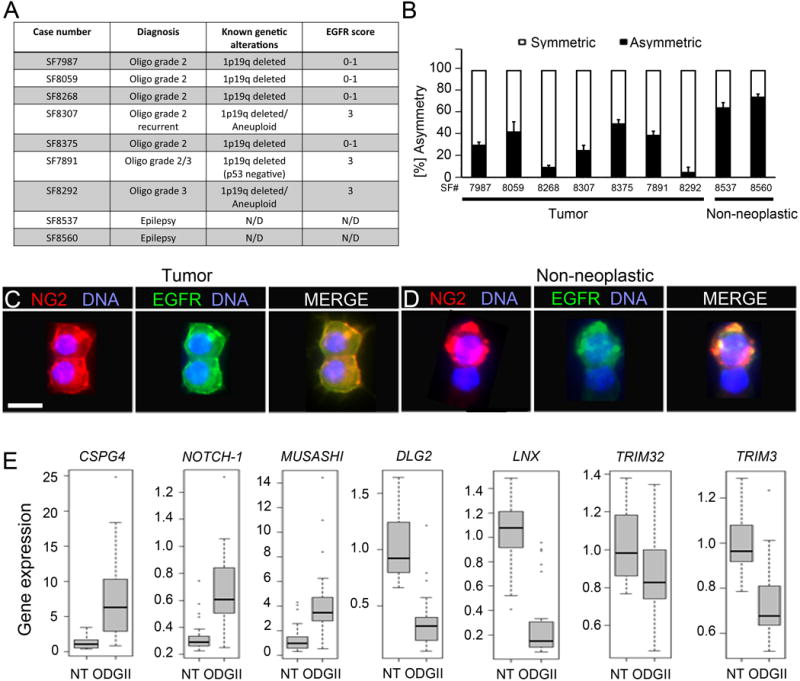
(A) Summary of human oligodendrogliomas used in the study.
(B) NG2+ cells were acutely isolated from surgically removed tumor and non-neoplastic brain tissue specimens and percentage of cell pairs with NG2 asymmetry is determined using pair assay. Error bars are +/− standard error of the mean (SEM).
(C, D) Representative NG2+ cell pairs from tumor (C) and non-neoplastic tissue (D) stained for NG2 and EGFR. Scale bars are 10 μM.
(E) Box plots representing changes in gene expression levels at a p-value < 0.05 of 7 conserved, candidate asymmetry regulator genes in control brain tissue (NT) versus low-grade oligodendroglioma tissue (ODGII). The band in each box represents the median and the bottom and top the 25 and 75 percentile, respectively. The errors bars are the minimum and maximum of data. See also Table S1 and Figure S7.
Moreover, database analyses found asymmetric cell division regulators to be misexpressed in low-grade oligodendrogliomas (Figure 7E). Changes were investigated in the expression level of 29 genes encoding candidate asymmetry regulators in expression profiles of 27 human grade II oligodendroglioma samples and 28 reference samples from the Repository for Molecular Brain Neoplasia Data (Table S1) (Madhavan et al., 2009). Significant differential expression between the two groups at a p-value < 0.05 was identified for 15 genes, nine of which were upregulated and six were downregulated in tumors (Table S1 and Figure S7). Taken together, decreased rates of asymmetric cell divisions occur in low- and high-grade oligodendroglioma NG2+ cells and correlate with 1p19q co-deletion and misexpression of regulators of asymmetric cell division.
Discussion
Polarized Distribution and Asymmetrical Segregation of NG2 in Postnatal OPC
By showing that NG2 segregates asymmetrically and is part of a cell fate switch in OPC, we provided evidence that OPC undergo asymmetric cell divisions to establish tissue homeostasis in the adult brain. Because culturing conditions alter the expression of OPC markers (Dromard et al., 2007; Gabay et al., 2003), we have used acutely isolated cells whenever possible. In addition, we showed that NG2+ OPC undergo symmetric divisions in the CC. In areas adjacent to the SVZ, NG2+ cell pairs with exclusively symmetric NG2 distribution have been found (Ge et al., 2009). Differences in the length of BrdU treatment and temporal factors may explain why the recent study reported only symmetrically dividing NG2+ OPC. NG2 cells have an extended G1 cycle (Simon et al., 2011) and the NG2+ cell cycle slows down with age in the rodent brain (Psachoulia et al., 2009), suggesting that short BrdU treatment might miss some NG2+ cells. Moreover, cell fate analyses of NG2+ cells suggest that asymmetric cell divisions occur only at later postnatal stages in mice (Zhu et al., 2011). Why both asymmetric and symmetric division modes exist at P60 is unknown. The NG2+ OPC cells expand rapidly after stab wounding (Simon et al., 2011) and they generate new oligodendrocytes after toxin-induced demyelination (Zawadzka et al., 2010). It is attractive to speculate that while asymmetric cell divisions maintain tissue homeostasis in the healthy, adult brain, symmetrically dividing OPC rapidly expand in the injured brain.
Regulation of NG2 Asymmetry
The majority of Drosophila asymmetry regulators are conserved in mammals (Knoblich, 2010). In Drosophila these proteins work together in conjunction with an intact actin cytoskeleton to distribute cell fate determinants unequally between daughter cells (Petritsch et al., 2003). The present study shows that an intact actin cytoskeleton is also required for asymmetric segregation of NG2, which indirectly suggests that the mechanism for asymmetric NG2 localization might be conserved in mammalian OPC. Reversible phosphorylation by several kinases plays an important role in establishing cell polarity and asymmetric cell division in Drosophila neuroblasts. NG2 is a transmembrane protein with a large extracellular and a small cytoplasmic domain (Trotter et al., 2010). Noteworthy, two distinct phosphorylation events within the small cytoplasmic domain of NG2 regulate dynamic redistribution and differential function of NG2 in human astrocytoma cells (Makagiansar et al., 2007). It will be interesting to determine whether differential phosphorylation of NG2 regulates its asymmetric pattern in OPC.
OPC Asymmetry and Self-renewing Cell Fate
Our data suggest that NG2 and EGFR provide a cell fate switch, which instructs the OPC progeny to proliferate and self-renew in response to activated EGFR signaling rather then to differentiate. Indeed, reduced signaling of EGFR in wa1 mice leads to attenuation of NG2+ OPC proliferation under normal physiological conditions and after focal demyelination (Aguirre and Gallo, 2007). NG2 might establish EGFR asymmetry directly, e.g., by affecting EGFR degradation or by inducing conformational changes in EGFR that facilitate asymmetric segregation and hence activation in only one of the two daughter cells. EGFR asymmetry in neural stem cells in the adult SVZ is regulated by endocytosis-mediated degradation via dual-specificity kinase Dyrk1A (Ferron et al., 2010). EGFR expression levels are however not visibly changed in NG2 KO OPC, suggesting that EGFR stability is not regulated by NG2. Proteoglycans have been reported to function as co-receptors and facilitate conformational changes (Ruoslahti and Yamaguchi, 1991). It remains to be determined whether EGFR conformation and its activation in the NG2+ daughter cells may depend on NG2. Further investigations are needed to study the alternative possibility that NG2 regulates EGFR activation indirectly by interacting with other proteins.
OPC Symmetry and Tumor Initiation
The notion that asymmetric cell divisions protect stem and progenitor cells from neoplastic transformation has been indirectly supported by data in leukemia (Congdon and Reya, 2008) and mammary cancer (Cicalese et al, 2010). Our data point towards a direct lineage relationship of asymmetry-defective NG2+ OPC - the glioma precursors - and NG2+ tumor initiating cells from low- and high-grade oligodendrogliomas (Persson et al, 2010). Importantly, conserved regulators of polarity and asymmetric cell division are bona-fide oncogenes and tumor suppressors (Knoblich, 2010). Only a few of the conserved asymmetry regulators have established functions in regulating cell fate, self-renewal, and differentiation in mammalian neural progenitors. Among those are TRIM32, a homologue of the translational regulator and cell fate determinant BRAT (Schwamborn et al., 2009), and PARD3, a PDZ-domain protein (Bultje et al., 2009). Both proteins localize asymmetrically in neural progenitor cells and control the balance of self-renewal and differentiating neurons. Importantly, we found TRIM32 and PARD3 among those genes, which are significantly misexpressed in grade II oligodendroglioma tissue. In addition, downregulated in grade II oligodendroglioma tissue is TRIM3, which encodes TRIM-NHL proteins and homologues of the brat/mei-26 tumor suppressors (Lee et al., 2006). Moreover, atypical protein kinase C zeta (PKCζ), the G-protein signaling modulator and AGS3-like gene GPSM3, and the cell fate determinant NUMBLIKE (NUMBL) are also downregulated in grade II oligodendrogliomas, albeit at p-values >0.05. PKCζ and GPSM3 map to chromosome arm 1p and NUMBL maps to chromosome arm 19q. 1p and 19q are frequently co-deleted in low-grade oligodendrogliomas. Future studies will be aimed at investigating asymmetry regulator functions in glioma precursors. Defects in asymmetric cell division may provide a point of disruption to which anti-glioma therapies can be targeted.
Experimental Procedures
Mice
All mouse experiments were approved by and performed according to the guidelines of the Institutional Animal Care and Use Committee of the University of California, San Francisco. S100β-verbB transgenic and p53 null alleles were maintained in a pure FvB/N background, bred and genotyped as previously described (Weiss et al., 2003). Mice homozygous deleted for NG2 and control littermates were maintained on a C57/B6 background as described (Kucharova and Stallcup, 2010). NOD SCID mice were from Jackson Laboratories.
Cell Culture and Pair Assay
Cells were isolated from the CC which includes the subcallosal zone of 2 months old mice unless otherwise stated, cultured in neurosphere proliferative medium with EGF and bFGF as previously described (Silber et al., 2008). Cells were subjected to a pair assay as described (Sun et al., 2005). In brief, cells were plated at clonal density for 12 – 36 hrs and cell pairs formed were observed and fixed and subjected to immunostaining with primary antibody and fluorescence-coupled secondary antibody as previously described. Nuclei were visualized using DAPI (Sigma). Unless indicated otherwise, for pair assay a minimum of 50 and up to 200 cell pairs per cell type and condition, respectively, were analyzed, using a fluorescent microscope.
Immunostaining and In vivo Pair Assay
Mouse sections were made from fresh frozen brains, post-fixed for 10 min with 4% PFA, blocked with PBS 10% NGS, 0.1% Triton X-100 for 1hr and stained with primary antibody o/n, washed and stained with fluorescence-couple secondary antibodies. For BrdU labeling, mice were injected intraperitoneally with 10mg/ml BrdU every 12 hrs for 3 days, brains were sectioned and post-fixed with acetone/methanol (1:1) for 5 min. For quantifications of cell pairs, the entire CC area was counted for cells expressing OPC markers and PH3/BrdU/NG2 triple-positive cells and a minimum of three distinct brain sections was counted per animal in three individual animals. Antibodies used are described in Supplemental Information.
Human Oligodendroglioma
The Brain Tumor Research Center Tissue Bank (University of California, San Francisco) provided the human tumor samples. The samples were collected during surgery from consented patients, assigned a non-identifying number (SF#) according to protocol approved by the UCSF Committee on Human Research, stored in proliferative neurosphere medium at 4°C, processed within four hours after resection and NG2+ cells were isolated as described using NG2 antibody (1:500; Chemicon) and microbead-tagged goat anti-rabbit IgG (Miltenyi) (Persson et al, 2010).
Gene expression analysis of asymmetric cell division regulators
The expression profiles for 27 human ODG grade II tumor samples and 28 reference samples were downloaded from the REMBRANDT database. The null hypothesis H0 that tumor samples and normal brain samples exhibit no differences in expression was tested against its alternative H1 for every asymmetry gene available in the dataset. A Mann-Whitney test was performed for candidate asymmetry genes and adjusted for multiple hypotheses testing using the FDR correction. Differential expression between the two groups was identified for 17 genes at a p-value < 0.05.
Supplementary Material
Highlights.
Oligodendrocyte progenitors divide asymmetrically to generate distinct progeny (82)
NG2/EGFR asymmetry is a cell fate switch in oligodendrocyte progenitors (81)
Asymmetry loss correlates with aberrant self-renewal and impaired differentiation (85)
Asymmetry loss distinguishes normal progenitors from glioma precursors and cells (84)
Significance.
Defects accompanying the neoplastic transformation of NG2+ oligodendrocyte progenitor cells (OPC) were poorly understood. We demonstrate that normal OPC undergo asymmetric divisions by asymmetrically segregating NG2 and EGFR. We provide mechanistic insights explaining how NG2 participates in a cell fate switch and NG2 asymmetry generates a one-to-one ratio of self-renewing and differentiating cells. We unravel loss of asymmetric division at premalignant stages in human NG2+ oligodendroglioma cells and in aberrantly self-renewing, differentiation-defective murine NG2+ OPC, which we identify as oligodendroglioma precursors, due to their tumor-initiating potential. Our data suggest that asymmetric cell divisions maintain homeostasis in the postnatal oligodendrocyte lineage. Loss of asymmetric division is an early defect that distinguishes NG2+ glioma precursors and glioma cells from non-neoplastic NG2+ OPC.
Acknowledgments
We thank Drs. A. Alvarez-Buylla and N. Jura for helpful comments, M. Oft for FACS data analyses, Ilona Garner for editing, and Cynthia Cowdrey for technical assistance. This work is supported by grants from the National Brain Tumor Foundation, Academic Senate, REAC and CTSI-SOS, American Cancer Society Institutional Award, BaCaTec, FDN-BTAC Members Fund, Brain Tumor Research Sobrato Fund, Farber A & J Foundation Inc., Grove Foundation and NIH RO1 164746 (to CP), PROSA LMU Munich (N.A.), DAAD (P.H.), American Brain Tumor Association (CP/AIP), NIH SPORE P50 CA097257 (CP/WAW), Samuel Waxman Cancer Research Foundation (WAW), Opportunity Award UCSF Sandler Program in Basic Science (GB), the Swedish Society for Medical Research and Medical Research Council (AIP) and the Swiss National Science Foundation (CL).
Footnotes
Publisher's Disclaimer: This is a PDF file of an unedited manuscript that has been accepted for publication. As a service to our customers we are providing this early version of the manuscript. The manuscript will undergo copyediting, typesetting, and review of the resulting proof before it is published in its final citable form. Please note that during the production process errors may be discovered which could affect the content, and all legal disclaimers that apply to the journal pertain.
References
- Aguirre A, Dupree JL, Mangin JM, Gallo V. A functional role for EGFR signaling in myelination and remyelination. Nat Neurosci. 2007;10:990–1002. doi: 10.1038/nn1938. [DOI] [PubMed] [Google Scholar]
- Aguirre A, Gallo V. Reduced EGFR signaling in progenitor cells of the adult subventricular zone attenuates oligodendrogenesis after demyelination. Neuron Glia Biol. 2007;3:209–220. doi: 10.1017/S1740925X08000082. [DOI] [PMC free article] [PubMed] [Google Scholar]
- Alcantara Llaguno S, Chen J, Kwon CH, Jackson EL, Li Y, Burns DK, Alvarez-Buylla A, Parada LF. Malignant astrocytomas originate from neural stem/progenitor cells in a somatic tumor suppressor mouse model. Cancer Cell. 2009;15:45–56. doi: 10.1016/j.ccr.2008.12.006. [DOI] [PMC free article] [PubMed] [Google Scholar]
- Assanah M, Lochhead R, Ogden A, Bruce J, Goldman J, Canoll P. Glial progenitors in adult white matter are driven to form malignant gliomas by platelet-derived growth factor-expressing retroviruses. J Neurosci. 2006;26:6781–6790. doi: 10.1523/JNEUROSCI.0514-06.2006. [DOI] [PMC free article] [PubMed] [Google Scholar]
- Bae JH, Schlessinger J. Asymmetric tyrosine kinase arrangements in activation or autophosphorylation of receptor tyrosine kinases. Mol Cells. 2010;29:443–448. doi: 10.1007/s10059-010-0080-5. [DOI] [PubMed] [Google Scholar]
- Briancon-Marjollet A, Balenci L, Fernandez M, Esteve F, Honnorat J, Farion R, Beaumont M, Barbier E, Remy C, Baudier J. NG2−expressing glial precursor cells are a new potential oligodendroglioma cell initiating population in N-ethyl-N-nitrosourea-induced gliomagenesis. Carcinogenesis. 2010;31:1718–1725. doi: 10.1093/carcin/bgq154. [DOI] [PMC free article] [PubMed] [Google Scholar]
- Bultje RS, Castaneda-Castellanos DR, Jan LY, Jan YN, Kriegstein AR, Shi SH. Mammalian Par3 regulates progenitor cell asymmetric division via notch signaling in the developing neocortex. Neuron. 2009;63:189–202. doi: 10.1016/j.neuron.2009.07.004. [DOI] [PMC free article] [PubMed] [Google Scholar]
- Capela A, Temple S. LeX/ssea-1 is expressed by adult mouse CNS stem cells, identifying them as nonependymal. Neuron. 2002;35:865–875. doi: 10.1016/s0896-6273(02)00835-8. [DOI] [PubMed] [Google Scholar]
- Caussinus E, Gonzalez C. Induction of tumor growth by altered stem-cell asymmetric division in Drosophila melanogaster. Nat Genet. 2005;37:1125–1129. doi: 10.1038/ng1632. [DOI] [PubMed] [Google Scholar]
- Cicalese A, Bonizzi G, Pasi CE, Faretta M, Ronzoni S, Giulini B, Brisken C, Minucci S, Di Fiore PP, Pelicci PG. The tumor suppressor p53 regulates polarity of self-renewing divisions in mammary stem cells. Cell. 2009;138:1083–1095. doi: 10.1016/j.cell.2009.06.048. [DOI] [PubMed] [Google Scholar]
- Congdon KL, Reya T. Divide and conquer: how asymmetric division shapes cell fate in the hematopoietic system. Curr Opin Immunol. 2008;20:302–307. doi: 10.1016/j.coi.2008.05.003. [DOI] [PMC free article] [PubMed] [Google Scholar]
- Dawson MR, Polito A, Levine JM, Reynolds R. NG2-expressing glial progenitor cells: an abundant and widespread population of cycling cells in the adult rat CNS. Mol Cell Neurosci. 2003;24:476–488. doi: 10.1016/s1044-7431(03)00210-0. [DOI] [PubMed] [Google Scholar]
- Dromard C, Bartolami S, Deleyrolle L, Takebayashi H, Ripoll C, Simonneau L, Prome S, Puech S, Tran VB, Duperray C, et al. NG2 and Olig2 expression provides evidence for phenotypic deregulation of cultured central nervous system and peripheral nervous system neural precursor cells. Stem Cells. 2007;25:340–353. doi: 10.1634/stemcells.2005-0556. [DOI] [PubMed] [Google Scholar]
- Ducray F, Idbaih A, de Reynies A, Bieche I, Thillet J, Mokhtari K, Lair S, Marie Y, Paris S, Vidaud M, et al. Anaplastic oligodendrogliomas with 1p19q codeletion have a proneural gene expression profile. Mol Cancer. 2008;7:41. doi: 10.1186/1476-4598-7-41. [DOI] [PMC free article] [PubMed] [Google Scholar]
- Erben V, Waldhuber M, Langer D, Fetka I, Jansen RP, Petritsch C. Asymmetric localization of the adaptor protein Miranda in neuroblasts is achieved by diffusion and sequential interaction of Myosin II and VI. J Cell Sci. 2008;121:1403–1414. doi: 10.1242/jcs.020024. [DOI] [PubMed] [Google Scholar]
- Ferron SR, Pozo N, Laguna A, Aranda S, Porlan E, Moreno M, Fillat C, de la Luna S, Sanchez P, Arbones ML, et al. Regulated segregation of kinase Dyrk1A during asymmetric neural stem cell division is critical for EGFR-mediated biased signaling. Cell Stem Cell. 2010;7:367–379. doi: 10.1016/j.stem.2010.06.021. [DOI] [PubMed] [Google Scholar]
- Gabay L, Lowell S, Rubin LL, Anderson DJ. Deregulation of dorsoventral patterning by FGF confers trilineage differentiation capacity on CNS stem cells in vitro. Neuron. 2003;40:485–499. doi: 10.1016/s0896-6273(03)00637-8. [DOI] [PubMed] [Google Scholar]
- Galli R, Binda E, Orfanelli U, Cipelletti B, Gritti A, De Vitis S, Fiocco R, Foroni C, Dimeco F, Vescovi A. Isolation and characterization of tumorigenic, stem-like neural precursors from human glioblastoma. Cancer Res. 2004;64:7011–7021. doi: 10.1158/0008-5472.CAN-04-1364. [DOI] [PubMed] [Google Scholar]
- Gard AL, Pfeiffer SE. Two proliferative stages of the oligodendrocyte lineage (A2B5+O4− and O4+GalC−) under different mitogenic control. Neuron. 1990;5:615–625. doi: 10.1016/0896-6273(90)90216-3. [DOI] [PubMed] [Google Scholar]
- Ge WP, Zhou W, Luo Q, Jan LY, Jan YN. Dividing glial cells maintain differentiated properties including complex morphology and functional synapses. Proc Natl Acad Sci U S A. 2009;106:328–333. doi: 10.1073/pnas.0811353106. [DOI] [PMC free article] [PubMed] [Google Scholar]
- Goretzki L, Burg MA, Grako KA, Stallcup WB. High-affinity binding of basic fibroblast growth factor and platelet-derived growth factor-AA to the core protein of the NG2 proteoglycan. J Biol Chem. 1999;274:16831–16837. doi: 10.1074/jbc.274.24.16831. [DOI] [PubMed] [Google Scholar]
- Grako KA, Ochiya T, Barritt D, Nishiyama A, Stallcup WB. PDGF (alpha)-receptor is unresponsive to PDGF-AA in aortic smooth muscle cells from the NG2 knockout mouse. J Cell Sci. 1999;112(Pt 6):905–915. doi: 10.1242/jcs.112.6.905. [DOI] [PubMed] [Google Scholar]
- Hemmati HD, Nakano I, Lazareff JA, Masterman-Smith M, Geschwind DH, Bronner-Fraser M, Kornblum HI. Cancerous stem cells can arise from pediatric brain tumors. Proc Natl Acad Sci U S A. 2003;100:15178–15183. doi: 10.1073/pnas.2036535100. [DOI] [PMC free article] [PubMed] [Google Scholar]
- Ito T, Kwon HY, Zimdahl B, Congdon KL, Blum J, Lento WE, Zhao C, Lagoo A, Gerrard G, Foroni L, et al. Regulation of myeloid leukaemia by the cell-fate determinant Musashi. Nature. 2010;466:765–768. doi: 10.1038/nature09171. [DOI] [PMC free article] [PubMed] [Google Scholar]
- Ivkovic S, Canoll P, Goldman JE. Constitutive EGFR signaling in oligodendrocyte progenitors leads to diffuse hyperplasia in postnatal white matter. J Neurosci. 2008;28:914–922. doi: 10.1523/JNEUROSCI.4327-07.2008. [DOI] [PMC free article] [PubMed] [Google Scholar]
- Jenkins RB, Blair H, Ballman KV, Giannini C, Arusell RM, Law M, Flynn H, Passe S, Felten S, Brown PD, et al. A t(1;19)(q10;p10) mediates the combined deletions of 1p and 19q and predicts a better prognosis of patients with oligodendroglioma. Cancer Res. 2006;66:9852–9861. doi: 10.1158/0008-5472.CAN-06-1796. [DOI] [PubMed] [Google Scholar]
- Kang SH, Fukaya M, Yang JK, Rothstein JD, Bergles DE. NG2+ CNS glial progenitors remain committed to the oligodendrocyte lineage in postnatal life and following neurodegeneration. Neuron. 2010;68:668–681. doi: 10.1016/j.neuron.2010.09.009. [DOI] [PMC free article] [PubMed] [Google Scholar]
- Knoblich JA. Asymmetric cell division: recent developments and their implications for tumour biology. Nat Rev Mol Cell Biol. 2010;11:849–860. doi: 10.1038/nrm3010. [DOI] [PMC free article] [PubMed] [Google Scholar]
- Kucharova K, Stallcup WB. The NG2 proteoglycan promotes oligodendrocyte progenitor proliferation and developmental myelination. Neuroscience. 2010;166:185–194. doi: 10.1016/j.neuroscience.2009.12.014. [DOI] [PMC free article] [PubMed] [Google Scholar]
- Lee CY, Wilkinson BD, Siegrist SE, Wharton RP, Doe CQ. Brat is a Miranda cargo protein that promotes neuronal differentiation and inhibits neuroblast self-renewal. Dev Cell. 2006;10:441–449. doi: 10.1016/j.devcel.2006.01.017. [DOI] [PubMed] [Google Scholar]
- Lindberg N, Kastemar M, Olofsson T, Smits A, Uhrbom L. Oligodendrocyte progenitor cells can act as cell of origin for experimental glioma. Oncogene. 2009;28:2266–2275. doi: 10.1038/onc.2009.76. [DOI] [PubMed] [Google Scholar]
- Madhavan S, Zenklusen JC, Kotliarov Y, Sahni H, Fine HA, Buetow K. Rembrandt: helping personalized medicine become a reality through integrative translational research. Mol Cancer Res. 2009;7:157–167. doi: 10.1158/1541-7786.MCR-08-0435. [DOI] [PMC free article] [PubMed] [Google Scholar]
- Makagiansar IT, Williams S, Mustelin T, Stallcup WB. Differential phosphorylation of NG2 proteoglycan by ERK and PKCalpha helps balance cell proliferation and migration. J Cell Biol. 2007;178:155–165. doi: 10.1083/jcb.200612084. [DOI] [PMC free article] [PubMed] [Google Scholar]
- Ozerdem U, Grako KA, Dahlin-Huppe K, Monosov E, Stallcup WB. NG2 proteoglycan is expressed exclusively by mural cells during vascular morphogenesis. Dev Dyn. 2001;222:218–227. doi: 10.1002/dvdy.1200. [DOI] [PubMed] [Google Scholar]
- Pei Y, Wechsler-Reya RJ. A malignant oligarchy: progenitors govern the behavior of oligodendrogliomas. Cancer Cell. 2010;18:546–547. doi: 10.1016/j.ccr.2010.11.031. [DOI] [PMC free article] [PubMed] [Google Scholar]
- Persson AI, Petritsch C, Swartling FJ, Itsara M, Sim FJ, Auvergne R, Goldenberg DD, Vandenberg SR, Nguyen KN, Yakovenko S, et al. Non-stem cell origin for oligodendroglioma. Cancer Cell. 2010;18:669–682. doi: 10.1016/j.ccr.2010.10.033. [DOI] [PMC free article] [PubMed] [Google Scholar]
- Petritsch C, Tavosanis G, Turck CW, Jan LY, Jan YN. The Drosophila myosin VI Jaguar is required for basal protein targeting and correct spindle orientation in mitotic neuroblasts. Dev Cell. 2003;4:273–281. doi: 10.1016/s1534-5807(03)00020-0. [DOI] [PubMed] [Google Scholar]
- Psachoulia K, Jamen F, Young KM, Richardson WD. Cell cycle dynamics of NG2 cells in the postnatal and ageing brain. Neuron Glia Biol. 2009;5:57–67. doi: 10.1017/S1740925X09990354. [DOI] [PMC free article] [PubMed] [Google Scholar]
- Ruoslahti E, Yamaguchi Y. Proteoglycans as modulators of growth factor activities. Cell. 1991;64:867–869. doi: 10.1016/0092-8674(91)90308-l. [DOI] [PubMed] [Google Scholar]
- Schwamborn JC, Berezikov E, Knoblich JA. The TRIM-NHL protein TRIM32 activates microRNAs and prevents self-renewal in mouse neural progenitors. Cell. 2009;136:913–925. doi: 10.1016/j.cell.2008.12.024. [DOI] [PMC free article] [PubMed] [Google Scholar]
- Seri B, Herrera DG, Gritti A, Ferron S, Collado L, Vescovi A, Garcia-Verdugo JM, Alvarez-Buylla A. Composition and organization of the SCZ: a large germinal layer containing neural stem cells in the adult mammalian brain. Cereb Cortex. 2006;16 Suppl 1:i103–111. doi: 10.1093/cercor/bhk027. [DOI] [PubMed] [Google Scholar]
- Shen Q, Zhong W, Jan YN, Temple S. Asymmetric Numb distribution is critical for asymmetric cell division of mouse cerebral cortical stem cells and neuroblasts. Development. 2002;129:4843–4853. doi: 10.1242/dev.129.20.4843. [DOI] [PubMed] [Google Scholar]
- Simon C, Gotz M, Dimou L. Progenitors in the adult cerebral cortex: Cell cycle properties and regulation by physiological stimuli and injury. Glia. 2011 doi: 10.1002/glia.21156. [DOI] [PubMed] [Google Scholar]
- Singh SK, Clarke ID, Terasaki M, Bonn VE, Hawkins C, Squire J, Dirks PB. Identification of a cancer stem cell in human brain tumors. Cancer Res. 2003;63:5821–5828. [PubMed] [Google Scholar]
- Sun Y, Goderie SK, Temple S. Asymmetric distribution of EGFR receptor during mitosis generates diverse CNS progenitor cells. Neuron. 2005;45:873–886. doi: 10.1016/j.neuron.2005.01.045. [DOI] [PubMed] [Google Scholar]
- Temple S, Raff MC. Clonal analysis of oligodendrocyte development in culture: evidence for a developmental clock that counts cell divisions. Cell. 1986;44:773–779. doi: 10.1016/0092-8674(86)90843-3. [DOI] [PubMed] [Google Scholar]
- Trotter J, Karram K, Nishiyama A. NG2 cells: Properties, progeny and origin. Brain Res Rev. 2010;63:72–82. doi: 10.1016/j.brainresrev.2009.12.006. [DOI] [PMC free article] [PubMed] [Google Scholar]
- Weiss WA, Burns MJ, Hackett C, Aldape K, Hill JR, Kuriyama H, Kuriyama N, Milshteyn N, Roberts T, Wendland MF, et al. Genetic determinants of malignancy in a mouse model for oligodendroglioma. Cancer Res. 2003;63:1589–1595. [PubMed] [Google Scholar]
- Wolswijk G, Noble M. Cooperation between PDGF and FGF converts slowly dividing O-2Aadult progenitor cells to rapidly dividing cells with characteristics of O-2Aperinatal progenitor cells. J Cell Biol. 1992;118:889–900. [Google Scholar]
- Wu M, Kwon HY, Rattis F, Blum J, Zhao C, Ashkenazi R, Jackson TL, Gaiano N, Oliver T, Reya T. Imaging hematopoietic precursor division in real time. Cell Stem Cell. 2007;1:541–554. doi: 10.1016/j.stem.2007.08.009. [DOI] [PMC free article] [PubMed] [Google Scholar]
- Zawadzka M, Rivers LE, Fancy SP, Zhao C, Tripathi R, Jamen F, Young K, Goncharevich A, Pohl H, Rizzi M, et al. CNS-resident glial progenitor/stem cells produce Schwann cells as well as oligodendrocytes during repair of CNS demyelination. Cell Stem Cell. 2010;6:578–590. doi: 10.1016/j.stem.2010.04.002. [DOI] [PMC free article] [PubMed] [Google Scholar]
- Zhu X, Hill RA, Dietrich D, Komitova M, Suzuki R, Nishiyama A. Age-dependent fate and lineage restriction of single NG2 cells. Development. 2011;138:745–753. doi: 10.1242/dev.047951. [DOI] [PMC free article] [PubMed] [Google Scholar]
Associated Data
This section collects any data citations, data availability statements, or supplementary materials included in this article.