

Abstract
Aims/hypothesis
Glucose-induced insulin secretion is attributed to a rise of beta cell cytosolic free [Ca2+] ([Ca2+]c) (triggering pathway) and amplification of the action of Ca2+. This concept of amplification rests on observations that glucose can increase Ca2+-induced insulin secretion without further elevating an imposed already high [Ca2+]c. However, it remains possible that this amplification results from an increase in [Ca2+] just under the plasma membrane ([Ca2+]SM), which escaped detection by previous measurements of global [Ca2+]c. This was the hypothesis that we tested here by measuring [Ca2+]SM.
Methods
The genetically encoded Ca2+ indicators D3-cpv (untargeted) and LynD3-cpv (targeted to plasma membrane) were expressed in clusters of mouse beta cells. LynD3-cpv was also expressed in beta cells within intact islets. [Ca2+]SM changes were monitored using total internal reflection fluorescence microscopy. Insulin secretion was measured in parallel.
Results
Beta cells expressing D3cpv or LynD3cpv displayed normal [Ca2+] changes and insulin secretion in response to glucose. Distinct [Ca2+]SM fluctuations were detected during repetitive variations of KCl between 30 and 32–35 mmol/l, attesting to the adequate sensitivity of our system. When the amplifying pathway was evaluated (high KCl+diazoxide), increasing glucose from 3 to 15 mmol/l consistently lowered [Ca2+]SM while stimulating insulin secretion approximately two fold. Blocking Ca2+ uptake by the endoplasmic reticulum largely attenuated the [Ca2+]SM decrease produced by high glucose but did not unmask localised [Ca2+]SM increases.
Conclusions/interpretation
Glucose can increase Ca2+-induced insulin secretion without causing further elevation of beta cell [Ca2+]SM. The phenomenon is therefore a true amplification of the triggering action of Ca2+.
Keywords: Amplifying pathway, Beta cell, Cytosolic calcium, Insulin secretion, Islets, Plasma membrane, Stimulus–secretion coupling, Total internal reflection fluorescence microscopy
Introduction
Glucose-induced insulin secretion by beta cells is mediated by two major pathways (reviewed in [1]). In the triggering pathway, glucose metabolism leads to closure of ATP-sensitive potassium (KATP) channels in the plasma membrane, which permits depolarisation and Ca2+ influx via L-type Ca2+ channels. The subsequent increase in the cytosolic free Ca2+ concentration ([Ca2+]c) triggers exocytosis of insulin-containing granules [2, 3]. In parallel, glucose metabolism activates an amplifying pathway (previously known as the KATP channel-independent pathway) that augments the secretory response to triggering Ca2+ [4–7]. The cellular mechanisms of this amplification are still incompletely understood, but the effect of glucose is generally thought not to involve a further increase in [Ca2+]c [1, 4, 7]. This concept of a dual regulation of glucose-induced insulin secretion was originally based on measurements of global [Ca2+]c in intact islets with the classical Ca2+ probe fura2 [4]. However, such measurements of global [Ca2+]c did not rule out the possibility that glucose produces an increase in subplasmalemmal [Ca2+] ([Ca2+]SM) that escaped detection. A localised increase in [Ca2+]SM would imply that the increase in secretion is not a true amplification, and the model would require a major revision.
Localised changes in the triggering Ca2+ signal could result from glucose actions that are independent from the KATP channel-mediated control of membrane potential. Glucose metabolism could increase the activity of L-type Ca2+ channels [8, 9], influence Ca2+ handling by intracellular Ca2+ stores [10] and modulate the rate of Ca2+ extrusion through the plasma membrane [11]. As yet undetected [Ca2+] changes confined to subplasma membrane domains where Ca2+-dependent exocytosis takes place [12–17] might therefore account for the apparent amplification phenomenon. Studies using capacitance measurements in single, dialysed beta cells also suggested that exocytosis of insulin granules requires higher than average [Ca2+]c measured in intact cells or whole islets [18].
Mainly because of previous limitations in imaging technology, only a few groups have attempted to measure [Ca2+]SM in beta cells using conventional fluorescent probes [12, 19, 20]. To our knowledge, direct dynamic measurements of [Ca2+]SM were only achieved in three studies [17, 21, 22], but none of these looked for specific [Ca2+ ]SM changes during amplification of insulin secretion by glucose.
In the present study we therefore tested the hypothesis that the apparent amplifying effect of glucose on insulin secretion is, in fact, attributable to an increase in [Ca2+]SM. To this end, the genetically encoded ratiometric Ca2+ indicator D3cpv (design 3 with circular permuted venus) [23], a probe based on fluorescence resonance energy transfer, was adenovirally targeted in clusters of mouse beta cells. [Ca2+]SM changes were then monitored by total internal reflection fluorescence (TIRF) [24] microscopy in parallel with insulin secretion. We also used LynD3cpv, a variant of the Ca2+ probe that is addressed to the plasma membrane [23], and specifically expressed it in beta cells within clusters or intact islets.
Methods
Vectors and adenoviruses generation
To measure [Ca2+]SM, adenoviruses ensuring production of D3cpv or LynD3cpv were constructed (see Electronic supplementary material [ESM 1] for description of method). D3cpv was produced under the control of the cytomegalovirus promoter, while LynD3cpv was specifically produced in beta cells by a dual recombinant adenovirus strategy, using Rip-Cre and LoxStopLox-LynD3cpv adenoviruses. The Rip-Cre adenovirus, permitting production of the Cre recombinase under control of the rat insulin promoter, was kindly provided by H. Ishihara (Tohoku University Graduate School of Medicine, Sendai, Miyagi, Japan) [25].
Preparations and solutions
The study was approved by our Commission d'Ethique d'Expérimentation Animale. Islets from 4–6-month-old female NMRI mice were obtained by collagenase digestion of the pancreas. Clusters of cells were prepared by dispersion of isolated islets with trypsin and plated on glass coverslips (n=1.53) in RPMI-1640 medium containing 10 mmol/l glucose. After overnight culture, clusters were infected during 4 h with the D3cpv or LynD3cpv and Rip-Cre adenoviruses, and the experiments were performed 1 day after (i.e. after 2 days of culture). Intact islets were infected for 4 h with both LynD3cpv and Rip-Cre adenoviruses immediately after isolation, and the experiments were performed 1 day after (i.e. after 1 day of culture).
The medium used for islet isolation was a bicarbonate-buffered solution containing (mmol/l): NaCl 120, KCl 4.8, CaCl2 2.5, MgCl2 1.2 and NaHCO3 24. It was gassed with O2:CO2 (94:6) to maintain pH 7.4 and was supplemented with 1 mg/ml bovine serum albumin and 10 mmol/l glucose. A similar medium was used for the experiments. Increases in KCl concentration to 30, 32, 35 or 100 mmol/l were compensated for by decreases in NaCl.
TIRF microscopy
A ×100 lens with a 1.49 numerical aperture was used. For the experiments with D3cpv or LynD3cpv, a 405 nm laser was used as excitation source (Roper Scientific, Evry, France) and the emitted light was filtered at both 475 nm (cyan fluorescent protein) and 540 nm (circularly permuted venus [cpv]) (see ESM 1 for details). The experiments were performed in a temperature-controlled perifusion chamber, and islets and clusters of cells were constantly perifused at 37°C.
Immunocytochemistry
Cells were fixed for 3 h with 4% paraformaldehyde and immunostained for insulin with a mouse monoclonal antibody (Abcam, Cambridge, UK), or for glucagon with a rabbit polyclonal antibody (Novocastra, Zaventem, Belgium), and subsequently revealed with either an Alexa Fluor 594 goat anti-mouse IgG or goat anti-rabbit IgG (Molecular Probes, Eugene, OR, USA), respectively.
Confocal imaging
Images were captured on a Nikon Eclipse TE2000-E inverted microscope equipped with a confocal QLC100 spinning disk (Visitech International, Sunderland, UK), using a ×100 oil immersion objective.
Insulin secretion
In some [Ca2+]SM experiments effluent fractions were collected every 2 min and saved for insulin assay using rat insulin as a standard. Changes in insulin secretion are expressed as a percentage of basal values. [Ca2+]SM measured in a field containing up to six cells of the same coverslip is therefore representative of the changes occurring in the ∼8,000 cells from which insulin secretion was measured in parallel.
Statistical analysis
Data are shown as representative traces or means ± SE of results obtained with the indicated number of cells and experiments. The statistical significance of differences between means was assessed by paired or unpaired Student's t test, as appropriate.
Results
The cytosolic Ca2+ indicator D3cpv is preferentially expressed in beta cells
We used immunocytochemistry to determine the proportion of beta cells vs non-beta cells producing D3cpv under control of the strong cytomegalovirus promoter (Fig. 1a–d). Of the D3cpv-positive cells, 92% (262/285 cells) were also positive for insulin (Fig. 1a). The efficiency of beta cell infection was 56% (197/353 cells), whereas only 16% (31/191) of glucagon-positive cells expressed D3cpv In most clusters of islet cells, only non-alpha cells expressed the Ca2+ indicator (Fig. 1b). Moreover, the intensity of D3cpv expression in alpha cells was generally much lower than in beta cells (compare the cluster and the single alpha cell indicated by the arrow in Fig. 1d). Altogether these results indicate a preferential expression of D3cpv in beta cells rather than non-beta cells.
Fig. 1.
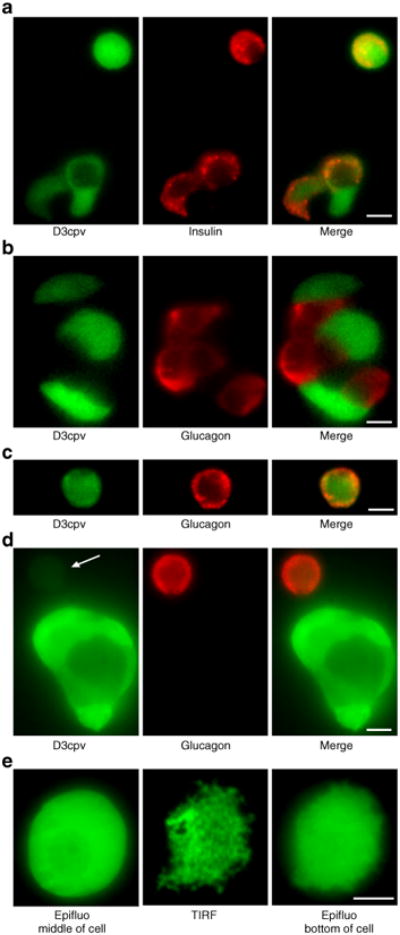
Cellular expression of the Ca2+ indicator D3cpv in dispersed islet cells. a-d Immunocytochemistry performed in dispersed mouse islet cells. Left panels show the D3cpv fluorescence (excited at 491 nm), middle panels illustrate insulin (a) or glucagon (b–d) immunoreactivity (excited at 561 nm) and right panels show a merging of both images. The arrow in (d) points to a weakly fluorescent alpha cell. e Images of the Ca2+ indicator D3cpv in: epifluorescence (Epifluo middle of cell), total internal reflection fluorescence (TIRF) and epifluorescence from the same focal plane as TIRF (Epifluo bottom of cell). Scale bar, 5 μm
TIRF microscopy detects [Ca2+]SM and D3cpv can be used as a reporter of [Ca2+]SM changes in clusters of beta cells
To ascertain that our TIRF measurements detect [Ca2+]SM, we looked for [Ca2+]SM ‘hot spots’ elicited by opening of voltage-dependent Ca2+ channels. Using a fast Ca2+ probe, Fluo-4, a very fast acquisition rate (100– 150 Hz) and intracellular EGTA to inhibit Ca2+ wave diffusion [26], Ca2+ ‘hot spots’ were detected at the onset of depolarisation with KCl (ESM Video clip, ESM Fig. 1). Such events were not seen by global [Ca2+]c measurements. While this detection establishes the adequacy of our TIRF system to measure [Ca2+]SM, the necessary experimental tricks (cytosolic Ca2+ buffering with EGTA, strong laser illumination) and the use of a non-ratiometric probe are incompatible with the long recordings requested to study metabolic amplification by glucose. We therefore used the ratiometric probe D3cpv and TIRF microscopy [24] (Fig. 1e, middle panel). Because the evanescent field excites D3cpv over a very thin section close to the coverslip, the technique visualises regions of contact between the plasma membrane and the coverslip, which cannot be seen in epifluorescence mode (Fig. 1e middle, vs Fig. 1e left and right panels). As the plasma membrane does not sit flat on the glass coverslip, some protrusions out of the TIRF field were also visible.
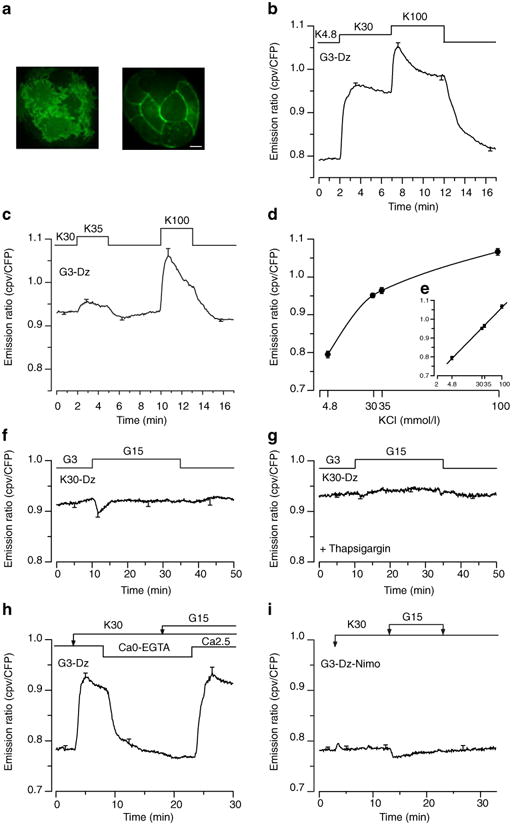
We first ascertained that D3cpv was not saturated at high [Ca2+], as expected beneath the plasma membrane, and was therefore suitable to measure local changes. Beta cells were treated with a Ca2+ ionophore (ionomycin) or permeabilised with α-toxin or digitonin in an attempt to determine maximum and minimum fluorescence ratios. However, it proved impossible to accurately control intracellular [Ca2+] or the probe was washed out after permeabilisation (not shown) even when it was directly targeted to the plasma membrane. To circumvent this drawback, we tested the sensitivity of D3cpv in intact beta cells during depolarisation with several concentrations of KCl. Depolarisation with 30 mmol/l KCl increased the fluorescence ratio of D3cpv beneath the plasma membrane by 43±2% (Fig. 2a). Increasing KCl to 100 mmol/l further augmented the fluorescence of the probe by 17±2% (Fig. 2a,b,d). To test whether small changes in [Ca2+]SM could be detected, the cells were submitted to minor increases in the KCl concentration from 30 to 32 and 35 mmol/l (Fig. 2b,c,d). These manoeuvres induced unambiguous increases in the fluorescence ratio beneath the plasma membrane, by 1.5± 0.6% (p<0.05) and 3.7±0.8% (p=0.001), respectively (Fig. 2c). We, therefore, conclude that the probe is not saturated during steady-state depolarisation of the cells with 30 mmol/l KCl (Fig. 2d,e).
Fig. 2.

KCl-induced [Ca2+]SM changes measured by total internal reflection fluorescence (TIRF) microscopy in dispersed islet cells expressing D3cpv. Beta cell clusters were perifused with 3 mmol/l glucose (G3) and 250 μmol/l diazoxide (Dz). a The KCl concentration (K) was increased from 4.8 to 30 and 100 mmol/l as indicated. b The KCl concentration was increased from 30 to 35 and 100 mmol/l as indicated. c The KCl concentration was increased from 30 to 32 and 35 mmol/l as indicated. d Dose– response curve of [Ca2+]SM changes induced by KCl concentration. e The same graph as (d) plotted with a log scale. Values are means ± SE for 10–28 cells from four to six experiments with three or four different islet preparations. CFP, cyan fluorescent protein
The Ca2+ indicator D3cpv, designed to be unaffected by endogenous calmodulin [23], has been used in the MIN6 clonal beta cell line [27], but not previously tested in primary beta cells. Hence, we verified that expression of the probe did not alter glucose-induced Ca2+ and insulin secretion changes. Upon stimulation with 15 mmol/l glucose, beta cell [Ca2+]SM was found to change similarly to global [Ca2+]c measured by conventional techniques [28], with an initial transient drop followed by a large increase and oscillations (Fig. 3a,c,d). Importantly, all of the 64 cells analysed displayed the above pattern of response, reinforcing the conclusion that we indeed studied beta cells. As also observed with the fura2 technique [29], the cells showed either fast (Fig. 3c) or slow (Fig. 3d) oscillations, and, within the same cluster, were well synchronised (Fig. 3e). Insulin secretion, measured in parallel from these clusters of beta cells, displayed biphasic changes in response to 15 mmol/l glucose: a large initial increase was followed by a sustained second phase (Fig. 3b) that was ∼5.3-fold higher than basal insulin secretion in 3 mmol/l glucose. Altogether, these results show that beta cell function was not altered by D3cpv, at least after 1 day of expression.
Fig. 3.

Glucose-induced [Ca2+]SM changes reported by total internal reflection fluorescence microscopy and insulin secretion measurements in beta cells from dispersed islet cells expressing D3cpv. Islet cells were submitted to a change in the glucose (G) concentration from 3 to 15 mmol/l as indicated in the top of panels. [Ca2+]SM (a, c–e) and insulin secretion (b) were measured in parallel, see Methods. e Traces illustrate [Ca2+]SM oscillations in the four indicated cells (f) from two separate clusters (scale bar, 5 μm). Values are either representative traces (c–e) or means ± SE for 29 cells (a) from nine experiments with six different islet preparations (a, b). CFP, cyan fluorescent protein
The amplifying pathway does not involve an increase in [Ca2+ ]SM in beta cells
The amplifying pathway was studied by a classical approach in which the glucose concentration is increased under conditions where [Ca2+]c is stably elevated. To this end, KATP channels were held open by diazoxide and Ca2+ influx was stimulated via beta cell depolarisation with 30 mmol/l KCl. Under these conditions, increasing the glucose concentration from 3 to 15 mmol/l caused a transient decrease in [Ca2+]SM in most cells (21/24), followed by a return close to prestimulatory values (Fig. 4a, thick trace). Similar results were obtained when the cells were depolarised with 60 mmol/l KCl (11 cells, not shown). Notably, the decrease in [Ca2+]SM was substantially smaller than that of [Ca2+ ]c measured, with the same probe, by conventional epifluorescence microscopy (0.022±0.012 vs 0.086±0.015 ratiometric intensity fluorescence, p=0.001). Most importantly, no cell showed an increase in [Ca2+]SM whereas insulin secretion increased about twofold (Fig. 4b, black circles). The drop in global [Ca2+]c produced by glucose in beta cells depolarised with KCl, largely results from Ca2+ sequestration into intracellular organelles [4].
Fig. 4.

Effect of glucose on [Ca2+]SM and insulin secretion during stimulation by a high concentration of KCl in beta cells from dispersed islets expressing D3cpv. Cells were perifused with a medium containing 30 mmol/l KCl (K30) and 250 μmol/l diazoxide (Dz). a The concentration of glucose was increased from 3 to 15 mmol/l and [Ca2+]SM was measured by total internal reflection fluorescence microscopy in control beta cells (thick line) or in beta cells pretreated with 1 μmol/l thapsigargin for 30 min (thin line). b Insulin secretion was measured in parallel with [Ca2+]SM, in control beta cells (black circles) or in beta cells pretreated with thapsigargin (white circles). Values are means ± SE for 25 cells (a) from 11 experiments with eight different islet preparations (a, b). CFP, cyan fluorescent protein
To verify that the avid uptake of Ca2+ by the endoplasmic reticulum did not mask a slight increase in [Ca2+]SM, clusters of beta cells were pretreated with thapsigargin, a blocker of sarco(endo)plasmic reticulum Ca2+-ATPases. Thapsigargin markedly attenuated the initial decrease in [Ca2+]SM produced by high glucose (p<0.01), and [Ca2+]SM returned to prestimulatory values after ∼3 min of glucose stimulation in nearly all cells (21/25 cells) (Fig. 4a, thin trace). The four remaining cells showed a marginal [Ca2+]SM increase above baseline (3.8±0.3%) after the transient decrease. At the same time, insulin secretion was stimulated slightly more than in cells not treated with thapsigargin (Fig. 4b, white circles). To ascertain that no effect of glucose on [Ca2+]SM escaped detection because of localised ‘hot spots’ within patches of plasma membrane, we randomly analysed regions of interest within cells and increased the frequency of acquisition (every 800 ms instead of every 5 s). This approach did not reveal any localised increase in [Ca2+]SM (not shown).
Using the recombinase Cre/lox strategy (see Methods), we specifically expressed LynD3cpv in beta cells. Via the myristoylation–palmitoylation tag linked to its N terminus [23], this modified Ca2+ probe is addressed to cholesterol-rich regions (membrane rafts) [30] of the plasma membrane, where exocytotic proteins are concentrated [3, 31]. Immunocytochemistry revealed that 99% (161/164) of LynD3cpv-positive cells were also positive for insulin (not shown). As illustrated by images taken with confocal microscopy (Fig. 5a), LynD3cpv was well targeted to the plasma membrane of beta cells, but rare punctuated intracellular fluorescence was also observed in some cells. Since the probe may occasionally be attached to internal membranes [30], we again used TIRF imaging to measure specifically [Ca2+]SM in beta cells. Following the same approach as in Fig. 2, we first determined the response of LynD3cpv to changes in [Ca2+]SM imposed by depolarisation. Compared with 4.8 mmol/l KCl, depolarisation with 30 mmol/l KCl increased the fluorescence ratio of LynD3cpv by 22±2%. An additional step to 100 mmol/l KCl further augmented the fluorescence ratio of the probe by 10±1% (Fig. 5b–e). Again, significant changes in [Ca2+]SM could be detected when cells were submitted to a minor increase in the KCl concentration from 30 to 35 mmol/l (3.4±0.9%) (Fig. 5c–e). Therefore, LynD3cpv was not saturated by [Ca2+]SM during sustained depolarisation with 30 mmol/l KCl (Fig. 5d,e).
Fig. 5.
Effects of KCl and/or glucose on [Ca2+]SM measured by total internal reflection fluorescence microscopy in dispersed islet cells expressing LynD3cpv. Beta cell clusters were perifused with 3 mmol/l glucose (G3) and 250 μmol/l diazoxide (Dz). a Confocal imaging of the LynD3cpv fluorescence (excited at 491 nm) in one cluster of beta cells monitored at the plasma membrane near the coverslip surface (left panel) or at midsection inside cells (right panel). b The KCl concentration (K) was increased from 4.8 to 30 and 100 mmol/l as indicated. c The KCl concentration was increased from 30 to 35 and 100 mmol/l as indicated. d Dose–response curve of [Ca2+]SM changes induced by various KCl concentration (e shows the same graph plotted with a log scale). f, g Cells were perifused with a medium containing 30 mmol/l KCl (K30) and 250 μmol/l diazoxide (Dz). The concentration of glucose was increased from 3 to 15 mmol/l and [Ca2+]SM was measured in control beta cells (f) or in beta cells pretreated with 1 μmol/l thapsigargin for 30 min (g). h The [KCl] was increased from 4.8 to 30 mmol/l, and cells were stimulated by 15 mmol/l glucose as indicated. The extracellular [Ca2+] was removed (Ca0) and 500 μmol/l EGTA were added (Ca0-EGTA) after 10 min of perifusion for 15 min. i Cells were perifused in the presence of 1 μmol/l nimodipine and were stimulated by 30 mmol/l KCl and 15 mmol/l glucose as indicated. Values are means ± SE for 9–17 cells from four to ten experiments with three or four different islet preparations. CFP, cyan fluorescent protein
When the amplifying pathway was studied by increasing the glucose concentration from 3 to 15 mmol/l in the presence of 30 mmol/l KCl and diazoxide, a transient decrease in [Ca2+]SM occurred in most cells (9/13), followed by a return to prestimulatory values (Fig. 5f), and no cell showed an increase. Pretreatment with thapsigargin abrogated the initial decrease in 50% of cells (6/12) while [Ca2+]SM returned to prestimulatory values (0.934±0.005 vs 0.944±0.006, ns) in the majority of cells (8/12 cells) (Fig. 5 g). Only four cells showed a marginal [Ca2+]SM increase above baseline (2.2±0.3%) after the transient decrease. The detection of a thapsigargin-inhibitable transient drop in [Ca2+]SM by LynD3cpv is attributed to the close proximity of the endoplasmic reticulum to the plasma membrane [32, 33]. Control experiments further showed that the sustained elevation of [Ca2+]SM achieved under these conditions is entirely dependent on a continuous influx of extracellular Ca2+ (Fig. 5h) via L-type Ca2+ channels blocked by nimodipine (Fig. 5i), both at low and high glucose, i.e. when amplification of insulin secretion does not or does operate.
Finally, to test the hypothesis in the physiological preparation generally used to study the amplifying pathway, we specifically addressed LynD3cpv in beta cells within intact islets and measured [Ca2+]SM with TIRF microscopy. Compared with epifluorescence microscopy, our approach has the advantage of eliminating the fluorescence from out-of-focus planes (Fig. 6a), but the disadvantage of imaging only one to three cells over the surface of an islet. Again, small changes in [Ca2+]SM imposed by minor increases of the KCl concentration from 30 to 32 and 35 mmol/l induced clear changes of the fluorescence ratio in beta cells within islets (Fig. 6b), and raising the glucose concentration from 3 to 15 mmol/l induced characteristic triphasic changes of [Ca2+]SM in islet beta cells: a transient drop, followed by a large increase and oscillations (Fig. 6c,d). When the concentration of glucose was raised in the presence of 30 mmol/l KCl and diazoxide (conditions testing the amplifying pathway), [Ca2+]SM did not increase (Fig. 6e).
Fig. 6.
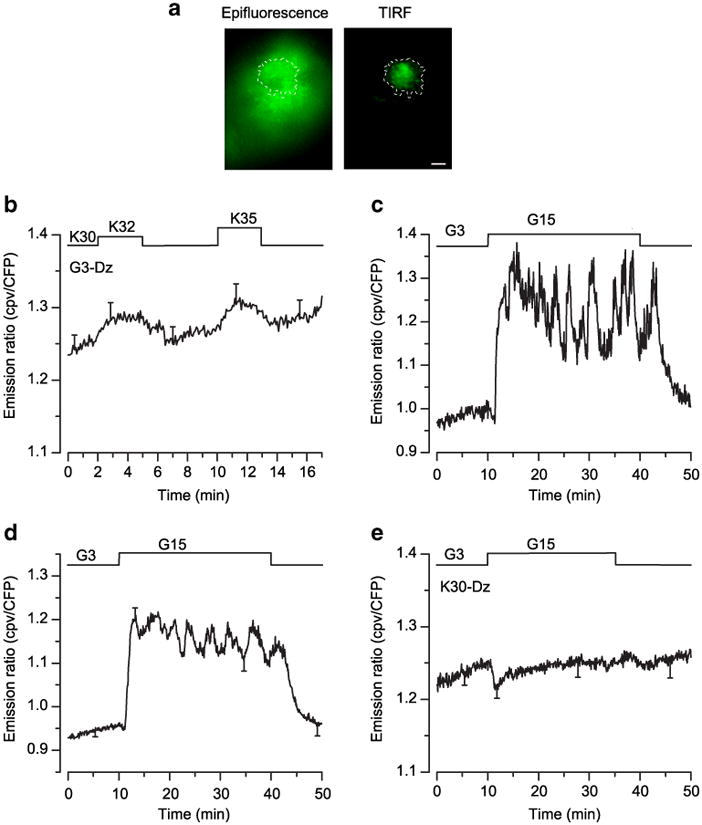
Effects of glucose and KCl on [Ca2+]SM measured by total internal reflection fluorescence (TIRF) microscopy in beta cells from intact islets expressing LynD3cpv. a Epifluorescence image (left panel) and TIRF picture (right panel) of the LynD3cpv probe. Scale bar, 5 μm. b KCl concentration was increased from 30 to 32 or 35 mmol/l. c, d The glucose concentration was increased from 3 to 15 mmol/l. e The glucose concentration was changed as in (c, d) during perifusion with 30 mmol/l KCl (K30)+250 μmol/l diazoxide (Dz). Values are representative trace (c) or means ± SE for 16– 19 cells from 7–12 experiments with four to seven different islet preparations (b, d, e). CFP, cyan fluorescent protein
Discussion
Glucose-induced insulin secretion by beta cells is mediated by a triggering pathway that leads to an indispensable elevation of [Ca2+]c via KATP channel-dependent depolarisation of the plasma membrane, and by an amplifying pathway that increases the exocytotic response [1, 7]. Here we show that this second effect of glucose does not involve a further increase of [Ca2+]SM in mouse beta cells. Our observations therefore support the proposal that this pathway is a true amplification of the action of Ca2+ rather than an increase in the triggering Ca2+ signal via a KATP channel-independent mechanism.
The method of [Ca2+]SM measurement
In several cell types, the TIRF technique has been used to measure [Ca2+]SM changes with classical Ca2+ probes (Kd 1–14 μmol/l) [34– 37]. To perform similar measurements in beta cells we initially tested several Ca2+ indicators with high (Fluo3, Fluo4, Calcium green 1) or low (Fluo-5N, Mag-Fluo4) affinities for Ca2+, but found it unreliable to employ a non-ratiometric probe to monitor small changes in [Ca2+ ]SM over long periods (M.A.R. and P.G. unpublished data). We therefore used the genetically encoded ratiometric Ca2+ indicator D3cpv, a cameleon protein that has been modified to suppress interactions with endogenous calmodulin [23] and that was used to detect Ca2+ changes evoked by single action potential in cortical neurons [38]. Although the in vitro Kd for Ca2+ of D3cpv (∼0.76 μmol/l) [23] is lower than the estimated [Ca2+]SM (2–20 μmol/l) [12, 15, 20, 21, 39], stepwise increases of KCl (30, 32, 35 or 100 mmol/l) clearly established that the probe was not saturated by the high [Ca2+]SM imposed by 30 mmol/l KCl. The reported in vitro Kd of the indicator [23] might be modified by the intracellular environment and be higher in vivo.
TIRF microscopy is better able to resolve event signals at or just beneath the plasma membrane than confocal microscopy because the technique restricts the fluorescence excitation to a thin section above the coverslip (∼65 nm thick in our experimental conditions, see ESM 1). A remote pitfall would be that localised increases of [Ca2+] beneath the plasma membrane still escaped detection because they occurred in an even thinner and confined region in the z-axis. We could refute this possibility by using another technique, in which the probe was targeted to the plasma membrane (LynD3cpv) [23], preferentially into cholesterol-rich membrane regions (membrane rafts) [30] where exocytotic proteins (such as SNAP-25 and syntaxin1A) and Cav1.2L-Type Ca2+ channels are concentrated in beta cells [3, 31]. Indeed, both approaches (D3cpv and LynD3cpv) yielded similar results.
In dispersed islet cells, adenoviral production of D3cpv was under control of the cytomegalovirus promoter. The probe was mainly produced in beta cells rather than non-beta cells, and the level of expression in alpha cells was too low for TIRF measurements. This preferential expression could be the result of a lower capacity of alpha cells to be infected by the adenovirus or that the cytomegalovirus is not a strong promoter in alpha cells. We are therefore confident that the cells that we imaged were beta cells, even more so because they all displayed the characteristic triphasic changes in [Ca2+] when stimulated by high glucose. Moreover, similar results were obtained when production of the probe was controlled by the rat insulin promoter and therefore was specific to beta cells.
Amplification of insulin secretion by glucose does not involve an increase in [Ca2+]SM
The ability of glucose and other metabolised secretagogues to increase insulin secretion by a mechanism that is distinct from their action on KATP channels has now been observed in many laboratories, using different preparations, including human islets [40, 41]. This property has most often been studied under conditions where KATP channels were held closed by a high concentration of sulfonylurea [42, 43] or held opened by diazoxide in the presence of KCl [4, 5]. Under these conditions, which stabilise [Ca2+]c at an elevated level, glucose is able to increase insulin secretion with no further increase in global [Ca2+]c (KCl+diazoxide) [4] or only a minor one (sulfonylureas) [43]. Comparisons of the spontaneous increases in [Ca2+]c and insulin secretion produced by various glucose concentrations in mouse islets [44] or dispersed islet cells [45] also indicate that Ca2+ is not the only signal produced by glucose to control the beta cell secretory response. Because this second pathway of glucose stimulation manifests itself only when [Ca2+]c is high, it would seem appropriate to define it as an amplification of the effect of the triggering Ca2+ signal on secretion [1]. Although the increase in insulin secretion produced by glucose during depolarisation with KCl does not involve an increase in global [Ca2+]c, the possibility that a local increase in [Ca2+] is occurring beneath the plasma membrane has not previously been addressed. If this were the case, the second pathway of glucose action would not be a true amplification but a further change in the triggering signal. The results of the present study refute this hypothesis. Therefore, in the presence of 30 mmol/l KCl + diazoxide, no transient or steady-state increase in [Ca2+]SM was observed in any of the tested cells whereas insulin secretion was doubled. Inhibition of Ca2+ uptake in the endoplasmic reticulum, by blockade of sarco(endo) plasmic reticulum Ca2+-ATPases with thapsigargin, attenuated the lowering of [Ca2+]SM that glucose produces in depolarised beta cells without unmasking an increase. That changes in Ca2+ uptake by the endoplasmic reticulum are detected during measurements of [Ca2+]SM is not surprising owing to the close contact between the plasma membrane and the endoplasmic reticulum [32, 33]. The thapsigargin-resistant component of the transient fall in [Ca2+]SM induced by 15 mmol/l glucose could reflect Ca2+ uptake by PMR1 [46] or in other organelles also in close proximity to the plasma membrane [47], but cannot be attributed to outward transport of Ca2+ across the plasma because no acceleration of 45Ca2+ efflux occurs under these conditions [4].
The D3cpv fluorescence appeared uneven beneath the plasma membrane when monitored at a single wavelength (Fig. 1e, middle), but this heterogeneity disappeared when the ratio of both emission wavelength (540/475 nm) was performed, indicating uneven distribution of the probe rather than spatial heterogeneity in [Ca2+]SM. Under conditions testing the amplifying pathway, no ‘hot spots’ of [Ca2+] were detected beneath the plasma membrane. Indeed, detection of ‘hot spots’ of [Ca2+] requires special tricks such as very fast image acquisition, abrupt depolarisation and restriction of Ca2+ diffusion by introduction of high concentrations of Ca2+ buffers intracellularly [17, 34, 35, 37]. By using these tricks, we could detect Ca2+ ‘hot spots’ during the initial response to high K+ (ESM Video clip, ESM Fig. S1), but [Ca2+]SM was diffusely high, and ‘hot spots’ of Ca2+ were already no longer visible after 20 s of depolarisation. None of these technical tricks could be used in our long experiments in which clusters of cells or islets were stably depolarised with 30 mmol/l KCl + diazoxide. It is noteworthy that, under these conditions, no action potentials occurred in either low or high glucose concentrations [4]. Even if we failed to detect glucose-induced increases in [Ca2+]SM because these were minimal, smaller or more localised than those elicited by a rise from 30 to 32 mmol/l KCl, it is not plausible that such tiny changes are sufficient to double the rate of insulin secretion. On the other hand, we do not exclude the possibility that ‘hot spots’ of [Ca2+]SM [34–37], occurring at the mouth of Ca2+ channels [12, 13, 15], play a role during glucose-induced electrical activity under control conditions.
In conclusion, the present results validate our proposal that glucose metabolism amplifies insulin secretion by an action that requires high [Ca2+]c but is independent of a further increase in [Ca2+]SM [1, 4, 7]. This is of major importance not only for our understanding of beta cell stimulus-secretion coupling, but also for the identification of the functional defects in beta cells from type 2 diabetic patients (and perhaps for the identification of novel drug targets). Other approaches using single beta cells with clamped [Ca2+]c have also established the existence of regulatory sites distal to the increase in the triggering Ca2+ signal [48–50]. Further studies should focus on the molecular and cellular mechanisms of this amplification that substantially contributes to glucose-induced insulin secretion [1].
Supplementary Material
Acknowledgments
This work was supported by the Fonds de la Recherche Scientifique in Brussels (grants FNRS 3.4530.08 and 3.4569.06), the Belgian Science Policy (PAI 6/40), the Direction de la Recherche Scientifique of the French Community of Belgium (ARC 05/10-328), and a research grant to M. A. Ravier from the ALFEDIAM (Paris). During this study, M. A. Ravier was ‘Chargée de Recherches’ of the FNRS, Brussels and, from March 2009, CR1 of the INSERM, Paris. P. G. Gilon is ‘Directeur de Recherches’ of the FNRS, Brussels. We thank J. Carpent, F. Knockaert and L. Roma for technical assistance. We are grateful to H. Ishihara and P. L. Herrera for the gift of the Rip-Cre adenovirus and pBS302 plasmid, respectively, and to I. Parker for advice related to the detection of ‘hot spots’ of Ca2+.
Abbreviations
- [Ca2+]c
Cytosolic free Ca2+ concentration
- [Ca2+]SM
Subplasmalemmal [Ca2+]
- D3cpv
Design 3 with circular permuted venus
- KATP
ATP-sensitive potassium
- TIRF
Total internal reflection fluorescence
Footnotes
Electronic supplementary material The online version of this article (doi:10.1007/s00125-010-1775-z) contains supplementary material, which is available to authorised users.
Duality of interest The authors declare that there is no duality of interest associated with this manuscript.
Contributor Information
M. A. Ravier, Unit of Endocrinology and Metabolism, University of Louvain Faculty of Medicine, UCL 55.30, 1200 Brussels, Belgium
R. Cheng-Xue, Unit of Endocrinology and Metabolism, University of Louvain Faculty of Medicine, UCL 55.30, 1200 Brussels, Belgium
A. E. Palmer, Department of Chemistry and Biochemistry, University of Colorado, Boulder, CO, USA
J. C. Henquin, Unit of Endocrinology and Metabolism, University of Louvain Faculty of Medicine, UCL 55.30, 1200 Brussels, Belgium
P. Gilon, Email: Patrick.gilon@uclouvain.be, Unit of Endocrinology and Metabolism, University of Louvain Faculty of Medicine, UCL 55.30, 1200 Brussels, Belgium.
References
- 1.Henquin JC. Regulation of insulin secretion: a matter of phase control and amplitude modulation. Diabetologia. 2009;52:739–751. doi: 10.1007/s00125-009-1314-y. [DOI] [PubMed] [Google Scholar]
- 2.Hiriart M, Aguilar-Bryan L. Channel regulation of glucose sensing in the pancreatic beta-cell. Am J Physiol Endocrinol Metab. 2008;295:E1298–E1306. doi: 10.1152/ajpendo.90493.2008. [DOI] [PubMed] [Google Scholar]
- 3.Eliasson L, Abdulkader F, Braun M, Galvanovskis J, Hoppa MB, Rorsman P. Novel aspects of the molecular mechanisms controlling insulin secretion. J Physiol. 2008;586:3313–3324. doi: 10.1113/jphysiol.2008.155317. [DOI] [PMC free article] [PubMed] [Google Scholar]
- 4.Gembal M, Gilon P, Henquin JC. Evidence that glucose can control insulin release independently from its action on ATP-sensitive K+ channels in mouse B cells. J Clin Invest. 1992;89:1288–1295. doi: 10.1172/JCI115714. [DOI] [PMC free article] [PubMed] [Google Scholar]
- 5.Sato Y, Aizawa T, Komatsu M, Okada N, Yamada T. Dual functional role of membrane depolarization/Ca2+ influx in rat pancreatic B cell. Diabetes. 1992;41:438–443. doi: 10.2337/diab.41.4.438. [DOI] [PubMed] [Google Scholar]
- 6.Straub SG, Sharp GW. Glucose-stimulated signaling pathways in biphasic insulin secretion. Diabetes/Metab Res Rev. 2002;18:451–463. doi: 10.1002/dmrr.329. [DOI] [PubMed] [Google Scholar]
- 7.Henquin JC, Ravier MA, Nenquin M, Jonas JC, Gilon P. Hierarchy of the beta-cell signals controlling insulin secretion. Eur J Clin Invest. 2003;33:742–750. doi: 10.1046/j.1365-2362.2003.01207.x. [DOI] [PubMed] [Google Scholar]
- 8.Smith PA, Rorsman P, Ashcroft FM. Modulation of dihydropyridine-sensitive Ca2+ channels by glucose metabolism in mouse pancreatic beta-cells. Nature. 1989;342:550–553. doi: 10.1038/342550a0. [DOI] [PubMed] [Google Scholar]
- 9.Kato S, Ishida H, Tsuura Y, et al. Alterations in basal and glucose-stimulated voltage-dependent Ca2+ channel activities in pancreatic beta cells of non-insulin-dependent diabetes mellitus GK rats. J Clin Invest. 1996;97:2417–2425. doi: 10.1172/JCI118688. [DOI] [PMC free article] [PubMed] [Google Scholar]
- 10.Fridlyand LE, Tamarina N, Philipson LH. Modeling of Ca2+ flux in pancreatic beta-cells: role of the plasma membrane and intracellular stores. Am J Physiol Endocrinol Metab. 2003;285:E138–E154. doi: 10.1152/ajpendo.00194.2002. [DOI] [PubMed] [Google Scholar]
- 11.Ximenes HM, Kamagate A, Van Eylen F, Carpinelli A, Herchuelz A. Opposite effects of glucose on plasma membrane Ca2+-ATPase and Na/Ca exchanger transcription, expression, and activity in rat pancreatic beta-cells. J Biol Chem. 2003;278:22956–22963. doi: 10.1074/jbc.M212339200. [DOI] [PubMed] [Google Scholar]
- 12.Bokvist K, Eliasson L, Ammala C, Renstrom E, Rorsman P. Co-localization of L-type Ca2+ channels and insulin-containing secretory granules and its significance for the initiation of exocytosis in mouse pancreatic B cells. EMBO J. 1995;14:50–57. doi: 10.1002/j.1460-2075.1995.tb06974.x. [DOI] [PMC free article] [PubMed] [Google Scholar]
- 13.Wiser O, Trus M, Hernandez A, et al. The voltage sensitive Lc-type Ca2+ channel is functionally coupled to the exocytotic machinery. Proc Natl Acad Sci U S A. 1999;96:248–253. doi: 10.1073/pnas.96.1.248. [DOI] [PMC free article] [PubMed] [Google Scholar]
- 14.Satin LS. Localized calcium influx in pancreatic beta-cells: its significance for Ca2+-dependent insulin secretion from the islets of Langerhans. Endocr. 2000;13:251–262. doi: 10.1385/ENDO:13:3:251. [DOI] [PubMed] [Google Scholar]
- 15.Barg S, Ma X, Eliasson L, et al. Fast exocytosis with few Ca(2+) channels in insulin-secreting mouse pancreatic B cells. Biophys J. 2001;81:3308–3323. doi: 10.1016/S0006-3495(01)75964-4. [DOI] [PMC free article] [PubMed] [Google Scholar]
- 16.Rutter GA, Tsuboi T, Ravier MA. Ca2+ microdomains and the control of insulin secretion. Cell Calcium. 2006;40:539–551. doi: 10.1016/j.ceca.2006.08.015. [DOI] [PubMed] [Google Scholar]
- 17.Hoppa MB, Collins S, Ramracheya R, et al. Chronic palmitate exposure inhibits insulin secretion by dissociation of Ca2+ channels from secretory granules. Cell Metab. 2009;10:455–465. doi: 10.1016/j.cmet.2009.09.011. [DOI] [PMC free article] [PubMed] [Google Scholar]
- 18.Rorsman P, Renstrom E. Insulin granule dynamics in pancreatic beta cells. Diabetologia. 2003;46:1029–1045. doi: 10.1007/s00125-003-1153-1. [DOI] [PubMed] [Google Scholar]
- 19.Theler JM, Mollard P, Guerineau N, et al. Video imaging of cytosolic Ca2+ in pancreatic beta-cells stimulated by glucose, carbachol, and ATP. J Biol Chem. 1992;267:18110–18117. [PubMed] [Google Scholar]
- 20.Quesada I, Martin F, Soria B. Nutrient modulation of polarized and sustained submembrane Ca2+ microgradients in mouse pancreatic islet cells. J Physiol. 2000;525(Pt 1):159–167. doi: 10.1111/j.1469-7793.2000.t01-1-00159.x. [DOI] [PMC free article] [PubMed] [Google Scholar]
- 21.Pinton P, Tsuboi T, Ainscow EK, Pozzan T, Rizzuto R, Rutter GA. Dynamics of glucose-induced membrane recruitment of protein kinase C beta II in living pancreatic islet beta-cells. J Biol Chem. 2002;277:37702–37710. doi: 10.1074/jbc.M204478200. [DOI] [PubMed] [Google Scholar]
- 22.Ohara-Imaizumi M, Aoyagi K, Nakamichi Y, Nishiwaki C, Sakurai T, Nagamatsu S. Pattern of rise in subplasma membrane Ca2+ concentration determines type of fusing insulin granules in pancreatic beta cells. Biochem Biophys Res Commun. 2009;385:291–295. doi: 10.1016/j.bbrc.2009.04.155. [DOI] [PubMed] [Google Scholar]
- 23.McCombs JE, Palmer AE. Measuring calcium dynamics in living cells with genetically encodable calcium indicators. Methods. 2008;46:152–159. doi: 10.1016/j.ymeth.2008.09.015. [DOI] [PMC free article] [PubMed] [Google Scholar]
- 24.Ravier MA, Tsuboi T, Rutter GA. Imaging a target of Ca2+ signalling: dense core granule exocytosis viewed by total internal reflection fluorescence microscopy. Methods. 2008;46:233–238. doi: 10.1016/j.ymeth.2008.09.016. [DOI] [PMC free article] [PubMed] [Google Scholar]
- 25.Ishihara H, Maechler P, Gjinovci A, Herrera PL, Wollheim CB. Islet beta-cell secretion determines glucagon release from neighbouring alpha-cells. Nat Cell Biol. 2003;5:330–335. doi: 10.1038/ncb951. [DOI] [PubMed] [Google Scholar]
- 26.Smith IF, Parker I. Imaging the quantal substructure of single IP3R channel activity during Ca2+ puffs in intact mammalian cells. Proc Natl Acad Sci U S A. 2009;106:6404–6409. doi: 10.1073/pnas.0810799106. [DOI] [PMC free article] [PubMed] [Google Scholar]
- 27.Gwiazda KS, Yang TL, Lin Y, Johnson JD. Effects of palmitate on ER and cytosolic Ca2+ homeostasis in beta-cells. Am J Physiol Endocrinol Metab. 2009;296:E690–E701. doi: 10.1152/ajpendo.90525.2008. [DOI] [PubMed] [Google Scholar]
- 28.Ravier MA, Nenquin M, Miki T, Seino S, Henquin JC. Glucose controls cytosolic Ca2+ and insulin secretion in mouse islets lacking adenosine triphosphate-sensitive K+ channels owing to a knockout of the pore-forming subunit Kir6.2. Endocrinology. 2009;150:33–45. doi: 10.1210/en.2008-0617. [DOI] [PubMed] [Google Scholar]
- 29.Gilon P, Henquin JC. Influence of membrane potential changes on cytoplasmic Ca2+ concentration in an electrically excitable cell, the insulin-secreting pancreatic B cell. J Biol Chem. 1992;267:20713–20720. [PubMed] [Google Scholar]
- 30.Zacharias DA, Violin JD, Newton AC, Tsien RY. Partitioning of lipid-modified monomeric GFPs into membrane microdomains of live cells. Science. 2002;296:913–916. doi: 10.1126/science.1068539. [DOI] [PubMed] [Google Scholar]
- 31.Xia F, Gao X, Kwan E, et al. Disruption of pancreatic beta-cell lipid rafts modifies Kv2.1 channel gating and insulin exocytosis. J Biol Chem. 2004;279:24685–24691. doi: 10.1074/jbc.M314314200. [DOI] [PubMed] [Google Scholar]
- 32.Orci L, Ravazzola M, Le Coadic M, Shen WW, Demaurex N, Cosson P. From the cover: STIM1-induced precortical and cortical subdomains of the endoplasmic reticulum. Proc Natl Acad Sci U S A. 2009;106:19358–19362. doi: 10.1073/pnas.0911280106. [DOI] [PMC free article] [PubMed] [Google Scholar]
- 33.Tamarina NA, Kuznetsov A, Philipson LH. Reversible translocation of EYFP-tagged STIM1 is coupled to calcium influx in insulin secreting beta-cells. Cell Calcium. 2008;44:533–544. doi: 10.1016/j.ceca.2008.03.007. [DOI] [PubMed] [Google Scholar]
- 34.Beaumont V, Llobet A, Lagnado L. Expansion of calcium microdomains regulates fast exocytosis at a ribbon synapse. Proc Natl Acad Sci U S A. 2005;102:10700–10705. doi: 10.1073/pnas.0501961102. [DOI] [PMC free article] [PubMed] [Google Scholar]
- 35.Demuro A, Parker I. “Optical patch-clamping”: single-channel recording by imaging Ca2+ flux through individual muscle acetylcholine receptor channels. J Gen Physiol. 2005;126:179–192. doi: 10.1085/jgp.200509331. [DOI] [PMC free article] [PubMed] [Google Scholar]
- 36.Serulle Y, Sugimori M, Llinas RR. Imaging synaptosomal calcium concentration microdomains and vesicle fusion by using total internal reflection fluorescent microscopy. Proc Natl Acad Sci U S A. 2007;104:1697–1702. doi: 10.1073/pnas.0610741104. [DOI] [PMC free article] [PubMed] [Google Scholar]
- 37.Becherer U, Moser T, Stuhmer W, Oheim M. Calcium regulates exocytosis at the level of single vesicles. Nat Neurosci. 2003;6:846–853. doi: 10.1038/nn1087. [DOI] [PubMed] [Google Scholar]
- 38.Wallace DJ, Borgloh SM, Astori S, et al. Single-spike detection in vitro and in vivo with a genetic Ca2+ sensor. Nat Meth. 2008;5:797–804. doi: 10.1038/nmeth.1242. [DOI] [PubMed] [Google Scholar]
- 39.Takahashi N, Kadowaki T, Yazaki Y, Miyashita Y, Kasai H. Multiple exocytotic pathways in pancreatic beta cells. J Cell Biol. 1997;138:55–64. doi: 10.1083/jcb.138.1.55. [DOI] [PMC free article] [PubMed] [Google Scholar]
- 40.Straub SG, James RF, Dunne MJ, Sharp GW. Glucose activates both K(ATP) channel-dependent and K(ATP) channel-independent signaling pathways in human islets. Diabetes. 1998;47:758–763. doi: 10.2337/diabetes.47.5.758. [DOI] [PubMed] [Google Scholar]
- 41.Henquin JC, Dufrane D, Nenquin M. Nutrient control of insulin secretion in isolated normal human islets. Diabetes. 2006;55:3470–3477. doi: 10.2337/db06-0868. [DOI] [PubMed] [Google Scholar]
- 42.Panten U, Schwanstecher M, Wallasch A, Lenzen S. Glucose both inhibits and stimulates insulin secretion from isolated pancreatic islets exposed to maximally effective concentrations of sulfonylureas. Naunyn Schmiedebergs Arch Pharmacol. 1988;338:459–462. doi: 10.1007/BF00172128. [DOI] [PubMed] [Google Scholar]
- 43.Sato Y, Anello M, Henquin JC. Glucose regulation of insulin secretion independent of the opening or closure of adenosine triphosphate-sensitive K+ channels in beta cells. Endocrinology. 1999;140:2252–2257. doi: 10.1210/endo.140.5.6729. [DOI] [PubMed] [Google Scholar]
- 44.Henquin JC, Nenquin M, Stiernet P, Ahren B. In vivo and in vitro glucose-induced biphasic insulin secretion in the mouse: pattern and role of cytoplasmic Ca2+ and amplification signals in beta-cells. Diabetes. 2006;55:441–451. doi: 10.2337/diabetes.55.02.06.db05-1051. [DOI] [PubMed] [Google Scholar]
- 45.Heart E, Corkey RF, Wikstrom JD, Shirihai OS, Corkey BE. Glucose-dependent increase in mitochondrial membrane potential, but not cytoplasmic calcium, correlates with insulin secretion in single islet cells. Am J Physiol Endocrinol Metab. 2006;290:E143–E148. doi: 10.1152/ajpendo.00216.2005. [DOI] [PubMed] [Google Scholar]
- 46.Mitchell KJ, Tsuboi T, Rutter GA. Role for plasma membrane-related Ca2+-ATPase-1 (ATP2C1) in pancreatic beta-cell Ca2+ homeostasis revealed by RNA silencing. Diabetes. 2004;53:393–400. doi: 10.2337/diabetes.53.2.393. [DOI] [PubMed] [Google Scholar]
- 47.Kennedy HJ, Pouli AE, Ainscow EK, Jouaville LS, Rizzuto R, Rutter GA. Glucose generates sub-plasma membrane ATP microdomains in single islet beta-cells. Potential role for strategically located mitochondria. J Biol Chem. 1999;274:13281–13291. doi: 10.1074/jbc.274.19.13281. [DOI] [PubMed] [Google Scholar]
- 48.Eliasson L, Renstrom E, Ding WG, Proks P, Rorsman P. Rapid ATP-dependent priming of secretory granules precedes Ca2+-induced exocytosis in mouse pancreatic B cells. J Physiol. 1997;503(Pt 2):399–412. doi: 10.1111/j.1469-7793.1997.399bh.x. [DOI] [PMC free article] [PubMed] [Google Scholar]
- 49.Takahashi N, Kadowaki T, Yazaki Y, Ellis-Davies GC, Miyashita Y, Kasai H. Post-priming actions of ATP on Ca2+-dependent exocytosis in pancreatic beta cells. Proc Natl Acad Sci U S A. 1999;96:760–765. doi: 10.1073/pnas.96.2.760. [DOI] [PMC free article] [PubMed] [Google Scholar]
- 50.Ivarsson R, Quintens R, Dejonghe S, et al. Redox control of exocytosis: regulatory role of NADPH, thioredoxin, and glutaredoxin. Diabetes. 2005;54:2132–2142. doi: 10.2337/diabetes.54.7.2132. [DOI] [PubMed] [Google Scholar]
Associated Data
This section collects any data citations, data availability statements, or supplementary materials included in this article.