Abstract
The feasibility of high resolution sodium MRI on human brain at 7T was demonstrated in this study. A three-dimensional anisotropic resolution data acquisition was used to address the challenge of low SNR associated with high resolution. Ultrashort echo time sequence was employed for the anisotropic data acquisition. Phantoms and healthy human brains were studied on a whole-body 7T MRI scanner. Sodium images were obtained at two high nominal in-plane resolutions (1.72 and 0.86 mm) at slice thickness 4 mm. SNR in the brain image (cerebrospinal fluid) was measured as 14.4 and 6.8 at the two high resolutions, respectively. The actual in-plane resolution was measured as 2.9 and 1.6 mm, 69–86% larger than their nominal values. The quantification of sodium concentration on the phantom and brain images enabled better accuracy at the high nominal resolutions than at the low nominal resolution 3.44 mm (measured resolution 5.5 mm) due to the improvement of in-plane resolution.
Keywords: sodium MRI, high resolution, whole-body 7T MRI, sodium quantification, sodium signal-to-noise ratio
INTRODUCTION
Sodium (23Na) magnetic resonance imaging (MRI) has the potential to quantify sodium concentration in tissue in a noninvasive way. Quantified tissue sodium concentration (TSC) is helpful to the evaluation of cell abnormalities and viability during development of a disease and/or cellular damage such as tumor (1, 2), stroke (3, 4), mental disorder (5, 6), and myocardial infarction (7, 8). Sodium imaging at 1.5 or 3 T is usually used to assess regional changes of TSC due to the available spatial resolution limited (>3.5mm). This limitation substantially undervalues the sensitivity of TSC to small lesions or inhomogeneous lesions such as treated tumors with partial response to radio-, chemo- or other testing therapies (9). Low resolution averages local variations over a large lesion and underestimates TSC value in part of a lesion. High resolution has ability to reduce the smoothing (partial volume) effect and uncover local variations.
Low resolution used in current sodium imaging is a technical trade-off for better signal-to-noise ratio (SNR) because MR signal intensity is proportional to the volume of a voxel (10). Extensive efforts have been made for improving SNR, such as ultrashort echo time (UTE) for data acquisition (11–13) and uniform sampling in the k-space for minimizing noise transfer from the k-space into image domain (14–19). These efforts have led to an increase of SNR by 10–40 % over regular radial acquisitions. This substantial improvement is still not sufficient for the pursuit of high resolution sodium imaging.
The 7-T field has potential to double SNR over that of the 3 T. This encourages sodium imaging at high resolutions. However, an increase in resolution by a factor of two leads to a decrease in SNR by a factor of eight in three-dimensional (3D) isotropic imaging (an imaging scheme that is usually used in sodium imaging). This substantially limits room to increase resolution with a doubled SNR.
This study used an approach different from isotropic 3D imaging, which explores anisotropic resolutions but does not sacrifice signals from fast T2 relaxations by performing UTE data acquisitions (20). The in-plane resolution is defined independently from the resolution in the slice direction (i.e., slice thickness) and can be increased without changing slice thickness. In this way the SNR loss associated with high resolutions is not only reduced but also compensated for by the slice thickness that is usually much larger than the in-plane resolution. A customized sequence was employed to implement the proposed anisotropic imaging. The technical feasibility was tested on phantoms and healthy human brains on a whole-body 7T MRI scanner. The impacts of high resolution imaging on SNR, actual resolution and TSC quantification were quantitatively evaluated based on the sodium images obtained.
METHODS AND MATERIALS
Pulse sequence
A customized sequence, AWSOS (acquisition-weighted stack of spirals) (20), was used in this study for data acquisition. This sequence performs fast 3D imaging at ultrashort echo time and samples the k-space in a cylindrical volume, allowing defining in-plane resolution independently from slice thickness. A detailed description about the AWSOS sequence was given in Reference 20. Image reconstruction on the AWSOS raw data was carried out by Fourier transformation in the slice direction, followed by a 2D double-sized gridding in individual slices (20, 21). A 3D Hann window was applied to the raw data to reduce random noise at high spatial frequencies (22).
Resolution phantom and human subjects
A laboratory-built cylindrical phantom (165mm diameter × 150mm length, aqueous NaCl solution of concentration 154 mM, T1=37ms and T2*=25ms at 7T) was used. Inside the phantom are plastic rods of diameters 2, 4, 6, 10 and 12 mm and arranged in five rows. Five healthy adult human subjects (male, age 20–48 years) were recruited in this study under an approved Institutional Review Board (IRB) protocol. The consent forms were signed by the subjects.
MRI scans
Sodium imaging was performed on a whole-body 7T MRI scanner of 40mT/m gradient amplitude and 170mT/m/ms slew rate (Magnetom 7T MRI, Siemens Medical Solutions, Erlangen, Germany), with a single-tuned volume head coil (Advanced Imaging Research, Cleveland, OH, USA). An 8-channel head array proton coil (Rapid Biomedical GmbH, Rimpar, Germany) was used for B0 shimming. A plastic base was shared by the proton and sodium coils to keep subject’s head still during the coil switching (shim might still change slightly due to the different size and shape of the coils). For comparison, sodium imaging was also implemented on a whole-body 3T MRI scanner (Magnetom Trio Tim, Siemens) with the same gradient system as on the 7T scanner. A dual-tuned (1H-23Na) volume head coil (Advanced Imaging Research) was used at 3 T. For the phantom scans data acquisition parameters were: rectangular RF pulse of 0.8ms duration, flip angle=90°, field of view (FOV) = 220mm, matrix size (N) = 128/256 (nominal resolution 1.72/0.86mm), spiral readout Ts=5.60/10.24ms, slices=40 at slice thickness 5 mm, TE/TR=0.5/100ms, averages=4, and total acquisition time TA=8.5/17min. The echo time (TE) was a time period between the center of RF pulse and the starting of data acquisition at the k-space center. For the human scans the parameters were: rectangular RF pulse of 0.8ms duration [minimum duration available under specific absorption rate (SAR) restriction], flip angle=90°, FOV=220mm, matrix size (N) =64/128/256 (nominal resolution=3.44/1.72/0.86mm), slices=60 at slice thickness of 4mm, TE/TR =0.5/100ms, Ts=3.36/5.76/10.72ms, averages=5 and TA=8/16/32min. The scans at 3T had exactly the same acquisition parameters as at 7T. To define regions of interest in the white and gray matters, T1-weighted proton images were acquired on the 7T scanner with the magnetization-prepared rapid gradient echo (MPRAGE) sequence under parameters FOV=192× 220 mm2, matrix size=215×256, slice thickness=0.9mm, and TE/TR/TI = 3.5/3500/900ms.
Measurement of spatial resolution
The in-plane spatial resolution was measured directly on the acquired sodium images. A large, known structure of sharp edge inside the phantom or brain was selected, such as a large rod in the phantom or a lateral ventricle in the brain. A sharp edge constitutes a step function that allows the measurement of spatial resolution through the signal profile across a high contrast border. The width d of the signal profile at its half way down to the bottom is an estimate of the full width at half maximum (FWHM) of a symmetric point spread function (PSF) (10). The measured resolution is a comprehensive outcome of all the factors acting on the imaging including T2* decay, B0 field inhomogeneity and windowing (i.e., k-space filtering) during image reconstruction, in addition to the scheme of k-space sampling.
Quantification of sodium concentration
Sodium concentration C was measured via linear calibration based on signal intensity I at a pixel:
| Eq. [1] |
Two regions with known sodium concentration were chosen to determine the coefficients αand β. In the phantom experiments one region was chosen in the solution of sodium concentration 154mM, while the other region was inside a large rod of sodium concentration 0mM. To minimize the effects of noise and artifacts on the calibration, four uniform signal regions and two noise-only regions were selected. In the human experiments, the calibration was implemented with the knowledge of sodium concentrations in CSF (145mM, Ref. 23) and background (0mM). The right lateral ventricle and four noise-only background regions were selected for the calibration. Signal intensity in CSF was corrected with a factor of 1/[1-exp(-TR/T1)] with T1=50ms to account for T1-related signal saturation. The calibration was performed for each of the resolutions individually.
Measurement of SNR
As single-channel sodium coil was used in this study signal-to-noise ratio was measured directly on magnitude images. Based on Henkelman’s work (24), SNR at low levels can be calculated through the following equations:
| Eq. [2] |
| Eq. [3] |
| Eq. [4] |
with MAVG is the mean of the magnitude image intensity in a signal region of interest (ROI) and MAVG(0) is the mean of the magnitude image in a noise-only (A=0) background region outside the object. Mean signal amplitude A in the signal ROI was calculated via Eq. [3] using MAVG. Noise standard deviation σ in the real or imaginary part of the original complex image was calculated via Eq. [4] using MAVG(0) (10, 24). To minimize regional bias, MAVG(0) was averaged over four background noise regions.
RESULTS
Imaging on phantom
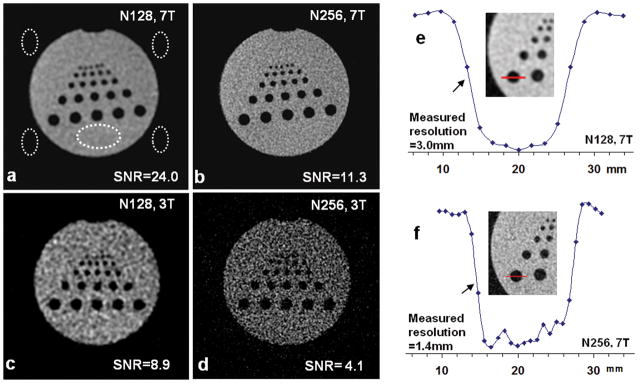
High resolution sodium images of the phantom were achieved at 7 T at nominal in-plane resolutions of 1.72 and 0.86 mm respectively (Figs. 1a–d). The small rods (2mm diameter) on the top row are visually recognizable in Fig. 1a and more clearly in Fig. 1b at higher resolution. The measured SNR is 24.0 at the nominal resolution 1.72 mm (Fig. 1a) and 11.3 at resolution 0.86 mm (Fig. 1b), decreasing 53% due to the increase of resolution. For comparison, SNR at 3 T at these resolutions was substantially reduced (>63%) relative to SNR at 7 T (Figs. 1c, d). This indicates that the possibility of performing high resolution sodium imaging is low at 3 T.
Fig. 1.
(a–d) High resolution sodium images of a phantom at 7T at nominal resolutions of (a) 1.72mm (N128) and (b) 0.86mm (N256), compared with those (c, d) at 3T with the same acquisition parameters but different type of coils (single-tuned 23Na at 7T and dual-tuned 1H-23Na at 3T). The dashed ellipses are the regions for SNR measurement (one signal and four noise-only regions). SNR at 7 T was increased by a factor of 2.7 over 3T. (e–f) Resolution measurement at 7 T at two resolutions of N128 (e) and N256 (f). The intensity profiles in arbitrary unit were from the pixels (dots) on the line segments across a large rod (12mm diameter) in the inset images. The resolution was measured on the left side (arrows) and was 3.0 and 1.4 mm respectively, 63–75 % larger than their nominal values.
Actual in-plane resolution was measured on the sodium images and it is 3.0±0.9 mm for the nominal resolution 1.72 mm and 1.4±0.4 mm for nominal resolution 0.86 mm (Figs. 1e, f), 63–75 % larger than their nominal values.
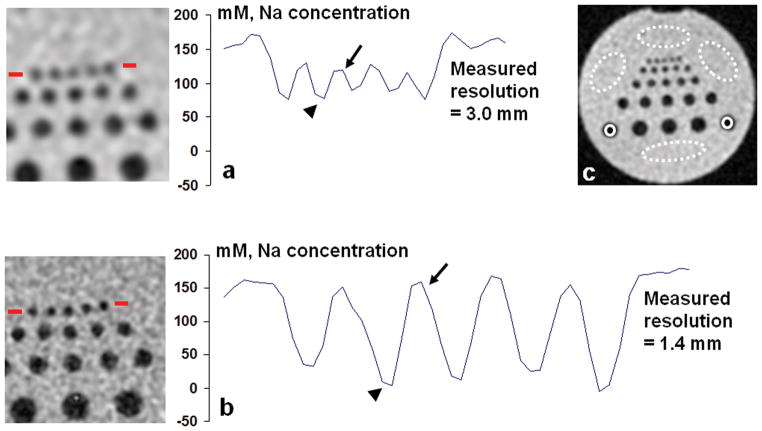
Sodium concentration in the phantom was quantified based on the sodium images. The impact of spatial resolution on the accuracy of sodium quantification is demonstrated through the image intensity profiles across the small rods of diameter 2 mm (Fig. 2). When actual resolution was lower than the rod diameter (Fig. 2a), the measured sodium concentration in the solution was 120.9 mM, about 22% lower than its true value 154 mM. On the other hand, the measured concentration in the rod region was 86.2mM, far away from its true value 0mM. The contrast of sodium concentration between these two regions was therefore reduced to 23% of its true contrast (154mM). When actual resolution was improved (Fig. 2b), the measured sodium concentration was 155.5mM for the solution and 16.5mM for the rod region, very close to their true values. Concentration contrast between the two regions was recovered to 90% of its true value, showing four-fold better than that in the lower resolution in the Fig. 2a.
Fig. 2.
Quantification of sodium concentration on the images of a resolution phantom at 7T at actual resolutions of (a) 3.0 mm and (b) 1.4 mm. The regions for calibration were shown in (c): four signal regions (dashed ellipses) and two noise-only regions (solid circles). A profile of the quantified sodium concentration across the row of small rods (2mm diameter) as shown in the left image was plotted for both resolutions. The high resolution (b) produced values for the solution (arrow) and rod (arrow head) regions with much smaller errors than the low resolution (a).
Imaging on human brain
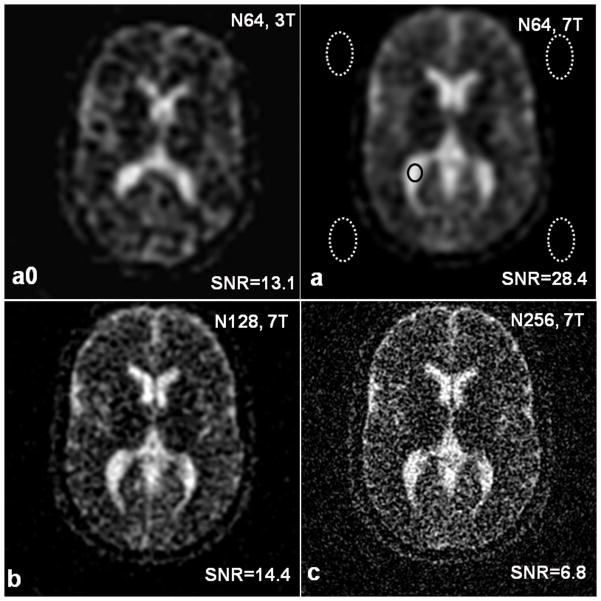
High resolution sodium images of the healthy human brains were obtained at 7T and representative images were demonstrated in Figure 3. The structures in the brain became clear as nominal spatial resolution was increasing from low (3.44mm) to high (0.86mm) (Figs. 3a–c). The measured SNR in cerebrospinal fluid was 14.4 and 6.8 in the sodium images at the two high resolutions (Figs. 3b, c), respectively. The 7-T field contributed to the improvement of SNR by a factor of 2.2 as compared to the 3 T (Figs. 3a, a0).
Fig. 3.
Sodium images of a healthy human brain at 7T at nominal resolutions of (a) 3.44mm (N64), (b) 1.72mm (N128) and (c) 0.86mm (N256), compared with the image at 3T (a0). The ellipses in (a) are the regions for SNR measurement (one signal and four noise-only regions).SNR was increased by a factor of 2.2 from 3T to 7T (a0, a). As expected, the higher resolutions showed brain structures sharper than the low resolution.
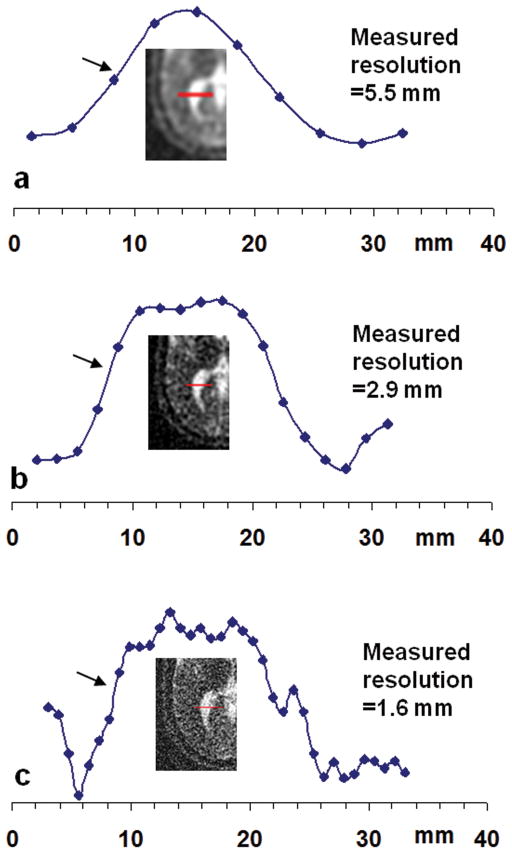
The actual spatial resolution in the sodium images was measured at the edge of the right lateral ventricle (Fig. 4). The measured resolutions were 5.5±1.7, 2.9±0.9 and 1.6±0.4 mm at nominal resolutions of 3.44, 1.72 and 0.86 mm, respectively. These measured resolutions were 60–86 % larger than their nominal values.
Fig. 4.
Resolution measurement on the sodium images of a healthy human brain at 7T at nominal resolutions of (a) 3.44mm, (b) 1.72mm, and (c) 0.86mm. The plotted intensity profiles in arbitrary unit were from the pixels (dots) on the line segments across the right lateral ventricle as shown in the inset images. The resolutions were measured on the left side (arrows) and were 5.5, 2.9 and 1.6 mm, respectively, 60–86 % larger than their nominal values.
Quantification of tissue sodium concentration was achieved on the sodium images at the three resolutions investigated. The TSC maps of a representative slice are demonstrated in Fig. 5. Two regions of interest (one for white matter and one for gray matter) were selected in this subject through the T1-weighted proton image. In the white matter regions the three resolutions (N64, N128 and N256) yielded TSC values of 67.2±21.1, 39.7±3.8 and 37.4±2.9 mM (mean±SD) respectively. In the gray matter regions the three resolutions yielded 74.8±21.7, 53.4±9.6 and 47.1±6.7 mM. The mean values decreased as in-plane resolution was increased. At nominal resolution 0.86 mm, tissue sodium concentration in the white matter region (37.4mM) is slightly lower than in the gray matter region (47.1mM).
Fig. 5.
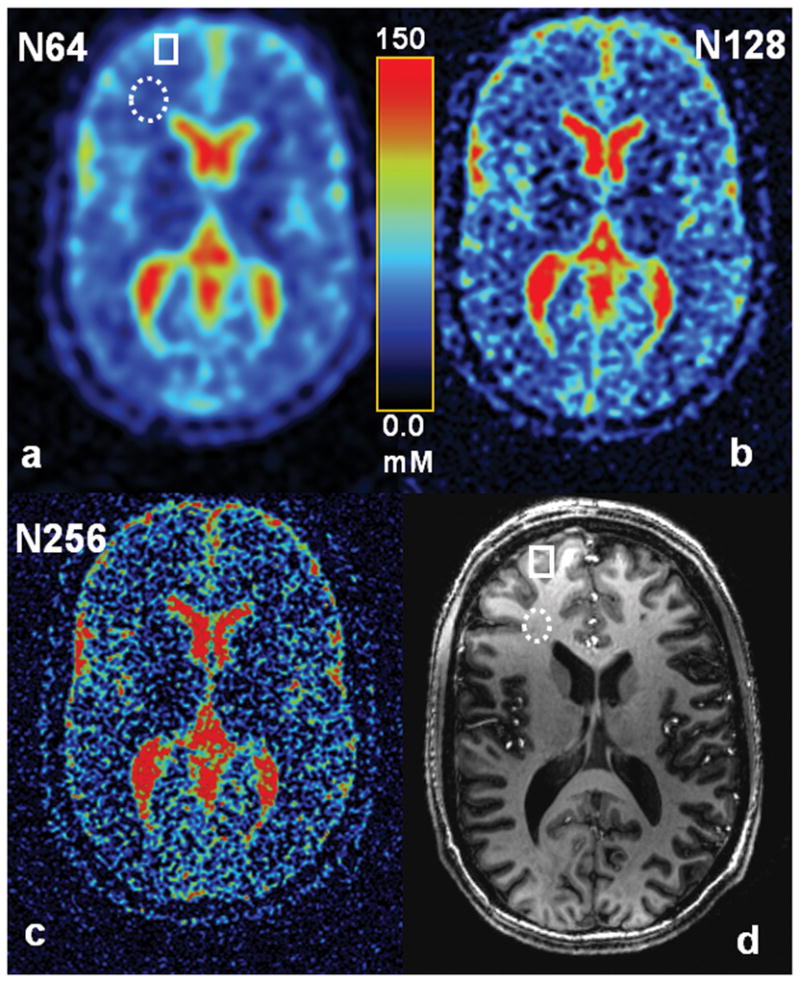
Tissue sodium concentration (TSC) maps of a healthy human brain at 7T at measured resolutions of (a) 5.5 mm (N64), (b) 2.9 mm (N128), and (c) 1.6 mm (N256). MPRAGE T1-weighted proton image at 7T (d) was used for identifying the white (dashed ellipses) and gray (solid rectangle) matter regions of interest in the sodium images as shown in (a, d). Two single-tuned coils (1H, 23Na) were employed in this examination.
DISCUSSION
High in-plane resolution in sodium imaging has been achieved in this study by means of higher B0 and anisotropic resolution. The 7-T field increased SNR by a factor of 2.2–2.7 over that of the 3 T (Figs. 1, 3), consistent with the values reported by other groups (25, 26). The anisotropic resolution imaging increased SNR by a factor of h/Δx, i.e., 1.16, 2.32 and 4.64 at nominal in-plane resolutions of Δx =3.44, 1.72 and 0.86 mm respectively, under a slice thickness of h =4 mm.
A large increase of SNR at 7 T over 3 T on the phantom (2.7 fold, Figs. 1a–d) was due in part to the different coil types used; single-tuned (23Na) at 7T but dual-tuned (1H-23Na) at 3T. Dual-tuned coils usually have lower efficiency in power transmission and signal receiving than their single-tuned counterparts. The low SNR shown on the phantom images at 3 T (Figs. 1c, d) is just a visual effect. If the nominal resolution in Fig. 1c is reduced from 1.72 mm to 3.44 mm, for example, SNR would be increased by a factor of 4.0 and be up to the level usually seen on the sodium images at a popular nominal resolution 3.44 mm.
The measured resolution on a sodium image was lower than corresponding nominal resolution (Figs. 1e–f, 4a–c). This difference resulted from the sampling volume in the k-space and windowing (i.e., k-space filtering) during image reconstruction. The in-plane spiral data acquisition was performed on a disk region, instead of a rectangular region as usually used in Cartesian data acquisitions, leading to 41% wider of point-spread function (PSF) in the spiral sampling than in Cartesian sampling (27, 28). A two-dimensional Hann window was applied to the spiral data for reducing noise at high-spatial frequencies, contributing additional ~30 % to the PSF widening (22). The measured resolution was also affected by the T2* relaxation during spiral readout. These factors together (not linearly adding up overlapped impacts) made resultant difference of 60–86 % between the measured and nominal resolutions. The slice thickness had little increase from its nominal value under the variable-duration slice encoding used in the AWSOS data acquisitions. The maximum duration of slice encoding was 0.65 ms at slice thickness 4mm, leading to 4% increase for a short T2 component of 3ms (based on 20% increase for a duration of one T2) (20). However, Hann window in the slice direction contributed about 30% increase to slice thickness.
Increasing in-plane resolution decreased the estimates of tissue sodium concentration in the white and gray matter regions (Fig. 5). This was caused by the reduced effect of CSF of high sodium concentration surrounding the regions of interest. Quantification at high resolution rendered better estimate of true tissue sodium concentration. In this study, these estimates are 37.4 and 47.1 mM for white and gray matters respectively, which are in between the values reported in literature (2, 6). The improvement of TSC quantification was however only in in-plane, but not improved in slice direction due to large thickness (4 mm) used. Partial volume effect across slices still exists with this technique when anatomic structures changed within a slice thickness.
Challenges to high resolution sodium imaging at 7T still exist. SNR at nominal resolutions of sub-millimeter, for instance, is currently as low as 6.8. More efforts are needed to at least double SNR. Phased array coils would be promising tools for SNR enhancement.
Transmit efficiency of a coil (i.e., large excitation output at low voltage input) is another challenge, more important to sodium imaging than to proton imaging due to the four times smaller gyromagnetic ratio of sodium nuclei. Low transmit efficiency requires high voltage input (or long RF pulse duration) for 90° flip angle, and as a result, long TR (>100ms) is usually needed to meet the safety restriction of specific absorption rate (SAR). Developing efficient coils is an immediate demand to further advance sodium imaging at 7T.
The B0 field shimming is also challenge to sodium imaging. Single-tuned coils have higher transmit and receive efficiency than dual-tuned coils (Fig. 1) but need separate proton coil for B0 field shimming at 7 T. Switching between proton and sodium coils inevitably degrades shimming performance. A potential solution to this problem is to perform B0 field shimming at sodium frequency, without aid of proton coil. This idea would be technically feasible because sodium imaging at 7T has sufficiently high SNR for shimming.
CONCLUSIONS
This study has demonstrated that sodium imaging on human brain at high in-plane nominal resolutions (1.72 and 0.86 mm) is feasible at 7 T. This achievement benefited from the multifold increase of SNR provided by ultra-high field at 7 T and large slice thickness (4mm) used in the anisotropic resolution data acquisition. The measured in-plane resolutions of the sodium image were 69–86 % larger than their nominal values due to the spiral data acquisition and noise-reduction filtering. The high nominal resolutions (1.72 and 0.86 mm) have enabled better accuracy in the quantification of sodium concentration due to the improvement of in-plane resolution. However, some technical challenges still remain and need to be addressed in future studies, such as further improvement of SNR for sodium imaging at sub-millimeter nominal resolutions (0.86 mm).
Acknowledgments
This work was supported in part by NIH R01 CA106840 and by the Department of Radiology Development Fund, University of Pittsburgh.
References
- 1.Thulborn KR, Davis D, Adams H, Gindin T, Zhou J. Quantitative tissue sodium concentration mapping of the growth of focal cerebral tumors with sodium magnetic resonance imaging. Magn Reson Med. 1999;41:351–359. doi: 10.1002/(sici)1522-2594(199902)41:2<351::aid-mrm20>3.0.co;2-h. [DOI] [PubMed] [Google Scholar]
- 2.Ouwerkerk R, Bleich KB, Gillen JS, Pomper MG, Bottomley PA. Tissue sodium concentration in human brain tumors as measured with 23Na MR imaging. Radiology. 2003;227:529–537. doi: 10.1148/radiol.2272020483. [DOI] [PubMed] [Google Scholar]
- 3.Thulborn KR, Davis D, Snyder J, Yonas H, Kassam A. Sodium MR imaging of acute and subacute stroke for assessment of tissue viability. Neuroimaging Clin N Am. 2005;15:639–53. doi: 10.1016/j.nic.2005.08.003. [DOI] [PubMed] [Google Scholar]
- 4.LaVerde GC, Jungreis CA, Nemoto E, Boada FE. Sodium time course using 23Na MRI in reversible focal brain ischemia in the monkey. J Magn Reson Imaging. 2009;30:219–23. doi: 10.1002/jmri.21723. [DOI] [PubMed] [Google Scholar]
- 5.Mellon EA, Pilkinton DT, Clark CM, Elliott MA, Witschey WR, 2nd, Borthakur A, Reddy R. Sodium MR imaging detection of mild Alzheimer disease: preliminary study. AJNR Am J Neuroradiol. 2009;30:978–84. doi: 10.3174/ajnr.A1495. [DOI] [PMC free article] [PubMed] [Google Scholar]
- 6.Inglese M, Madelin G, Oesingmann N, Babb JS, Wu W, Stoeckel B, Herbert J, Johnson G. Brain tissue sodium concentration in multiple sclerosis: a sodium imaging study at 3 tesla. Brain. 2010;133:847–57. doi: 10.1093/brain/awp334. [DOI] [PMC free article] [PubMed] [Google Scholar]
- 7.Constantinides CD, Kraitchman DL, O’Brien KO, Boada FE, Gillen J, Bottomley PA. Noninvasive quantification of total sodium concentrations in acute reperfused myocardial infarction using 23Na MRI. Magn Reson Med. 2001;46:1144–1151. doi: 10.1002/mrm.1311. [DOI] [PubMed] [Google Scholar]
- 8.Ouwerkerk R, Weiss RG, Bottomley PA. Measuring human cardiac tissue sodium concentrations using surface coils, adiabatic excitation, and twisted projection imaging with minimal T2 losses. J Magn Reson Imaging. 2005;21:546–555. doi: 10.1002/jmri.20322. [DOI] [PubMed] [Google Scholar]
- 9.Moffat BA, Chenevert TL, Lawrence TS, Meyer CR, Johnson TD, Dong Q, Tsien C, Mukherji S, Quint DJ, Gebarski SS, Robertson PL, Junck LR, Rehemtulla A, Ross BD. Functional diffusion map: A noninvasive MRI biomarker for early stratification of clinical brain tumor response. PNAS. 2005;102:5524–5529. doi: 10.1073/pnas.0501532102. [DOI] [PMC free article] [PubMed] [Google Scholar]
- 10.Haacke EM, Brown RW, Thompson MR, Venkatesan R. Magnetic resonance imaging-Physical principles and sequence design. New York: John Wiley & Sons, Inc; 1999. p. 914. [Google Scholar]
- 11.Hubbard PS. Nonexponential nuclear magnetic relaxation by quadrupole interactions. J Chem Phys. 1970;53:985–987. [Google Scholar]
- 12.Hull TE. Nuclear magnetic relaxation of spin-3/2 nuclei involved in chemical exchange. J Magn Reson. 1972;8:344–353. [Google Scholar]
- 13.Shinar H, Navon G. NMR relaxation studies of intracellular Na+ in red blood cells. Biophys Chem. 1984;20:275–283. doi: 10.1016/0301-4622(84)80018-6. [DOI] [PubMed] [Google Scholar]
- 14.Liang Z, lauterbur PC. Principles of magnetic resonance imaging. New York: IEEE Press; 2000. p. 416. [Google Scholar]
- 15.Boada FE, Gillen JS, Shen GX, Chang SY, Thulborn KR. Fast three dimensional sodium imaging. Magn Reson Med. 1997;37:706–715. doi: 10.1002/mrm.1910370512. [DOI] [PubMed] [Google Scholar]
- 16.Nagel AM, Laun FB, Weber MA, Matthies C, Semmler W, Schad LR. Sodium MRI using a density-adapted 3D radial acquisition technique. Magn Reson Med. 2009;62:1565–1573. doi: 10.1002/mrm.22157. [DOI] [PubMed] [Google Scholar]
- 17.Stobbe R, Beaulieu C. Sodium imaging optimization under specific absorption rate constraint. Magn Reson Med. 2008;59:345–355. doi: 10.1002/mrm.21468. [DOI] [PubMed] [Google Scholar]
- 18.Gurney PT, Hargreaves BA, Nishimura DG. Design and analysis of a practical 3D cones trajectory. Magn Reson Med. 2006;55:575–582. doi: 10.1002/mrm.20796. [DOI] [PubMed] [Google Scholar]
- 19.Lu A, Atkinson IC, Claiborne TC, Damen FC, Thulborn KR. Quantitative sodium imaging with a flexible twisted projection pulse sequence. Magn Reson Med. 2010;63:1583–1593. doi: 10.1002/mrm.22381. [DOI] [PMC free article] [PubMed] [Google Scholar]
- 20.Qian Y, Boada FE. Acquisition-weighted stack of spirals for fast high-resolution three-dimensional ultra-short echo time MR imaging. Magn Reson Med. 2008;60:135–145. doi: 10.1002/mrm.21620. [DOI] [PubMed] [Google Scholar]
- 21.Jackson JI, Meyer CH, Nishimura DG, Macovski A. Selection of a convolution function for Fourier inversion using gridding. IEEE Trans Med Imaging. 1991;MI-10:473–478. doi: 10.1109/42.97598. [DOI] [PubMed] [Google Scholar]
- 22.Enochson LD, Otnes RK. Programming and analysis for digital time series data. U.S. Dept. of Defense, Shock and Vibration Info. Center; 1969. p. 277. [Google Scholar]
- 23.Harrington MG, Salomon RM, Pogoda JM, Oborina E, Okey N, Johnson B, Schmidt D, Fonteh AN, Dalleska NF. Cerebrospinal fluid sodium rhythms. Cerebrospinal Fluid Res. 2010;7:3. doi: 10.1186/1743-8454-7-3. [DOI] [PMC free article] [PubMed] [Google Scholar]
- 24.Henkelman RM. Measurement of signal intensities in the presence of noise in MR images [Published erratum in Med Phys 1986; 13:544] Med Phys. 1985;12:232–233. doi: 10.1118/1.595711. [DOI] [PubMed] [Google Scholar]
- 25.Fleysher L, Oesingmann N, Stoeckel B, Grossman RI, Inglese M. Sodium long-component T2* mapping in human brain at 7 Tesla. Magn Reson Med. 2009;62:1338–1341. doi: 10.1002/mrm.22133. [DOI] [PMC free article] [PubMed] [Google Scholar]
- 26.Staroswiecki E, Bangerter NK, Gurney PT, Grafendorfer T, Gold GE, Hargreaves BA. In vivo sodium imaging of human patellar cartilage with a 3D cones sequence at 3 T and 7 T. J Magn Reson Imaging. 2010;32:446–451. doi: 10.1002/jmri.22191. [DOI] [PMC free article] [PubMed] [Google Scholar]
- 27.Mentrup D, Eggers H. Signal decay correction in 2D ultra-short echo time imaging. MAGMA. 2006;19:62–70. doi: 10.1007/s10334-006-0028-0. [DOI] [PubMed] [Google Scholar]
- 28.Qian Y, Zhao T, Hue YK, Ibrahim TS, Boada FE. High-resolution spiral imaging on a whole-body 7T scanner with minimized image blurring. Magn Reson Med. 2010;63:543–552. doi: 10.1002/mrm.22215. [DOI] [PMC free article] [PubMed] [Google Scholar]


