Abstract
Background
Previous work demonstrated that the transcription factor, early growth response-1 (Egr-1) participates in the development of steatosis (fatty liver) after chronic ethanol administration. Here, we determined the extent to which Egr-1 is involved in fatty liver development in mice subjected to acute ethanol administration.
Methods
In acute studies, we treated both wild type and Egr-1 null mice with either ethanol or phosphate-buffered saline (PBS) by gastric intubation. At various times after treatment, we harvested sera and livers and quantified endotoxin, indices of liver injury, steatosis, and hepatic Egr-1 content. In chronic studies, groups of mice were fed liquid diets containing either ethanol or isocaloric maltose-dextrin for 7-8 weeks.
Results
Compared with controls, acute ethanol-treated mice showed a rapid, transient elevation in serum endotoxin beginning 30 minutes after treatment. One hour post-gavage, livers from ethanol-treated mice exhibited a robust elevation of both Egr-1 mRNA and protein. By three hours post-gavage, liver triglyceride increased in ethanol-treated mice as did lipid peroxidation. Acute ethanol treatment of Egr-1-null mice showed no Egr-1 expression, but these animals still developed elevated triglycerides, although significantly lower than ethanol-fed wild-type littermates. Despite showing decreased fatty liver, ethanol-treated Egr-1 null mice exhibited greater liver injury. After chronic ethanol feeding, steatosis and liver enlargement were clearly evident, but there was no indication of elevated endotoxin. Egr-1 levels in ethanol-fed mice were equal to those of pair-fed controls.
Conclusions
Acute ethanol administration induced the synthesis of Egr-1 in mouse liver. However, despite its robust increase, the transcription factor had a smaller, albeit significant, function in steatosis development after acute ethanol treatment. We propose that the rise in Egr-1 after acute ethanol is an hepatoprotective adaptation to acute liver injury from binge drinking that is triggered by ethanol metabolism and elevated levels of endotoxin.
Keywords: alcoholic liver injury, fatty liver, oxidant stress, transcription factors, glutathione
INTRODUCTION
Steady heavy alcohol consumption causes development of fatty liver (steatosis) in 90 percent of problem drinkers (O’Shea et al.). Current evidence indicates that fatty liver, excess body fat or both enhance(s) liver disease progression. A recent prospective study demonstrated a five-fold increase in the risk for cirrhosis in women with a body mass index (BMI) of 30 or more and who use 150 grams of alcohol per week, compared with women with the same BMI who drink less than 70 grams ethanol per week (Liu et al., 2010). Animal experiments similarly reveal that liver damage that results from acute ethanol administration is more severe in obese than in lean rats (Carmiel-Haggai et al., 2003).
In humans, binge drinking is more common than chronic alcoholism, particularly among males in their late teens and early twenties (Mathurin and Deltenre, 2009; Waszkiewicz et al., 2009). Acute alcohol consumption is a growing health problem on U.S. college campuses (Wechsler et al., 1995a; Wechsler et al., 1995b). Growing evidence indicates that hepatic alterations that result from binge drinking proceed by mechanisms distinct from those after chronic ethanol consumption (Bardag-Gorce et al., 2009; Donohue et al., 1998).
Excess alcohol consumption causes fatty liver that arises in part from enhanced formation of NADH+ generated by ethanol and acetaldehyde oxidations (Lieber and DeCarli, 1991). The higher level of NADH+ inhibits fatty acid oxidation by mitochondria and provides more reduced coenzyme for fatty acid synthesis. Ethanol metabolism also accelerates the maturation of the transcriptionally active form of the sterol regulatory element binding protein 1c (SREBP-1c), which binds to promoter elements on genes encoding lipid biosynthetic enzymes, thereby enhancing fatty acid synthesis (Donohue, 2007; You and Crabb, 2004; You et al., 2002).
While it enhances lipogenesis, ethanol metabolism exacerbates fatty liver by decreasing the level of active peroxisome proliferator activated nuclear receptor-alpha (PPAR-α), which regulates expression of genes encoding enzymes of fatty acid oxidation (Donohue, 2007; Galli et al., 2001). There is compelling evidence that cytochrome P450 2E1 (CYP2E1), because it is induced by chronic ethanol consumption, generates greater amounts of reactive metabolites that contribute to PPAR-α suppression (Lu et al., 2008).
Early Growth Response-1 (Egr-1) is another key component in the development of ethanol-induced steatosis after long-term alcohol consumption (McMullen et al., 2005). In ethanol fed Egr-1 null mice, fatty liver is barely discernible and serum tumor necrosis factor-alpha (TNF-α) levels are unchanged. In contrast, ethanol-fed wild-type mice, exhibit robust fatty liver, and elevated serum TNF-α (McMullen et al., 2005). The exact mechanism(s) by which Egr-1 functions to promote steatosis is/are not entirely clear. The transcription factor binds to promoter sites on stress-related genes, including that encoding (TNF-α) (Yao et al., 1997). The latter finding is relevant, as TNF-α is considered lipogenic because it enhances the maturation of SREBP-1 (Lawler et al., 1998).
Hepatic injury induced by binge drinking is less well studied than that caused by chronic heavy drinking but still a significant health risk. Here, we sought to determine the involvement of Egr-1 in the development of fatty liver after acute ethanol administration to mice. We postulated that treatment with intoxicating doses of alcohol would enhance hepatic Egr-1 expression, resulting in fatty liver. Our findings revealed that Egr-1 levels indeed rose after ethanol gavage and that fatty liver developed rapidly thereafter. However, steatosis after binge drinking was not fully dependent on Egr-1 induction, but enhanced expression of the transcription factor contributed to ethanol-induced fatty liver.
MATERIALS AND METHODS
Antibody Reagents
We purchased Polyclonal antibodies against Egr-1, and SREBP-1c (H-160), from Cell Signaling Technology Inc. (Danvers, MA), or Santa Cruz Biotechnology (Santa Cruz, CA). We obtained anti-β-actin from Sigma Chemical Co. (St. Louis, MO) or Thermo-Fisher Scientific (Chicago, IL).
Animals
The Institutional Animal Care and Use Committee of the VA Nebraska-Western Iowa Health Care System approved the animal protocol. We followed the Guidelines for the Use and Care of Laboratory Animals, published by the National Institutes of Health. For these studies, we used female C57Bl/6 mice (3 to 9 months of age; National Cancer Institute, Frederick, MD or the Jackson Laboratories, Bar Harbor, ME). To generate Egr-null mice, heterozygous (Egr-1+/−) mice obtained from Taconic Farms Inc (Hudson, NY) were interbred. Tail snips from weaned pups of these crosses were used to isolate DNA for determining the Egr-1 genotype of each animal. Egr-1 cDNA was amplified using primers with sequences previously published (McMullen et al., 2005).
Animal Treatments
Prior to and after acute alcohol treatment, all mice were given free access to Purina Chow diet and tap water. Absolute ethanol was diluted to 50% (v/v) into double strength (2X) phosphate-buffered saline (PBS) and administered to conscious mice by gastric intubation in a single standard dose of six grams per kg body wt (0.304 ml 50% ethanol per 20 gram mouse), using a 3.8 cm stainless steel gavage needle (Popper & Sons, Inc., New Hyde Park, NY) attached to a one ml syringe. Control mice received the same volume per kg body wt of single strength (1X) PBS.
We subjected separate groups of female C57Bl/6 mice to six weeks of chronic ethanol administration by pair-feeding control and ethanol-containing liquid diets we described before (Donohue et al., 2007).
Prior to euthanasia, all mice were anesthetized with pentobarbital (50 mg per kg body wt), blood was collected after severing the axillary vessels and serum was prepared by centrifugation. Following euthanasia by exsanguination and pneumothorax, the liver was excised, rinsed in ice-cold PBS, blotted, weighed and chilled on ice. Liver sections were homogenized in 50 mM Tris-HCl (pH 7.4) containing 0.25 M sucrose, after which a portion of each homogenate was subjected to subcellular fractionation, as we described (Donohue et al., 1994). Hepatic nuclear fractions were separately prepared as detailed (McMullen et al., 2005).
Serum Analyses
Serum ethanol levels were determined by head space chromatography (Donohue et al., 2007.) Alanine transaminase (ALT) activity in serum was quantified by the Omaha VAMC clinical laboratory using a Vitros automated analyzer (Johnson and Johnson, New Brunswick NJ). Endotoxin was measured using a Limulus amoebocyte lysate kit (QCL-1000) from Lonza (Walkersville, MD). E. coli endotoxin was used as the standard.
Glutathione Quantification
Liver homogenates were deproteinized by addition of 10% (w/v) trichloroacetic acid and centrifuged. The supernatant fraction was processed for measurement of both reduced (GSH) and disulfide (GSSG) forms of glutathione, by the enzymatic recycling technique (Griffith, 1980).
Enzyme Activities
Proteasome chymotrypsin-like activity was measured as previously published (Osna et al., 2008), using crude liver homogenates as the source of the enzyme. The same preparations were used to assay CYP2E1 activity as described (Chen and Cederbaum, 1998).
Hepatic Triglycerides
pre-weighed frozen liver pieces were subjected to total lipid extraction (Folch, 1957). The filtered organic extracts were dried by vacuum centrifugation and the dried powder in each was saponified at 65oC in a mixture of 86.3%(v/v) ethanol in 0.73 N KOH. Triglycerides were quantified using Thermo DMA reagent (Thermo Electron Inc, Middletown, VA; Cat # TR22203). Results were calculated as milligrams triglyceride using a triolein standard and normalized per gram of liver.
Lipid Peroxidation
Crude liver homogenates were used to measure lipid peroxides as thiobarbituric acid-reactive substances (TBARS), using a previously-published procedure (Buttkus and Rose, 1972). Malondialdehyde (MDA) was used as the standard and results are reported as MDA equivalents.
Quantification of Egr-1 and Other Proteins
Hepatic nuclear proteins were subjected to denaturing SDS-PAGE in 12% polyacrylamide gels and electroblotted onto nitrocellulose membranes. These were subsequently incubated with rabbit anti-Egr-1 and mouse anti β-actin at 4oC overnight, followed by washing and incubation at room temperature with appropriate secondary antibodies, each conjugated to horseradish peroxidase. Immunoreactive protein bands were detected on x-ray film after exposure of membranes to enhanced chemiluminescence (ECL) substrate (Pierce, Rockford, IL). Band intensities were quantified using Quantity One software from Bio-Rad (Hercules, CA) and normalized to the intensity of the β-actin protein band, which was used as the loading control.
RNA isolation and qRT-PCR
Total RNA was isolated from liver pieces (~50-100 mg each) using either the Trizol Reagent (Invitrogen, Inc., Carlsbad, CA) or the Pure Link RNA mini kit (invitrogen, Inc., Frederick, MD) One ug RNA per reaction mixture was used in the one-step qPCR amplification assay (Applied Biosystems Inc, Foster City, CA). Alternatively, a two step procedure was used in which 100 ng RNA was reverse-transcribed to cDNA using the qScript™ cDNA Supermix (Quanta, BioSciences Inc. Gaithersburg MD). In the second step, the cDNA was amplified using Perfecta™ qPCR FastMix™ (Quanta BioSciences, Inc) with fluorescent-labeled DNA primers (Taq-Man gene expression systems, Applied Biosysems, Inc). These were incubated in a Model 7500 qRT-PCR thermal cycler (Applied Biosystems, Inc). The relative quantity of each RNA transcript was calculated by its threshold cycle (Ct) after subtracting that of the reference cDNA (18S ribosomal RNA). Data are expressed as the quantity of transcript (RQ) in ethanol-fed animals relative to those of corresponding untreated (i.e. PBS-treated) controls.
Statistical analyses
Data are expressed as mean values ± standard error of the mean (SEM). Comparisons for significance between two groups were determined by Student’s t test. A probability value ≤ 0.05 was considered statistically significant.
RESULTS
Dose-Dependent effect of Ethanol on GSH Depletion, Lipid Peroxidation, Egr-1 Induction, and Steatosis
We sought to identify an ethanol dose that caused a significant rise in hepatic triglycerides (steatosis), oxidant stress, as well as changes in the levels of Egr-1. To this end, we gavaged mice with ethanol over a dose range of zero (PBS-treated controls) to six grams per kg body wt, and then euthanized the animals 12 hours post-treatment. Results are summarized in Table 1. Serum ethanol concentrations detected 12 hours after gavage were zero, 1 mM, and 6 mM in mice treated with 2, 4 and 6 grams ethanol per kg body weight, respectively. Compared with controls, six grams ethanol per kg body weight caused a 50% decline in hepatic GSH and a four-fold rise in lipid peroxides. The same ethanol dose caused the first significant increase in hepatic Egr-1 protein, detected as an 80 kDa immunoreactive protein band on Western blots. The increase in Egr-1 was accompanied by a three-fold elevation over controls in hepatic triglycerides. Thus, in all subsequent experiments reported here, we used six g/kg body weight as the standard ethanol dose and compared this with mice gavaged with PBS. Because of concerns about caloric equality between ethanol and controls, in some experiments we included, control animals that were glucose-gavaged (at a dose isocaloric to that of ethanol) and compared them to those that were PBS-gavaged. We noted no significant differences between PBS and glucose in any parameters measured here (data not shown).
Table 1. Glutathione, lipid peroxides , Egr-1 content, and triglycerides in livers of mice gavaged with varying doses of ethanol.
| Ethanol dose (g/kg body wt) |
0 | 2 | 4 | 6 |
|---|---|---|---|---|
| Glutathione (GSH) (nmoles/ mg protein) |
15 ± 2a | 15 ± 4a | 18 ± 1a | 8 ± 2b |
| Lipid peroxides (nmoles MDA/g liver) |
321 ± 70a | 386 ± 72a | 655 ± 60b | 1359 ± 150c |
| Egr-1/actin ratio | 0.44 ± 0.1a | 0.39 ± 0.03a | 0.77 ± 0.12 ab | 0.86 ± 0.07b |
| Triglycerides (mg/g liver) |
12 ± 1a | 14 ± 1.5a | 36 ± 8b | 38 ± 6b |
Note: Parameters were measured 12 hours after gavaging C57Bl/6 mice with the indicated doses of ethanol. Data are mean values (± SEM) from 4 to 11 mice per ethanol dose. Data with superscripts with different letters are significantly different from each other. Data with superscripts with the same letter are not significantly different from each other.
Serum Ethanol, Endotoxin, and ALT after Alcohol Administration
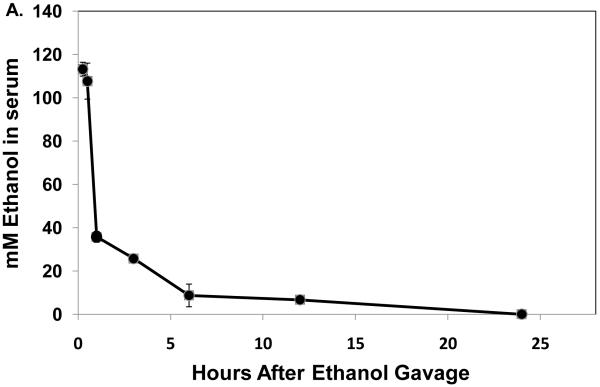
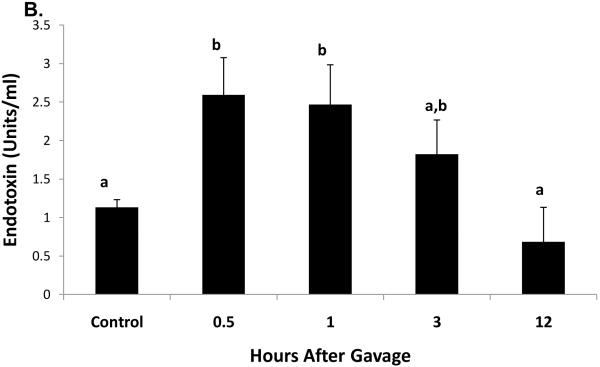
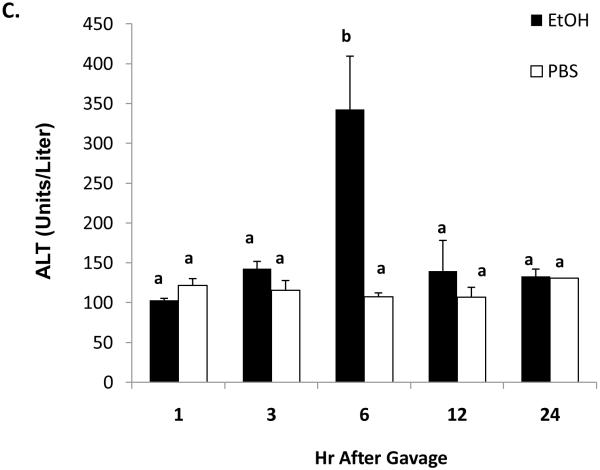
Thirty minutes after administration of a standard ethanol dose, serum ethanol levels were 108 ± 10 mM (497 ± 46 mg/dL). The higher ethanol levels seen 15 and 30 minutes after gavage were associated with ataxia in the mice and difficulty in their righting reflexes and which lasted for one to two hours after gavage. These resembled the behavioral characteristics seen in humans after heavy binge drinking. One hour after gavage, the serum ethanol concentration declined rapidly to 35.7 ± 0.5 mM (143 ± 2.3 mg/dL), then to 6.7 ± 1mM (31 ± 4.6 mg/dL) after 12 hr. Ethanol was undetectable 24 hours post-gavage (Fig 1A). The average clearance rate was 8.4 μmoles per hr per ml of serum over the 12 hr period during which (Lu et al., 2008) ethanol was detectable. Thirty minutes after ethanol treatment, we detected a 2.3-fold rise in serum endotoxin, which remained elevated up to three hours post-gavage (Fig 1B). Liver injury was evident six hours after gavage, when serum ALT activity in ethanol-treated mice was three-fold higher than controls (Fig 1C).
Fig 1.
Serum ethanol (panel A), serum endotoxin (panel B), and serum ALT (panel C) at the indicated times after a single standard dose of ethanol (6 grams/kg body wt) or PBS. Data presented are mean values (± SEM) from 2 to 10 animals per group per time point. Note: in Fig 1B, data from control animals (n=5) were compiled from sera of PBS-treated animals taken at 30 minutes and 3 hr post-gavage. Data with different letters indicate they are significantly different from each other. Data with the same letter are not significantly different.
Time Course of Hepatic Alterations
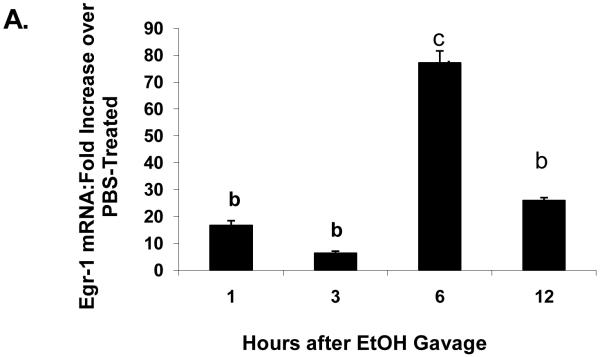
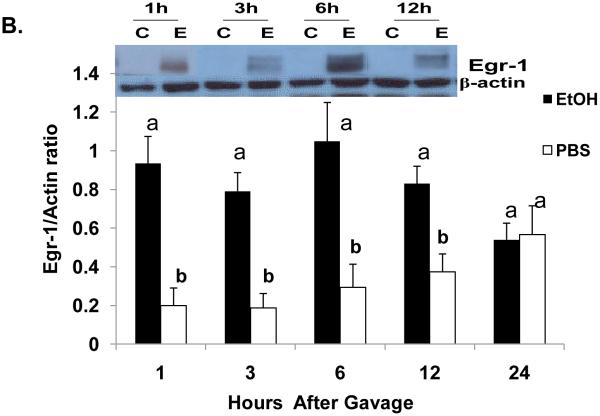
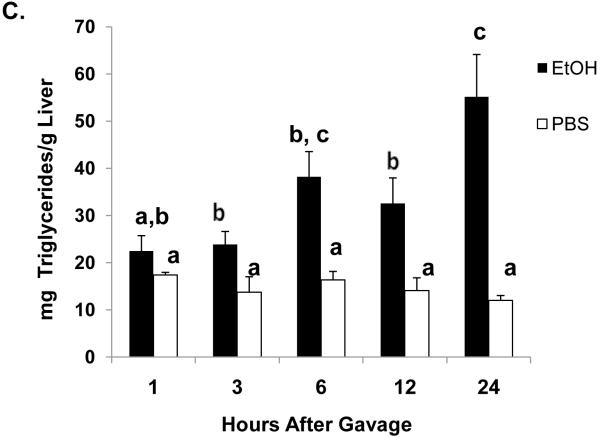
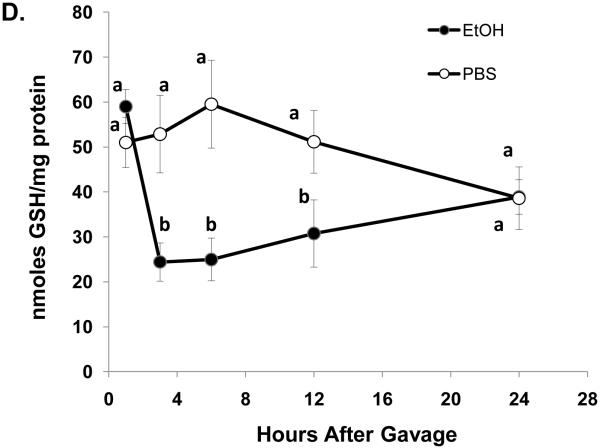
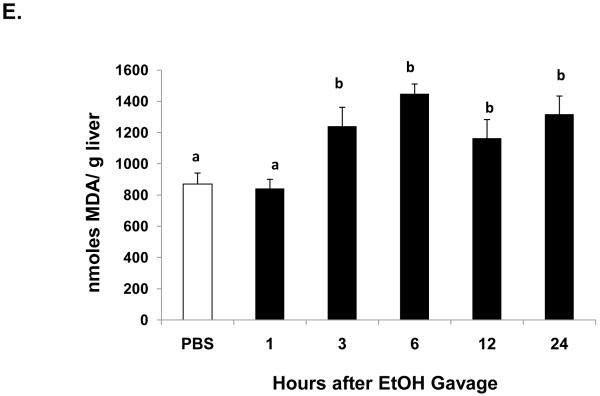
One hour after ethanol gavage, both Egr-1 mRNA (Fig 2A) and protein (Fig 2B) increased nearly 20-fold and five-fold, respectively over those in PBS-treated controls, suggesting that Egr-1 is an immediate early gene product that rapidly responds to ethanol administration. After the single ethanol gavage, Egr-1 protein remained elevated 12 hr after treatment and returned to control levels 24 post-gavage (Fig 2B). Three hours post-gavage, we detected a two-fold rise in liver triglycerides. Fatty liver was sustained up to 24 hours post-ethanol, when triglycerides were five-fold higher than PBS controls (Fig 2C). Consistent with previous findings (Zhou et al., 2003), our histological analyses revealed only microvesicular lipid droplets in livers of ethanol-treated mice (data not shown). Three hours post-gavage, we also detected the first signs of oxidant stress in livers of ethanol-gavaged mice, as judged by a 1.6-fold decline in hepatic GSH (Fig 2D). GSH remained significantly lower than controls at six and 12 hours post-treatment. Its decrease did not reflect enhanced conversion to its disulfide form, because at six hours post-gavage, GSSG levels in control mice (2.4 ± 0.2 nmoles/mg protein) were 1.7-fold higher than in ethanol-treated animals (1.4 ± 0.2 nmoles/mg protein: P = 0.002). Coincident with the initial rise in triglycerides at three hours (Fig 2C), we noted a 1.4-fold rise in lipid peroxides and this condition was sustained 24 hours after ethanol treatment (Fig 2E).
Fig 2.
Egr-1 mRNA level (panel A) Egr-1 protein level (panel B), hepatic triglycerides (panel C) reduced glutathione (Panel D), and lipid peroxides (panel E) at the indicated times after a single standard dose of ethanol (6 grams/kg body wt) or PBS. Data presented are mean values (± SEM) from 4 to 24 animals per group per time point. Symbols mean the same as in Fig 1. Note: In Fig 2A, the control values (each with an arbitrary value of 1) are not shown but are implied to have the symbol “a”. Thus, the values shown in Fig 2A begin with the symbol “b” or “c” as indicated. Inset panel in Fig 2B is a representative western blot of Egr-1 (80 KDa) and actin (42 KDa) in hepatic nuclear fractions from PBS-gavaged control (C) or ethanol-gavaged (E) C57Bl/6 mice.
CYP2E1 and Hepatic Proteasome Activities
There was no change in CYP2E1 activity at any time after acute ethanol gavage, signifying that the enzyme activity was not increased by binge drinking as it is after chronic alcohol feeding (Donohue et al., 2007). Proteasome chymotrypsin-like activity in livers of acutely-treated control mice (17 ± 2.5 nmoles/min/mg protein) was equal to that of ethanol-treated mice. (15 ± 2.0 nmoles/min/mg protein; P= 0.52, N = 17 per group) 12 hours after ethanol gavage. There were no significant changes detected in the enzyme activity at any other time after ethanol treatment (data not shown). These findings indicate that the rise in Egr-1 protein after acute ethanol treatment did not result from its stabilization due to a decline in proteasome activity, as the transcription factor is degraded by the proteasome (Bae et al., 2002; Walsh and Shupnik, 2009).
Steatosis in Egr-1null mice
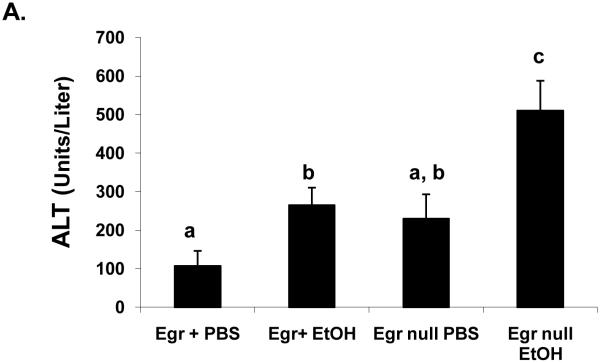
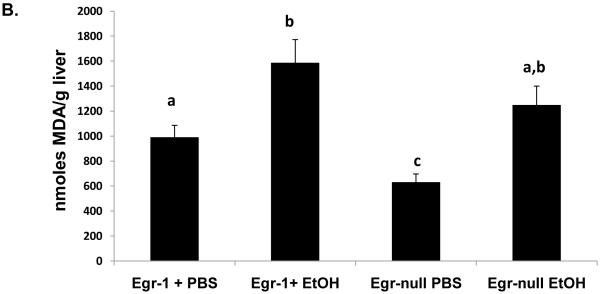
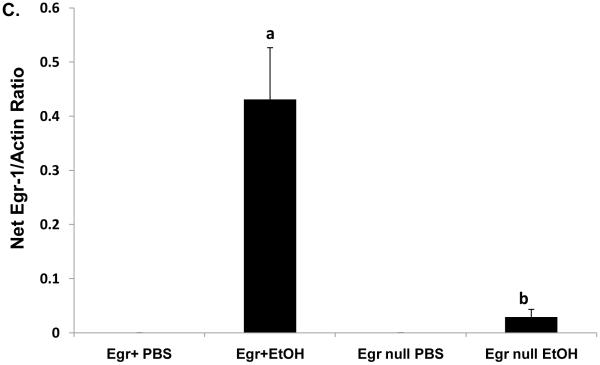
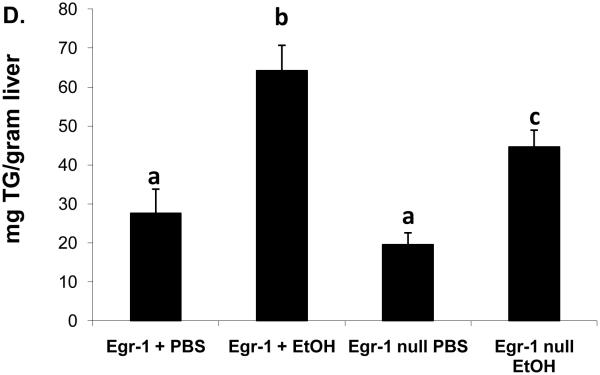
In order to evaluate the contribution of Egr-1 to fatty liver after acute ethanol treatment, we tested whether binge drinking caused steatosis in mice that lacked Egr-1 expression. Twelve hours after ethanol gavage, serum ethanol levels were nearly equal in Egr-1null mice (7.0 ± 1.3 mM) and wild type littermates (5.5 ± 0.8 mM; P = 0.37), indicating that the absence of Egr-1 expression did not influence ethanol metabolism. Interestingly, ethanol-gavaged Egr-1null animals exhibited serum ALT levels almost two-fold higher than identically-treated Egr+ littermates (Fig 3A). The latter observation was rather remarkable, as we previously observed no rise in ALT, 12 hr after treatment of C57Bl/6 mice (Fig 1C), suggesting innate differences in ethanol sensitivity between C57Bl/6 mice and those in our breeding colony. Lipid peroxides in ethanol-treated Egrnull and wild type littermates were equal (Fig 3 B) and the ethanol-induced decrease in GSH levels in livers of both animal groups was essentially the same (data not shown). As expected, Egr-1 protein was undetectable in both control and ethanol-treated Egr-1 knockout mice, while hepatic nuclear fractions from ethanol-gavaged wild type littermates had higher liver Egr-1 content than corresponding controls (Fig 3C). While the wild type mice in these latter experiments were of mixed gender and zygosity, we found no indication that their degree of Egr-1 inducibility differed between males and females (P = 0.68) or between heterozygous and homozygous Egr-1-positive animals (P = 0.83). However, triglyceride levels in ethanol-treated wild type mice were 30% higher than in corresponding Egr-1null animals, indicating that the absence of Egr-1 expression partially ablated steatosis and demonstrating that Egr-1 contributes significantly to the development of fatty liver after acute ethanol administration (Fig 3D).
Fig 3.
Serum ALT activities (Panel A), lipid peroxides (Panel B), net Egr-1 levels (Panel C), and liver triglycerides (Panel D), in wild type and Egr-1 null mice 12 hr after a single standard dose of ethanol (6 grams/kg body wt) Data presented are mean values (± SEM) from 4 to 16 animals per group. Note: Data in Panel C were corrected by subtracting the background densities detected in PBS-treated animals from those of their corresponding wild type or Egr-1 null ethanol-treated mice. Data are expressed as the net intensity of the immunoreactive Egr-1 protein band and were normalized to that of β-actin. Symbols mean the same as in Fig 1.
Hepatic Egr-1 After Chronic Ethanol Feeding
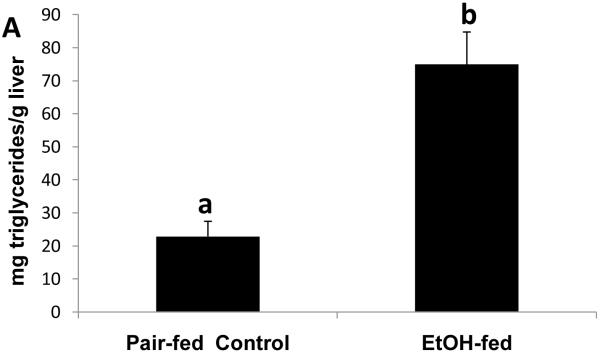
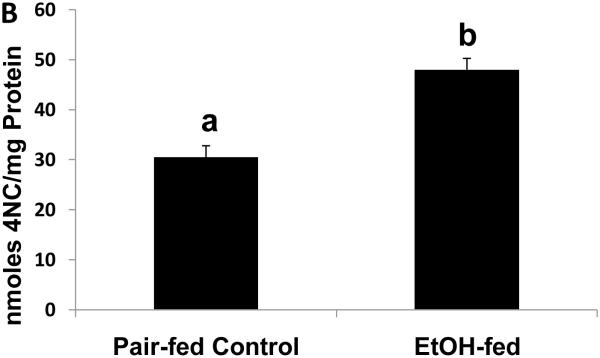
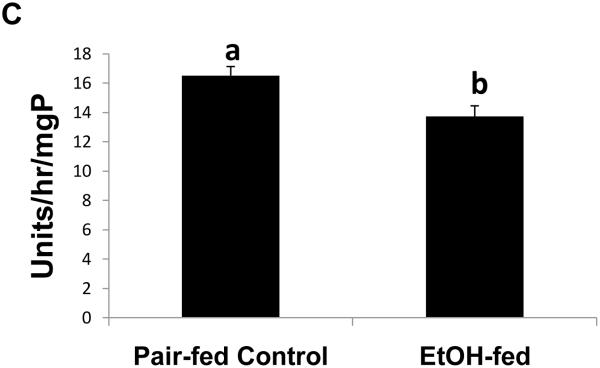
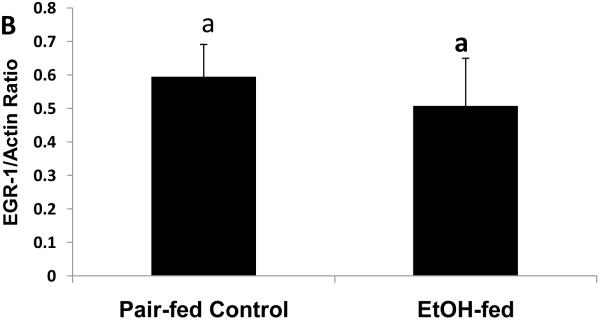
To determine whether the expression of Egr-1 is altered after chronic ethanol administration as it is after binge drinking, we subjected mice to chronic ethanol feeding. After 39 to 60 days of pair-feeding, endotoxin levels in control and ethanol-fed mice were equal (data not shown). However, ethanol-fed mice exhibited three-fold higher hepatic triglyceride levels than controls (Fig 4A). Fatty liver in ethanol-fed mice was associated with a 1.6-fold rise in CYP2E1 activity (Fig 4B), which, in turn, was associated with a 1.2-fold decline in proteasome chymotrypsin-like activity (Fig 4C). However, the decrease in proteasome catalytic activity in livers of ethanol-fed mice did not affect the nuclear level of Egr-1, which was equal in both groups of animals (Fig 4D).
Fig. 4.
Hepatic triglycerides (Panel A), CYP2E1 specific activity (Panel B), proteasome chymotrypsin-like specific activity (Panel C), and Egr-1 protein content (panel D) in livers of chronically ethanol-fed rats and their pair-fed controls after 39 to 60 days of pair-feeding. Data are expressed as mean values (± SEM) obtained from 4 to 6 mice per group. Symbols mean the same as in Fig 1.
DISCUSSION
Continuous abuse of alcoholic beverages causes liver injury that, with continued drinking, can progress to increasingly severe forms of tissue damage, ending in liver failure in about 20% of problem alcohol users. Fatty liver occurs in 90% of heavy drinkers and is the earliest sign of liver injury. Steatosis is followed by hepatic inflammation, resulting in steatohepatitis and hepatocyte death, which, with exacerbated inflammation, transforms liver stellate cells into collagen secreting cells, thereby initiating fibrosis. Progression of the latter drastically changes liver architecture and severely compromises its physiological functions, resulting in liver failure. Thus, beginning with binge or chronic alcohol drinking (or a combination of the two), changes in the levels of liver regulatory factors, including SREBP-1c and, PPAR-α influence changes in lipid anabolism and catabolism, that result in steatosis. Egr-1 is a relatively new addition to a growing list of these factors, and, because of its important role in the cellular response to stress (Pritchard and Nagy, 2005), Egr-1 likely interacts with the aforementioned transcription factors to influence gene expression after ethanol administration.
The data presented herein demonstrate that naïve C57Bl/6 mice rapidly cleared alcohol to sub-intoxicating levels (9 mM) six hours after they were gavaged with ethanol (Fig 1A). By comparison, after chronic alcohol consumption, mice exhibit serum ethanol levels of ~60 mM the morning of euthanasia (Donohue et al., 2007). Despite the obvious differences in the two feeding regimens, a single gavage with ethanol caused a rapid and rather sustained increase in liver triglyceride that was quantitatively comparable to that observed after chronic ethanol feeding (compare Fig 2C to Fig 4A). The major difference was that binge drinking caused microvesicular fatty liver, while macrovesicular steatosis predominates after chronic alcohol feeding (Curry-McCoy et al., 2010; Donohue et al., 2007). Acute ethanol treatment induced fatty liver without CYP2E1 induction. Nevertheless, CYP2E1 likely participated in the rapid clearance of ethanol and generated oxidants that altered lipid metabolism. Studies in rats indicate that the degree of CYP2E1 induction by ethanol is associated with the degree of steatosis (Jarvelainen et al., 2000), to suggest that elevated CYP2E1 participates in the development of macrovesicular steatosis seen after chronic alcohol administration.
In the gut, alcohol breaches the structural integrity of the intestinal epithelium, allowing gut-derived endotoxin to enter the portal circulation. There, it contacts toll-like receptor 4 (TLR4) on periportal hepatocytes and Kupffer cells to initiate an inflammatory reaction (Bode et al., 1987; Zhou et al., 2003). Here, ethanol binge rapidly enhanced circulating endotoxin, which remained elevated three hours after treatment (Fig 2B). Zhou et al. also demonstrated that the ethanol-induced rise in endotoxin causes significant oxidant stress, as pretreatment with N-acetylcysteine (NAC), an agent that restores hepatic glutathione (GSH), blocked steatosis, lipid peroxidation and TNF-α production (Zhou et al., 2003). Here, the decrease in GSH three hours post-gavage (Fig 3D) was consistent with this notion. Ethanol-induced GSH depletion seen here did not result from its conversion to GSSG but likely occurred by its reaction with acetaldehyde and/or reactive oxidants generated by ADH and CYP2E1. We previously showed that GSH is an acetaldehyde trap (Donohue et al., 1983a; Donohue et al., 1983b). We also observed that the first significant rise in triglycerides and lipid peroxides coincided with the depletion of GSH (Fig 2C and 2D), to suggest that the development of fatty liver sustains lipid peroxidation and that the “burst” in oxidant stress was likely responsible for the subsequent hepatotoxic response, seen as the “surge” in serum ALT (Fig 1C). Thus, the sequence of events leading to liver injury after binge drinking are a convergence of steatosis and oxidant stress.
The main objective of this study was to ascertain the response of Egr-1 expression to acute ethanol administration. The induction patterns of Egr-1 mRNA and its protein were similar after ethanol gavage (Fig 2A and 2B), indicating that ethanol treatment accelerated Egr-1 synthesis by enhancing the levels of its mRNA. This induction mechanism is similar to that of SREBP-1c and its mRNA, after acute ethanol administration (Yin et al., 2007). There is compelling evidence that metabolically-derived acetaldehyde from ethanol oxidation is required for SREBP-1c induction (You et al., 2002). We similarly propose that hepatic ethanol oxidation generates reactive species that likely participated in Egr-1 induction. This is supported by the rapid rate of ethanol clearance seen here and data from our unpublished work with recombinant hepatoma cells (Thomes, unpublished). It is also likely that the transient rise in serum endotoxin (Fig 1B) either triggered or augmented Egr-1 induction, as McMullen et al. demonstrated that endotoxin (LPS) injection rapidly increases hepatic Egr-1 mRNA and protein levels and that this response is augmented by prior chronic ethanol feeding (McMullen et al., 2005). They also reported that prior to LPS treatment, control and ethanol-fed mice had equal Egr-1 mRNA and protein levels. The results of our chronic studies are consistent with theirs, as Egr-1 protein levels were equal in control and ethanol-fed mice (Fig 4D). The lack of increase in circulating endotoxin seen here is inconsistent with their findings but it supports the notion that endotoxin enhances hepatic Egr-1 expression.
Despite the ethanol-induced increase in Egr-1 expression that preceded triglyceride accumulation, the transcription factor was not essential for fatty liver development. Ethanol-gavaged Egr-1 knockout mice still exhibited steatosis. However, the magnitude of this change was 30% lower than in wild type littermates (Fig 3D). These findings indicate that, not only did Egr-1 contribute to the development of fatty liver, but other factors, including a swift increase in ethanol metabolism (Bradford and Rusyn, 2005) and induction of SREBP-1c also participated in development of steatosis after binge drinking.
Although there was significantly attenuated steatosis after acute ethanol, Egr knockout mice exhibited levels of lipid peroxides comparable to those of wild-type mice (Fig 3B). Interestingly, liver damage in Egr-1null animals was higher than in wild type littermates and PBS-treated Egr-1null mice exhibited serum ALT levels that were nearly equal to those of wild-type ethanol-treated mice (Fig 3A). These findings suggest that Egr-1 knockout animals have intrinsically higher ALT levels, suggesting that Egr-1 may protect the liver from ethanol toxicity. We do not know the mechanism of this protection, but we suggest that, because Egr-1 regulates expression of intercellular adhesion molecule-1 (ICAM-1) (Hou et al., 1994) that the loss of Egr-1 expression in knockout animals may increase gut permeability to endotoxin. An alternate explanation is that because deletion of Egr-1 expression resulted in a 30% decrease in hepatic triglycerides after ethanol treatment, that Egr-1 may regulate genes encoding triglyceride formation. It is believed that triglycerides have a “protective” function by esterifying potentially cytotoxic free fatty acids into triglycerides (Lu et al., 2008). Pritchard et. al provided further evidence for a protective function by Egr-1. They showed greater liver damage after acute carbon tetrachloride treatment in Egr-1 knockout mice than in wild type animals (Pritchard et al., 2010). Although the potencies of ethanol and CCl4 differ greatly, the similarities of these findings warrant further studies to establish whether Egr-1 is essential in preventing ethanol-induced liver damage. Thus, during acute ethanol-induced liver injury as seen here, Egr-1 is rapidly synthesized in response to cellular stress and appears to protect the liver. While we do not know the exact mechanism for the attenuation of steatosis after acute ethanol administration in Egr-1 null mice, it is likely that the absence of Egr-1 expression prevents the maximal induction of genes that encode lipogenic enzymes.
In conclusion, our findings indicate that acute administration of intoxicating doses of alcohol brought about transient changes in oxidant stress, steatosis and liver injury. Acute ethanol administration induced Egr-1 but the transcription factor participated with other factors in inducing fatty liver. Our findings provide strong evidence that the alterations in lipid metabolism after binge drinking are distinct from those which occur after continuous heavy drinking. They underscore the necessity of further studies to determine whether steatosis that develops after acute ethanol administration participates in liver injury or, in fact may be protective due to the expression of Egr-1.
ACKNOWLEDEGEMENTS
We are pleased to acknowledge the contributions of Ronda L. White and Dr. Tiana V. Curry-McCoy in this investigation.
RESOURCES, FACILITIES AND GRANT SUPPORT
The data presented here are results of work supported with resources and the use of facilities at the VA Nebraska-Western Iowa Health Care System of the Department of Veterans Affairs, Veterans Health Administration, Office of Research and Development. Financial support for this project was provided by Grant Number 1-R01-AA16546 from the National Institute of Alcohol Abuse and Alcoholism, and by institutional funds from the Section of Gastroenterology and Hepatology, Department of Internal Medicine, University of Nebraska Medical Center
Financial support for this project was provided by Grant Number 1-R01-AA16546 from the National Institute of Alcohol Abuse and Alcoholism, and by institutional funds from the Section of Gastroenterology and Hepatology, Department of Internal Medicine, University of Nebraska Medical Center.
Footnotes
Disclaimer: The contents of this paper do not represent the views of the Department of Veterans Affairs or the United States Government.
REFERENCES
- Bae MH, Jeong CH, Kim SH, Bae MK, Jeong JW, Ahn MY, Bae SK, Kim ND, Kim CW, Kim KR, Kim KW. Regulation of Egr-1 by association with the proteasome component C8. Biochim Biophys Acta. 2002;1592(2):163–7. doi: 10.1016/s0167-4889(02)00310-5. [DOI] [PubMed] [Google Scholar]
- Bardag-Gorce F, Oliva J, Dedes J, Li J, French BA, French SW. Chronic ethanol feeding alters hepatocyte memory which is not altered by acute feeding. Alcohol Clin Exp Res. 2009;33(4):684–92. doi: 10.1111/j.1530-0277.2008.00885.x. [DOI] [PMC free article] [PubMed] [Google Scholar]
- Buttkus H, Rose R. Amine malondialdehyde condensation products and their relative color contribution in the thiobarbituric acid test. J. Am Oil Chemists Soc. 1972;49:440–443. [Google Scholar]
- Carmiel-Haggai M, Cederbaum AI, Nieto N. Binge ethanol exposure increases liver injury in obese rats. Gastroenterology. 2003;125(6):1818–33. doi: 10.1053/j.gastro.2003.09.019. [DOI] [PubMed] [Google Scholar]
- Chen Q, Cederbaum AI. Cytotoxicity and apoptosis produced by cytochrome P450 2E1 in Hep G2 cells. Mol Pharmacol. 1998;53(4):638–48. doi: 10.1124/mol.53.4.638. [DOI] [PubMed] [Google Scholar]
- Donohue TM., Jr. Alcohol-induced steatosis in liver cells. World J Gastroenterol. 2007;13(37):4974–8. doi: 10.3748/wjg.v13.i37.4974. [DOI] [PMC free article] [PubMed] [Google Scholar]
- Donohue TM, Jr., Curry-McCoy TV, Todero SL, White RL, Kharbanda KK, Nanji AA, Osna NA. L-Buthionine (S,R) sulfoximine depletes hepatic glutathione but protects against ethanol-induced liver injury. Alcohol Clin Exp Res. 2007;31(6):1053–60. doi: 10.1111/j.1530-0277.2007.00393.x. [DOI] [PubMed] [Google Scholar]
- Donohue TM, Jr., Drey ML, Zetterman RK. Contrasting effects of acute and chronic ethanol administration on rat liver tyrosine aminotransferase. Alcohol. 1998;15(2):141–6. doi: 10.1016/s0741-8329(97)00108-0. [DOI] [PubMed] [Google Scholar]
- Donohue TM, Jr., McVicker DL, Kharbanda KK, Chaisson ML, Zetterman RK. Ethanol administration alters the proteolytic activity of hepatic lysosomes. Alcohol Clin Exp Res. 1994;18(3):536–41. doi: 10.1111/j.1530-0277.1994.tb00906.x. [DOI] [PubMed] [Google Scholar]
- Folch J, Lees M, Stanley GHS. A simple method for the isolation and purification of total lipid from animal tissue. J Biol Chem. 1957;226:497–509. [PubMed] [Google Scholar]
- Galli A, Pinaire J, Fischer M, Dorris R, Crabb DW. The transcriptional and DNA binding activity of peroxisome proliferator-activated receptor alpha is inhibited by ethanol metabolism. A novel mechanism for the development of ethanol-induced fatty liver. J Biol Chem. 2001;276(1):68–75. doi: 10.1074/jbc.M008791200. [DOI] [PubMed] [Google Scholar]
- Griffith OW. Determination of glutathione and glutathione disulfide using glutathione reductase and 2-vinylpyridine. Anal Biochem. 1980;106(1):207–12. doi: 10.1016/0003-2697(80)90139-6. [DOI] [PubMed] [Google Scholar]
- Hou J, Baichwal V, Cao Z. Regulatory elements and transcription factors controlling basal and cytokine-induced expression of the gene encoding intercellular adhesion molecule 1. Proc Natl Acad Sci U S A. 1994;91(24):11641–5. doi: 10.1073/pnas.91.24.11641. [DOI] [PMC free article] [PubMed] [Google Scholar]
- Jarvelainen HA, Fang C, Ingelman-Sundberg M, Lukkari TA, Sippel H, Lindros KO. Kupffer cell inactivation alleviates ethanol-induced steatosis and CYP2E1 induction but not inflammatory responses in rat liver. J Hepatol. 2000;32(6):900–10. doi: 10.1016/s0168-8278(00)80094-x. [DOI] [PubMed] [Google Scholar]
- Lawler JF, Jr., Yin M, Diehl AM, Roberts E, Chatterjee S. Tumor necrosis factor- alpha stimulates the maturation of sterol regulatory element binding protein-1 in human hepatocytes through the action of neutral sphingomyelinase. J Biol Chem. 1998;273(9):5053–9. doi: 10.1074/jbc.273.9.5053. [DOI] [PubMed] [Google Scholar]
- Lieber CS, DeCarli LM. Hepatotoxicity of ethanol. J Hepatol. 1991;12(3):394–401. doi: 10.1016/0168-8278(91)90846-4. [DOI] [PubMed] [Google Scholar]
- Liu B, Balkwill A, Reeves G, Beral V. Body mass index and risk of liver cirrhosis in middle aged UK women: prospective study. Brit. Med J. 2010;340:c912. doi: 10.1136/bmj.c912. [DOI] [PMC free article] [PubMed] [Google Scholar]
- Lu Y, Zhuge J, Wang X, Bai J, Cederbaum AI. Cytochrome P450 2E1 contributes to ethanol-induced fatty liver in mice. Hepatology. 2008;47(5):1483–94. doi: 10.1002/hep.22222. [DOI] [PubMed] [Google Scholar]
- Mathurin P, Deltenre P. Effect of binge drinking on the liver: an alarming public health issue? Gut. 2009;58(5):613–7. doi: 10.1136/gut.2007.145573. [DOI] [PubMed] [Google Scholar]
- McMullen MR, Pritchard MT, Wang Q, Millward CA, Croniger CM, Nagy LE. Early growth response-1 transcription factor is essential for ethanol-induced fatty liver injury in mice. Gastroenterology. 2005;128(7):2066–76. doi: 10.1053/j.gastro.2005.02.065. [DOI] [PMC free article] [PubMed] [Google Scholar]
- O’Shea RS, Dasarathy S, McCullough AJ. Alcoholic liver disease. Hepatology. 2010;51(1):307–28. doi: 10.1002/hep.23258. [DOI] [PubMed] [Google Scholar]
- Osna NA, White RL, Krutik VM, Wang T, Weinman SA, Donohue TM., Jr. Proteasome activation by hepatitis C core protein is reversed by ethanol-induced oxidative stress. Gastroenterology. 2008;134(7):2144–52. doi: 10.1053/j.gastro.2008.02.063. [DOI] [PMC free article] [PubMed] [Google Scholar]
- Pritchard MT, Nagy LE. Ethanol-induced liver injury: potential roles for egr-1. Alcohol Clin Exp Res. 2005;29(11 Suppl):146S–150S. doi: 10.1097/01.alc.0000189286.81943.51. [DOI] [PubMed] [Google Scholar]
- Walsh HE, Shupnik MA. Proteasome regulation of dynamic transcription factor occupancy on the GnRH-stimulated luteinizing hormone beta-subunit promoter. Mol Endocrinol. 2009;23(2):237–50. doi: 10.1210/me.2008-0098. [DOI] [PMC free article] [PubMed] [Google Scholar]
- Waszkiewicz N, Szajda SD, Zalewska A, Konarzewska B, Szulc A, Kepka A, Zwierz K. Binge drinking-induced liver injury. Hepatology. 2009;50(5):1676. doi: 10.1002/hep.23178. [DOI] [PubMed] [Google Scholar]
- Wechsler H, Dowdall GW, Davenport A, Castillo S. Correlates of college student binge drinking. Am J Public Health. 1995a;85(7):921–6. doi: 10.2105/ajph.85.7.921. [DOI] [PMC free article] [PubMed] [Google Scholar]
- Wechsler H, Dowdall GW, Davenport A, Rimm EB. A gender-specific measure of binge drinking among college students. Am J Public Health. 1995b;85(7):982–5. doi: 10.2105/ajph.85.7.982. [DOI] [PMC free article] [PubMed] [Google Scholar]
- Yao J, Mackman N, Edgington TS, Fan ST. Lipopolysaccharide induction of the tumor necrosis factor-alpha promoter in human monocytic cells. Regulation by Egr-1, c-Jun, and NF-kappaB transcription factors. J Biol Chem. 1997;272(28):17795–801. doi: 10.1074/jbc.272.28.17795. [DOI] [PubMed] [Google Scholar]
- You M, Crabb DW. Recent advances in alcoholic liver disease II. Minireview: molecular mechanisms of alcoholic fatty liver. Am J Physiol Gastrointest Liver Physiol. 2004;287(1):G1–6. doi: 10.1152/ajpgi.00056.2004. [DOI] [PubMed] [Google Scholar]
- You M, Fischer M, Deeg MA, Crabb DW. Ethanol induces fatty acid synthesis pathways by activation of sterol regulatory element-binding protein (SREBP) J Biol Chem. 2002;277(32):29342–7. doi: 10.1074/jbc.M202411200. [DOI] [PubMed] [Google Scholar]
- Zhou Z, Wang L, Song Z, Lambert JC, McClain CJ, Kang YJ. A critical involvement of oxidative stress in acute alcohol-induced hepatic TNF-alpha production. Am J Pathol. 2003;163(3):1137–46. doi: 10.1016/s0002-9440(10)63473-6. [DOI] [PMC free article] [PubMed] [Google Scholar]


