Abstract
The Bloch-Siegert (B-S) method of mapping has been shown to be fast and accurate, yet has high SAR and moderately long TE. These limitations can lengthen scan times and incur signal loss due to B0 inhomogeneity, particularly at high field. The B-S method relies on applying a band-limited off-resonant B-S RF pulse to induce a -dependent frequency-shift for resonant spins. A method for optimizing the B-S RF pulse is presented here that maximizes B-S measurement sensitivity for a given SAR and T2. A 4 ms optimized pulse is shown to have 35% less SAR compared to the conventional 6 ms Fermi pulse while still improving map angle-to-noise ratio by 22%. The optimized pulse performance is validated both in phantom and in vivo brain imaging at 7T.
Keywords: mapping, flip angle, Bloch-Siegert shift, off resonance, parallel transmit, RF pulse design
INTRODUCTION
Accurate and precise measurement of the transmit field is needed in several applications like relaxometry (?), parallel transmit pulse design (?), accurate transmit gain calibration or coil design validation. Several methods for mapping have been introduced including (?,?,?,?) but they generally suffer from long scan times, errors due to imperfect spoiling or unwanted T1 and B0 dependencies. Recently the Bloch-Siegert (B-S) mapping method has been shown to be an accurate and efficient method of mapping magnitude (?) with the significant advantage of being largely insensitive to tissue properties such as T1 and T2. The B-S method has been also shown (?) to be particularly good for parallel transmit pulse design because of its excellent performance, defined by high Angle to Noise Ratio (ANR) at small tip angles. It should be noted that in order to determine the relative RF phase between transmit fields, required for parallel transmit pulse design, additional images must be acquired that do not include the phase disturbing Bloch-Siegert effect. In spite of the excellent performance of this method, it has some limitations: these include a long echo time and high RF deposition (SAR) due to the relatively long (typically 6 ms) off-resonant RF pulse (B-S pulse) used to create the B-S phase shift that is the fundamental quantity of interest. The optimal B-S pulse should have a frequency response that limits on-resonant excitation, yet it also should create enough Bloch-Siegert phase shift for adequate B-S map quality. In this work we sought to optimize the design of short B-S pulses to maximize sensitivity while constraining on-resonance excitation to lie below a predefined threshold; we then compared the resulting optimized pulses to the 6 ms Fermi pulse that was used in the original description of the B-S method (?) as a reference.
METHODS
A typical B-S pulse is a large tip pulse (> 1200° if it were applied on resonance); however by virtue of being sufficiently off-resonant, the axis of the effective B field is nearly parallel to B0, i.e. nearly parallel to the longitudinal magnetization direction. As there is minimal perturbation of the longitudinal magnetization we assume the small-tip approximation (?), meaning that simple Fourier analysis holds within the resonant band. In order to maximize ANR for a given pulse width, we are looking for the B-S pulse which generates the maximum B-S phase shift. Maximizing B-S phase shift is achieved by maximizing B-S pulse energy and minimizing B-S frequency offset (?). A key aspect of our pulse design methodology is the use of quadratic programming to design an equiripple high-stop filter that maximizes pulse power for defined values of pulse width, peak B1;max, stopband ripple and stopband edge, described as follows:
| [1] |
Where are the N scaled samples of the fixed-duration RF pulse, I is the identity matrix, W is a DFT matrix evaluating the stopband performance of the pulse, δ is the stopband ripple, B1;max is the peak expected to be used, Δt is the duration of each RF sample so that total pulse width T = NΔt, and γ is the gyromagnetic ratio. The minimization problem is solved using the quadratic programming solver provided by MATLAB (The Mathworks, Natick, USA). As the problem is not strictly convex, local minima are avoided by seeding the program with a Fermi window as an initial solution (?). With the above quadratic programming tool in place, the design strategy is to find the globally optimum B-S pulse, defined as the one that generates maximum B-S phase shift subject to the constraints. We use an exhaustive search strategy, described in the following set of steps:
Define values for T (pulse width), δ (stopband ripple threshold), B1;max
Start of design loop: set value of stopband edge (initial value: 1 kHz)
Using quadratic programming, design high-stop filter with stopband edge set in step 2, subject to constraints set in step 1
Perform Bloch simulation to find true stopband edge accounting for minor inaccuracy in small-tip approximation
Modulate the pulse off-resonance by an amount equal to true stopband edge + 600 Hz assuming on-resonance band of interest is ±600 Hz
Perform second Bloch simulation on frequency-offset pulse to evaluate B-S shift
Record value of B-S shift
Cycle back to step 2, increase stopband edge by 10 Hz, and repeat steps 2–8 until complete nominal stopband edge range has been spanned (1–4 kHz)
Search the complete nominal stopband edge range for ”globally optimal” B-S pulse, defined as the one with maximum B-S phase shift.
Optional: Repeat entire cycle (steps 1–9) for different value of T (and possibly also different δ or B1;max values)
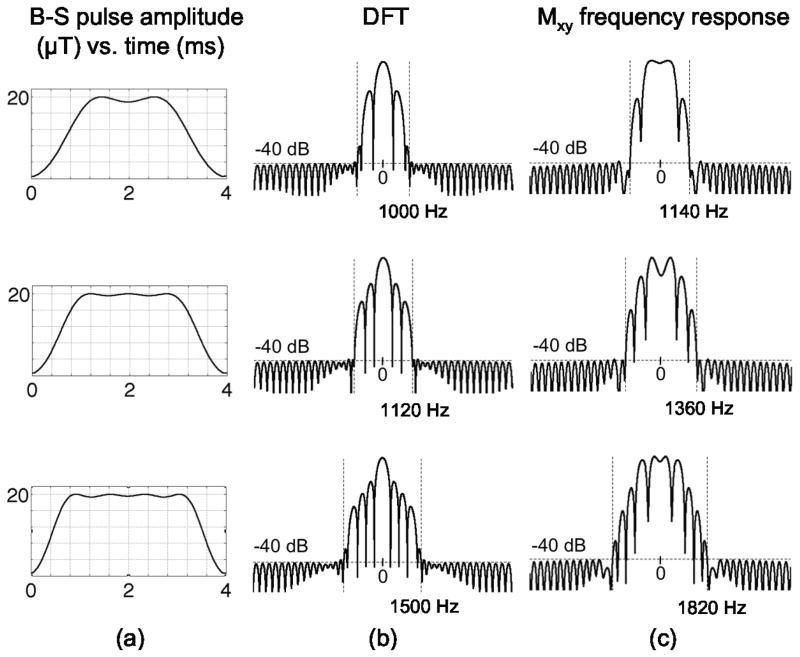
Figure 1 shows a schematic diagram showing the time- and frequency-domain representations of low, mid and high value stopband edge pulses, and how they differ in terms of B-S shift. To compare different pulses with different pulse widths, we have to consider two factors. First, in a given TR, SAR will be mostly proportional to the B-S pulse energy assuming that the excitation pulse is small and its contribution to SAR can be neglected compared to the B-S pulse. Therefore, we define the intrinsic B-S pulse efficiency as B-S phase shift divided by B-S pulse energy. This efficiency metric allows us to compare B-S pulses of different pulse widths under the condition of constant SAR. The second factor is the additional echo time caused by the insertion of B-S pulse into the pulse sequence. To account for the magnitude signal loss during the B-S pulse, and therefore the loss in map ANR, we add a multiplicative factor of , where pw is the B-S pulse width, into the definition of total B-S pulse efficiency. With the above definition of total B-S pulse efficiency, we ran simulations with different B-S pulse widths and values relevant to human tissue at 7T, and sought to optimize this efficiency figure of merit. All simulations and B-S pulse design were done on a 2.66 GHz Intel Core i7 Macbook Pro laptop (Apple, Cupertino, USA) with 4 GB of RAM.
Figure 1.
B-S pulse design steps. (a) Using quadratic programming, a 4 ms B-S pulse is designed with a maximum of 1% (−40 dB) on-resonance excitation over the stopband, when the stopband edge is set to 1000 Hz (top row), 1120 Hz (middle row) and 1500 Hz (bottom row). The Fourier transform of the pulse scaled by 2πγΔt is shown in (b). The transverse magnetization frequency response calculated using a Bloch simulation is shown in (c), showing that the actual stopband frequency for the top pulse is 1140 Hz, for the middle pulse is 1360 Hz and for the bottom pulse is 1820 Hz. To ensure that the on-resonance excitation is constrained to be less than δ (−40 dB) over the entire range of interest ±600 Hz, the B-S pulse is modulated off-resonance by an amount equal to stopband edge + 600 Hz, i.e. 1740 Hz for the top pulse, 1960 Hz for the middle pulse and 2420 Hz for the bottom pulse. A further B-S simulation shows that the top B-S pulse generates 308 deg phase shift, the middle B-S pulse generates 325 deg phase shift and the bottom B-S pulse generates 299 deg phase shift, indicating that the middle pulse is more efficient than the top and bottom pulses.
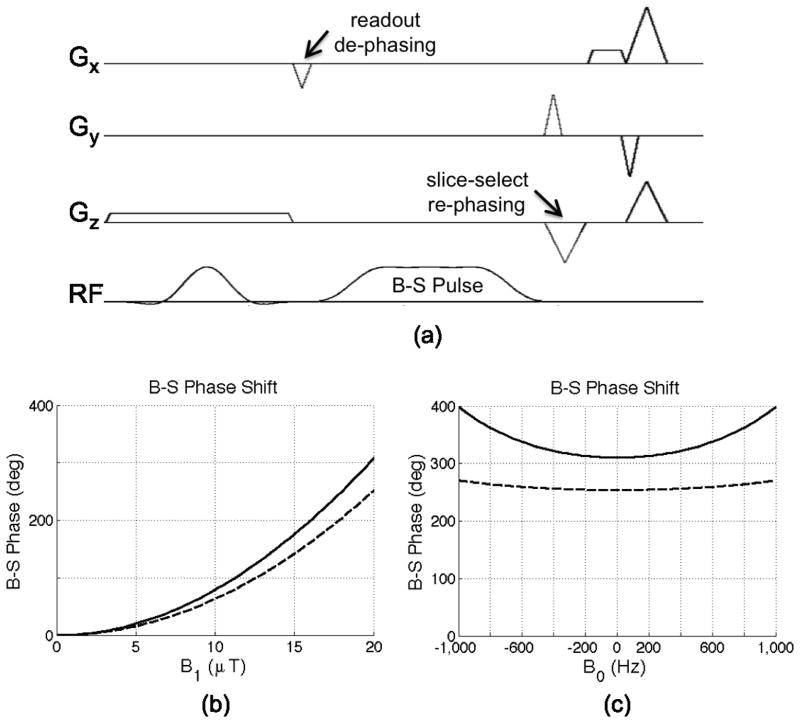
The B-S pulse was integrated into a conventional gradient echo pulse sequence (?) and is shown in Fig 3-a. To minimize artifacts due to on-resonant excitation by the B-S pulse, crushers were added before and after B-S pulse, thus spoiling any signal excited by the B-S pulse. This was implemented by moving the de-phasing part of the readout gradient before the Bloch-Siegert pulse. In addition the slice-select re-phaser is moved after the Bloch-Siegert pulse for the same purpose. The amplitude of B-S pulse was also chopped, i.e. inverted on each new phase encode (producing a B-S phase offset alternation of π radians with respect to excitation) so that any artifact would appear as an N/2 ghost.
Figure 3.
(a) B-S pulse sequence using 4 ms off-resonance Quad pulse. (b) B-S phase dependence on B1;max (B0 = 0 Hz), and (c) B-S phase dependence on B0 (B1;max = 20 μT) for both 4 ms Quad (solid line) & 6 ms Fermi (dashed line) pulses.
Using this modified gradient echo sequence, a 4 ms optimized B-S pulse with frequency offset of 1.96 kHz and a 6 ms Fermi pulse with frequency offset of 4 kHz were compared for mapping on a 7T scanner (GE Healthcare, Waukesha, WI). The 4 kHz offset 6 ms Fermi pulse was chosen as a reference since it was used in the original description of the B-S mapping method (?). Phantom studies, using a 1% copper sulfate head-neck phantom, were acquired using the following parameters: TR=50 ms, flip angle=40 deg, FOV=24 cm, thickness = 5 mm and 64 × 64 matrix. The minimum TE was 7.1 ms for the optimized pulse and 9.1 ms for the Fermi pulse. The mapping sequence was repeated 20 times for each pulse from which dataset mean and angle-to-noise ratio maps were computed with noise defined as the standard deviation computed across the 20 repeats. The nominally symmetric off-resonant pulses were then both shifted up or down by 600 Hz to simulate B0 off-resonance effects. The two Bloch-Siegert pulses were also compared on a volunteer with the same sequence with the exception of a longer TR (TR=150 ms). The volunteer was scanned in accordance with institutional review board guidelines for in vivo research, and provided informed consent.
RESULTS
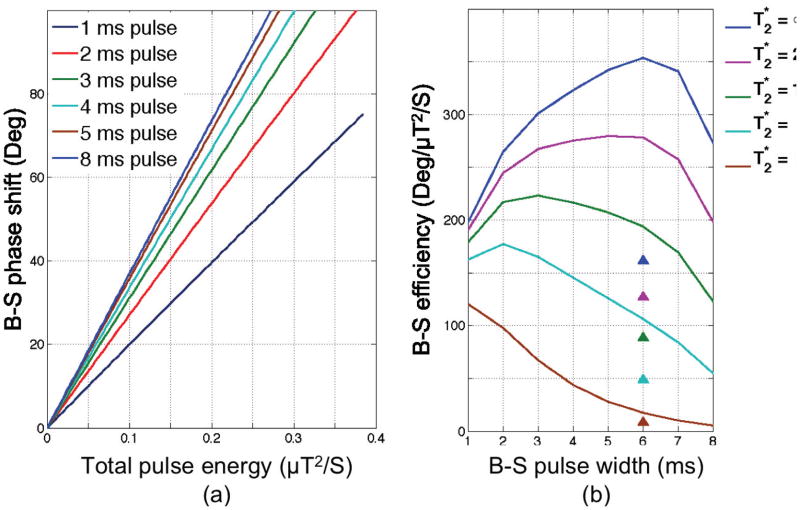
To investigate the effect of B-S pulse width, a series of optimized pulses with pulse widths from 1–8 ms were designed assuming a peak B1;max of 20 μT. Figure 2a shows the B-S phase shift as a function of pulse energy for each pulse showing the expected decrease in B-S phase shift for a fixed pulse energy as pulse width decreases (i.e. due to an increase in offset frequency for shorter pulses). As can be seen from Figure 2a, the B-S phase shift is approximately linearly proportional to the B-S pulse energy. To find the best B-S pulse width, the total B-S efficiency, defined as the B-S phase shift divided by the pulse energy and scaled by the factor , is plotted as a function of B-S pulse width in Figure 2b and parameterized by . The efficiency of a 6 ms Fermi pulse at 4 kHz off-resonance (?) is shown by the triangle symbols for reference. According to (?), the average value at 7T is 25 ms for gray matter. So a 4 ms pulse width is a good choice assuming that the average brain tissue value is 25 ms or less (in areas with higher B0 inhomogeneity), although this plot shows that pulse widths of 2 ms or lower might provide better performance in regions of shortened while maintaining reasonable performance in longer regions.
Figure 2.
(a) B-S phase shift of the optimized pulse vs. the pulse energy for different pulse widths. (b) Normalized sensitivity of optimized B-S pulse with different pulse widths parameterized by values. The triangle symbols show the corresponding efficiency for a 6 ms Fermi pulse.
Figure 3-b, c shows the Bloch-Siegert phase shift as a function of and B0 for both 4 ms quadratic programming optimized ”Quad” and 6 ms Fermi pulses. The 4 ms Quad pulse has 22% more B-S phase shift compared to the 6 ms Fermi pulse at B1;max = 20 μT, which will result in 22% increase in the ANR map.
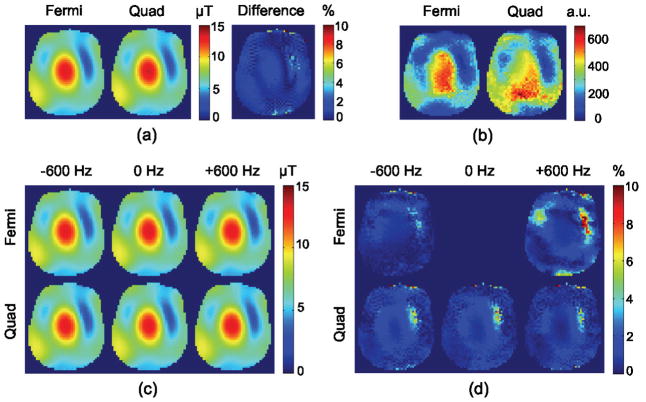
The Bloch-simulated phase-shift dependence on both and B0 is tabulated in a 2D lookup table, from which maps are calculated given the measured B-S phase shift and an acquired B0 map. Mean maps produced by the 4 ms Quad and 6 ms Fermi off-resonant pulses and acquired from the head/neck phantom are shown in Figure 4a. The difference between the maps produced by these two pulses is less than 10% everywhere and in the areas with higher SNR is less than 2%. ANR maps produced with the 4 ms Quad and 6 ms Fermi B-S pulses are shown in Figure 4b demonstrating that the 4 ms Quad pulse generates a higher ANR map compared to the 6 ms Fermi pulse; however, the patterns are slightly different because the B0 effect is not the same for each pulse due to their different resonance offsets (1.96 kHz for 4 ms Quad pulse vs. 4 kHz for 6 ms Fermi pulse). Figure 4c shows the effect of B0 offset (+600 Hz, 0 Hz, −600 Hz) for both Fermi and Quad B-S pulses. The difference between the maps by these two pulses with different B0 offsets, shown in Figure 4d, is less than 2% in the areas with higher SNR and shows that the method used to derive values from the Quad B-S pulse phase-shift maps accurately compensates for B0 inhomogeneity.
Figure 4.
(a) Average of map with Fermi and Quad pulses along with the difference map. (b) ANR of with Fermi and Quad pulses. (c) Block Siegert maps at various B0 values, and (d) corresponding difference maps from a map obtained by Fermi pulse at 0 Hz. The difference is less than 2% in the areas with higher SNR and shows that the method used to derive values from B-S phase shift map is accurately compensating for B0 inhomogeneities.
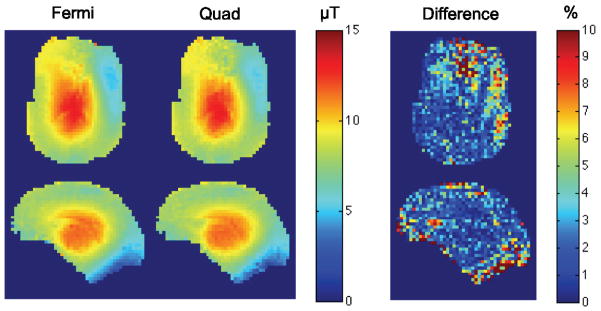
Figure 5 shows the comparison between Quad and Fermi B-S pulses in axial and sagittal planes of a volunteer brain. The difference between the maps for these two pulses, similar to the phantom case, is less than 10% everywhere and in the areas with higher SNR is less than 2%.
Figure 5.
Axial and sagittal maps of brain with Fermi and Quad pulses along with the difference map. The difference between the maps is less than 10% everywhere and in the areas with higher SNR is less than 2%.
DISCUSSION
Bloch-Siegert mapping has been shown to be fast, accurate and largely insensitive to tissue properties; however, a recognized limitation of this method is that it suffers from long TE and high power deposition due to the long, high-amplitude off-resonant RF pulse used to create the B-S phase shift. To address this problem, we have introduced a new method for the design of optimized shorter RF pulses which produce the maximum B-S phase shift constrained by pulse width, peak , and a specified ripple (tolerable excitation) within the on-resonant band.
On-resonant excitation produced by the B-S pulse applies to the entire volume that sees the RF transmit field and must therefore be carefully managed. We found that a 1% threshold for in-band excitation, coupled with crushers at appropriate locations around the B-S pulse, was effective in limiting the N/2 ghost artifact that would be produced by this signal. However, it is possible that this spoiling scheme might have introduced some motion-sensitivity. This sensitivity will decrease for a shorter B-S pulse, and thus induce less motion-dependent phase shift. This effect may explain the slight changes in contrast between CSF and surrounding brain that we see for maps acquired with the different B-S pulses in Fig. 5.
It is shown that the optimal choice of the B-S pulse width depends on the value of , since there is a trade-off between B-S phase shift produced by longer pulses and signal loss due to the resulting longer TE. This means that the optimum pulse width will vary based on the field strength and the region of interest. For instance, a 4 ms pulse might be good for the most of the brain at 7T but for areas close to sinuses where B0 homogeneity is typically poor, a shorter pulse (~1–2 ms) will generate better maps.
In the proposed design, by maximizing the B-S phase shift for a given pulse width a better ANR is achieved. This additional ANR can be traded for lower B-S pulse amplitude, which in turn decreases the RF deposition or SAR. In other words, by optimizing the B-S pulse, SAR can be minimized while holding the quality of the map constant, which in turn, in a SAR limited regime, will lead to shorter repetition times (TR) and therefore shorter scan times. The comparison between a 4 ms optimized pulse designed by the proposed method and the conventional 6 ms Fermi pulse shows that the 4 ms optimized pulse is 2–3 times more efficient than the 6 ms Fermi pulse (depending on ). This increased efficiency could be traded off for either faster scans or better ANR maps. These two pulses were compared on phantom and human brain and it was shown that the agreement between maps is on the order of 1%. We have also shown that the 4 ms Quad pulse generates better ANR at 35% less SAR than the 6 ms Fermi pulse. Because the optimized pulses are generally closer to the on-resonant frequency than the 6 ms Fermi pulse (especially for pw > 2 ms), they are more sensitive to B0 changes and therefore a B0 map acquisition is generally required to produce an accurate map. For pulses with pw < 2 ms, the offset frequency is in the same range as for the 6 ms Fermi pulse and the same approximation for B0 that is used in (?) can be used here as well. The B0 map acquisition is typically not an additional burden in our case as this is already required for other quantitative studies.
The design method that is presented first uses the small-tip linear approximation to design the RF pulse followed by a Bloch simulation to adjust the stopband edge to account for the approximation errors. While nonlinear RF pulse design methods such as optimal control (?) could be used to avoid this inaccuracy, the stopband edge adjustments were typically less than 10% of FWHM so we would not expect any significant improvement in performance from adopting such a design approach.
CONCLUSIONS
We have introduced a new method for the design of Bloch-Siegert pulses with maximum efficiency subject to a specified constraint on on-resonance excitation, and compared its efficiency, ANR and SAR to the originally published 6 ms Fermi B-S pulse. We have also introduced sequence modifications to improve the spoiling of transverse magnetization produced by unwanted excitation of magnetization by B-S pulse. This new methodology has led to substantially decreased echo time and SAR at comparable (or better ANR) compared to the conventional B-S used in (?), and has resulted in considerable improvement in mapping using the B-S method.
Acknowledgments
This work was supported by NIH-R01EB008108, NIH-R01EB005307, NIH-P41RR09784 and GE Healthcare.
We thank Dr. Manojkumar Saranathan and Dr. Anja Brau for their insightful discussions and help.


