

Abstract
Systematic studies of cardiac structure-function relationships to date have been hindered by the intrinsic complexity and variability of in vivo and ex vivo model systems. Thus, we set out to develop a reproducible cell culture system that can accurately replicate the realistic microstructure of native cardiac tissues. Using cell micropatterning techniques, we aligned cultured cardiomyocytes at micro- and macroscopic spatial scales to follow local directions of cardiac fibers in murine ventricular cross sections, as measured by high-resolution diffusion tensor magnetic resonance imaging. To elucidate the roles of ventricular tissue microstructure in macroscopic impulse conduction, we optically mapped membrane potentials in micropatterned cardiac cultures with realistic tissue boundaries and natural cell orientation, cardiac cultures with realistic tissue boundaries but random cell orientation, and standard isotropic monolayers. At 2 Hz pacing, both microscopic changes in cell orientation and ventricular tissue boundaries independently and synergistically increased the spatial dispersion of conduction velocity, but not the action potential duration. The realistic variations in intramural microstructure created unique spatial signatures in micro- and macroscopic impulse propagation within ventricular cross-section cultures. This novel in vitro model system is expected to help bridge the existing gap between experimental structure-function studies in standard cardiac monolayers and intact heart tissues.
Introduction
The natural, anisotropic structure of healthy cardiac tissue guides the coordinated electrical propagation and mechanical contraction of the heart. Likewise, abnormalities in cardiac structure caused by different types of heart disease or congenital defects are known to affect the initiation, maintenance, and termination of lethal cardiac arrhythmias (1–4). Understanding how normal and abnormal micro- and macroscopic tissue structure contributes to the electrical function and dysfunction of the heart is therefore of crucial importance in the development of antiarrhythmic therapies. To date, experimental studies have mainly provided insights into the roles of 1), tissue macrostructure (large obstacles and anisotropy) in macroscopic impulse propagation and reentry (5–7); and 2), specific microstructural features (small obstacles and local tissue branching) in microscopic impulse propagation (8–11). However, the complex roles of healthy or remodeled microstructure in the heart (e.g., cardiac fiber directions) in intramural impulse conduction and reentry dynamics remain to be elucidated.
One of the main obstacles in performing such structure-function studies has been the lack of experimental model systems that can provide reproducible, readily accessible, and well-controlled cardiac tissue structure along with direct functional feedback. In particular, studies in intact cardiac tissues (in vivo or ex vivo) are currently limited by the inability to simultaneously assess three-dimensional (3D) electrical propagation along with the microscopic details of the underlying tissue structure. Even if this were possible, the intrinsic lack of reproducibility of structure and function in natural tissues would complicate systematic correlations between electrical and structural measurements across different hearts. Furthermore, the natural spatial heterogeneities in ion channel expression throughout the heart can confound studies of purely structural effects on impulse conduction. Therefore, ideal cardiac preparations for systematic structure-function studies should exhibit spatially uniform functional properties along with tissue structure that is simplified, reproducible, and controllable. In vitro models of cardiac tissue, specifically monolayer cultures of ventricular cells, can provide the necessary geometrical and functional simplifications while allowing direct quantitative assessment of structure-function relationships.
Neonatal cardiomyocytes in culture exhibit relatively uniform ion channel properties and can be readily micropatterned with controllable location, orientation, and cell shape by depositing defined patterns of extracellular matrix proteins onto tissue culture substrate. Such methods have been used to design cardiac monolayers with defined single-cell or cell-pair geometries (12,13), branching or nonbranching strands (8,14,15), abrupt tissue expansions (9,16), acellular obstacles (17), varying anisotropy ratios (18), and varying cellular compositions (19,20) in an effort to study phenomena ranging in scale from microscopic (e.g., cell adhesion and contraction, and intercellular connectivity) to macroscopic (e.g., conduction block and reentry). Furthermore, advances in optical mapping techniques (9,21–23) have enabled investigators to directly relate impulse propagation in monolayers to their underlying cellular architecture, thereby providing invaluable insight into the relationships between the structural and electrical properties of cardiac tissue. Currently, cardiac monolayers designed for studies of macroscopic impulse propagation and reentry (>1 cm2 scale) represent structural and functional intermediates between the single cell and intact tissue, but they typically consist of randomly oriented cells (21,24–26) or cells uniformly aligned in a single direction (27,28).
Natural myocardial tissue, on the other hand, is arranged as a network of aligned fibers and sheets that continuously rotate transmurally from the epicardium to the endocardium (29–31). Systematic characterization of the complex cardiac anatomy has been achieved due, in part, to the inception of diffusion tensor magnetic resonance imaging (DTMRI). In a number of studies, DTMRI has been validated as an accurate, noninvasive, high-resolution technique to measure cardiac fiber directions microscopically in three dimensions (32–35) and has been applied to image both healthy and diseased hearts of numerous species (36,37,39), including human (40).
Therefore, the goal of this study was to establish a novel in vitro model system aimed at bridging the structural gap between simplified isotropic or uniformly anisotropic cardiac monolayers and native myocardial tissue. In particular, for the first time to our knowledge, cell micropatterning techniques were combined with a clinical imaging modality (DTMRI) to design cardiac cell monolayers that replicate the natural fiber directions and anatomical details of murine ventricular cross sections with microscopic resolution. We validated the spatial accuracy and reproducibility of this methodology and performed preliminary optical mapping studies to elucidate the roles of realistic tissue structure in electrical propagation, specifically spatial distributions of conduction velocity (CV) and action potential duration (APD). We show that both local changes in cell orientation and realistic tissue boundaries independently and synergistically create unique micro- and macroscopic spatial signatures in electrical propagation. The use of this methodology is envisioned for future studies of the roles of realistic healthy and remodeled cardiac tissue structure in the generation of conduction block, formation and termination of functional and anatomical reentry, and outcomes of electrical shock.
Materials and Methods
Micropatterning and substrate preparation
Local cardiac cell alignment on the (two-dimensional) 2D substrate was guided by micropatterned parallel lines of fibronectin as previously described (18). Briefly, micropatterns were drawn using custom AutoLISP software in AutoCAD (Autodesk, San Rafael, CA) to print high-resolution photomasks (chrome on soda-lime; Advance Reproductions, North Andover, MA). With the use of standard soft lithography techniques, the patterns were microfabricated in a 5 μm layer of photoresist (SU8-10; Microchem, Newton, MA) spin-coated onto a silicon wafer (WaferWorld, West Palm Beach, FL). Poly-dimethylsiloxane (PDMS, Sylgard 184; Dow Corning, Midland, MI) molds were cast from the microfabricated pattern at 80°C for 2 h, cleaned in ethanol, inked with fibronectin (50 μg/mL in H2O) for 1 h, and dried with N2 gas. The fibronectin micropattern was microcontact-printed from the PDMS stamps onto UV-ozone treated, PDMS-coated 22 mm glass coverslips for 30 min to allow protein transfer.
Optimization of cardiomyocyte alignment and confluence
Micropatterns were first designed to evaluate the ability of cardiac cells to form confluent, aligned cultures and adjust to local changes in direction of the underlying fibronectin lines. In particular, parallel fibronectin lines were patterned in square regions (“pixels”) of varying size (45–315 μm) and at angles of 10–90° relative to parallel lines in the surrounding area. Based on our previous studies (18), a range of line widths and spacings (10–20 μm and 2–10 μm, respectively) were tested to maximize local cellular alignment and confluence along the patterned fibronectin lines. Additionally, the fibronectin-patterned coverslips were coated with a range of surfactant concentrations (0–0.2% Pluronic F-127 in H2O) to find conditions that would eliminate unwanted cell adhesion beyond patterned boundaries during seeding (41) while allowing transverse cardiomyocyte spreading across adjacent fibronectin lines over time in culture (42). Once substrate conditions for confluent anisotropic cell growth were optimized, fiber angle validation (see below) was applied for each pixel size and relative angle to measure the deviation of cell alignment from the direction of underlying fibronectin lines.
Micropatterned ventricular cross sections
Three-dimensional DTMRI-measured maps of local cardiac fiber directions of a mouse ventricle were obtained from Dr. Edward Hsu (39). For select ventricular cross sections (Fig. 1 A), local fiber directions in each 78 × 78 × 78 μm3 cube of tissue (“voxel”) were projected onto 2D pixels using custom MATLAB software (The MathWorks, Natick, MA). To replicate natural fiber directions in cell culture, the resulting in-plane angle maps (Fig. 1 B) were loaded into AutoCAD and photomasks were designed by converting each angle map pixel into a pixel of angled parallel lines (Fig. 1 C). Patterned silicon wafers and PDMS stamps were produced as described above, and resulting fibronectin patterns were microcontact-printed to microscopically guide the local alignment of cells, ultimately yielding micropatterned ventricular cross sections with anisotropic cell orientation, termed micropatterned anisotropic slice (AS) cultures. For electrophysiological comparisons, corresponding isotropic slice (IS) cultures were micropatterned using identical photomasks with solid, rather than lined, pixels (Fig. 1 D) to produce the same tissue boundaries with randomly oriented, rather than aligned, cells. In addition, standard isotropic control (IC) cultures with circular boundaries and randomly oriented cells (Fig. 1 E) were prepared by simply coating nonprinted coverslips with fibronectin (25 μg/mL in H2O) for 2 h (24,25).
Figure 1.
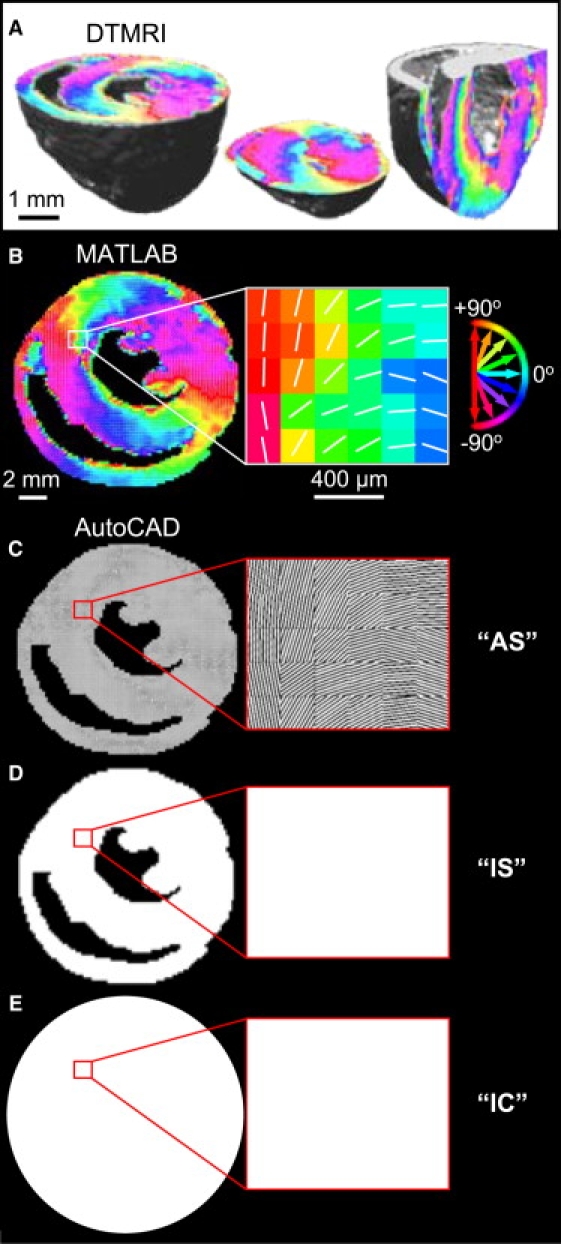
Design of photomasks for microfabrication. (A) DTMRI-measured in-plane fiber directions of three murine ventricular cross sections, shown using the circular color map from B. (B) Angle map of a transverse ventricular cross section in MATLAB. For each pixel, the white line and pixel color denote the fiber direction and angle relative to the x axis, respectively. (C) Corresponding AS micropattern in AutoCAD, where the angle map was converted to a pixilated array of angled parallel lines. (D) Corresponding IS micropattern with identical macroscopic boundaries but solid, rather than lined, pixels. (E) Standard IC coverslips with circular boundary. White regions in C–E correspond to fibronectin-printed areas on the coverslip used to guide cell adhesion and local alignment.
Cell culture
All animals were treated according to protocols approved by the Duke University Institutional Animal Care and Use Committee. Neonatal Sprague-Dawley rat ventricular cells were enzymatically isolated using trypsin and collagenase, as previously described (18). Two 1 h differential preplatings were used to remove the faster-attaching cardiac fibroblasts. The remaining cells, enriched with cardiomyocytes, were plated on fibronectin-patterned coverslips (1300 cells/mm2) in culture media comprised of M199 medium (Gibco, Carlsbad, CA) supplemented with 10% fetal calf serum, 10% horse serum, 1% HEPES, 1% MEM nonessential amino acids, glucose (4 mg/mL), L-glutamine (0.3 mg/mL), vitamin B12 (2 μg/mL), and penicillin-G (20 U/mL). On culture day 2, the 20% serum in the culture media was switched to 2% fetal bovine serum to limit unwanted fibroblast proliferation and promote cardiac cell differentiation (43).
Immunofluorescence
The quality of the microcontact printing, and the cardiomyocyte density, alignment, and connectivity were assessed using immunostaining, as previously described (18). Briefly, cultures were fixed, permeabilized, blocked, and incubated with primary antibodies for 1 h (anti-sarcomeric α-actinin and anti-connexin43; Sigma, St. Louis, MO) followed by secondary antibodies (Molecular Probes, Eugene, OR) and/or stains (DAPI, FITC-conjugated phalloidin, or fibronectin; Sigma) for 1 h. Images were acquired with an inverted microscope (Nikon TE2000-U, Melville, NY) and CCD camera (Sensicam QE; Cooke Corp., Romulus, MI) using IPLab image acquisition software (Scanalytics, Rockville, MD).
Fiber angle validation
Micropatterned cell cultures were immunostained for F-actin, aligned on a programmable microscope stage, and automatically scanned over the entire area (10× magnification, autofocus, and autoexposure) using custom Metamorph macros (Molecular Devices, Sunnyvale, CA). Acquired images were processed one micropatterned pixel at a time (N = 3000–4000 pixels/culture) using custom MATLAB software. The local fiber angle (direction of cell alignment) in each micropatterned pixel was calculated by first applying a Sobel edge-detection filter to the image, then assigning an intensity gradient vector and corresponding angle to each image pixel, and finally summing these angles using circular algebra (44,45). To validate cell alignments in culture against the original DTMRI data, we computed absolute pixel-to-pixel differences between the DTMRI angle map and the measured cell culture angle map. The resulting fiber angle difference map was then compiled over all pixels to produce an angle difference histogram. One coronal and two transverse AS cultures (Fig. 1 A) were analyzed to validate the micropatterning accuracy for different combinations of local fiber directions and gross anatomical features.
Optical mapping of membrane potentials
Electrical propagation was mapped in ICs and transverse AS and IS cultures using a hexagonal array of 504 optical fibers (RedShirt Imaging, Decatur, GA) with a spatial resolution of 750 μm (see Fig. S1 in the Supporting Material) (20). As previously described (18), cultures were thoroughly inspected before and after optical mapping, and discarded if holes or fibroblast regions >50 μm in size were found. For optical mapping, cultures were incubated at room temperature with a voltage-sensitive dye (Di-4 ANEPPS, 16 μmol/L) for 5 min, transferred to a custom-made, thermo-regulated recording chamber, and illuminated by a tungsten light source (250W, λ = 520 ± 30 nm; Oriel, Stratford, CT). To limit cell phototoxicity, light exposure was synchronized with data acquisition and electrical stimulation using LabView (National Instruments, Austin, TX). Red fluorescence (λ > 590 nm) was collected by the fiber-optic array, converted to voltage by photodiodes, sampled at 2.4 kHz, and saved to a PC. A micromanipulated bipolar platinum point electrode was used to locally stimulate cultures (18).
Experimental protocol
To explore different propagation patterns in AS and IS cultures, bipolar point stimulation (1.2× threshold, 10 ms duration) was applied to four culture sites (one at a time): the central edge of the left ventricular (LV) free wall, center of the septum, center of the right ventricular (RV) free wall, and anterior edge between the LV free wall and septum. For each pacing site, the final 3 s of 1 min of stimulation at a basic pacing rate of 2 Hz was recorded. The order of the four pacing sites was randomly varied with each new culture. For standard IC cultures, the protocol was applied using a single pacing site in the center of the monolayer.
Data analysis
Signals from the 504 recording sites were detrended by fitting and subtracting a 2nd-order polynomial and temporally filtered using a 20-sample median and a 200th-order finite impulse response 60 Hz low-pass filter (representative raw and filtered signals are shown in Fig. S1 C). Active recording sites, corresponding to cellular regions of the coverslip, were identified based on the higher fluorescence levels relative to acellular regions. Activation times were defined as times of maximum action potential upstroke, expressed relative to the earliest activation time, and used to construct isochrone maps of propagation. Spatial maps of local CV were calculated using activation times for each recording site relative to those of the neighboring sites, as previously described (25). Spatial maps of the APD were constructed by defining APD as the interval from activation time to recovery time at 80% repolarization (18). To average these spatial maps across corresponding IS or AS cultures, active recording sites from each culture were collectively rotated and translated to maximize the spatial overlap with their common DTMRI angle map. Subsequently, each pixel in the DTMRI map was assigned a corresponding activation time, CV, and APD by nearest-neighbor interpolation. This spatial registration of different functional data sets onto known underlying tissue structure allowed us, for each pacing site, to stack data from different monolayers and derive an ensemble average spatial map of propagation. These maps were used to directly compare, at micro- and macroscopic spatial scales, structure-function relationships for different culture settings and pacing sites. Furthermore, the ensemble averaging served to reduce random noise present in spatial maps from individual cultures.
In addition, histogram plots were used to illustrate the distributions of local CVs and APDs around the mean for propagating waves in each culture. The spatial dispersions of CV (indicating heterogeneous conduction) and APD (indicating heterogeneous repolarization) were quantified using the coefficient of variation (CV), i.e., the ratio of the standard deviation (SD) to the mean of all CV or APD values in culture (CVSD/CVmean or APDSD/APDmean). Local angle differences between the direction of wave propagation and the direction of underlying cell alignment, termed Φ, were illustrated for each DTMRI pixel in AS cultures using spatial Φ maps. Individual CV and APD values from the selected regions in ensemble averaged maps were then plotted against corresponding Φ values (pooled every 1°). All analyses were performed using custom-designed software in MATLAB and C.
Statistics
Data are reported as mean ± SD across all recordings for each group and were analyzed using a one-way analysis of variance followed by post hoc Tukey's t-test. Differences were considered significant for p < 0.05.
Results
Optimization of cardiomyocyte confluence and alignment
In previous studies, we showed that neonatal rat cardiomyocytes align along 12 μm wide and 12 μm spaced fibronectin lines, and occasionally bridge between the lines to yield longitudinal clefts of different lengths. To facilitate cell spreading into the clefts and yield the formation of confluent anisotropic cultures, patterned coverslips were coated with a low background concentration of fibronectin. This approach was unsuitable for creating anisotropic ventricular slice cultures in this study because background fibronectin coating also resulted in subconfluent cell adhesion outside patterned regions of the coverslip (i.e., outside the tissue boundaries). Therefore, we varied fibronectin line widths and spacings as well as the concentration of a cell-repelling surfactant, Pluronic F-127, to optimize cardiomyocyte confluence and alignment on the patterned lines while avoiding cell adhesion in the unpatterned areas. In addition, a high serum concentration (20%) was applied for the first 2 days of culture to facilitate dense cardiomyocyte seeding along the fibronectin lines, followed by rapid transverse spreading between the lines to prevent the overgrowth of contact-inhibited fibroblasts. For all studied fibronectin line spacings (2–10 μm), the use of Pluronic coating limited transverse cell confluence. Furthermore, although wider line spacings (>6 μm) resulted in reduced transverse cardiomyocyte connectivity and eventual fibroblast overgrowth, very narrow spacings (<3.5 μm) and/or wider fibronectin lines increased cardiomyocyte deviation from the attempted alignment, eventually yielding isotropic cell growth. Optimal cardiomyocyte confluence and alignment were achieved with 18.5 μm wide and 4.5 μm spaced fibronectin lines and no Pluronic coating. These culture conditions were applied in all remaining experiments.
Cardiomyocyte ability to undergo sharp changes in alignment
In our previous study (18), we showed that neonatal rat cardiomyocytes were able to abruptly (over ∼60 μm distance) change their direction of macroscopic alignment without loss of confluence. In the study presented here, we further tested cardiomyocytes for their ability to locally align (at microscopic scale) to different angles relative to surrounding cells. As shown in Fig. 2, cells successfully aligned within patterned pixels of different size as well as in surrounding areas without loss of confluence or connectivity (assessed by connexin43 staining). Furthermore, the cells exhibited relatively smooth transitions in alignment between the pixels and the surrounding areas, despite the abrupt (discontinuous) changes in direction of the micropatterned fibronectin lines. As expected, the angle difference between resultant and attempted cell alignments increased with smaller pixel size and higher attempted angle (Fig. 2 C). For example, for the smallest pixel size (45 × 45 μm2) and highest attempted angle of cell alignment (90° relative to surrounding area), cardiomyocytes within the pixel coaligned with surrounding cells without responding to the underlying fibronectin lines, thus yielding the maximal 90° angle difference. Conversely, cells in the largest pixels (315 × 315 μm2) closely followed the orientation of underlying fibronectin lines for all attempted angles, thus yielding negligible angle differences (Fig. 2 C, first row).
Figure 2.
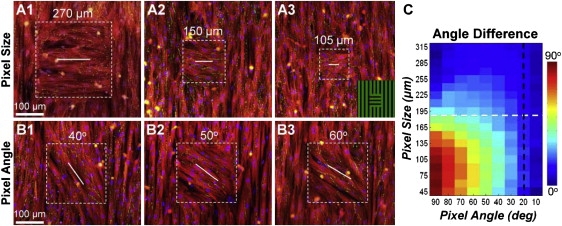
Control of microscopic cardiomyocyte alignment. (A.1–3) Local cell alignment perpendicular to that of the surrounding area, shown for pixels of different size (square regions delineated by dashed box). Inset in A.3 shows the underlying pattern of fibronectin lines (green). (B.1–3) Local cell alignment within 205 μm pixels at different angles relative to vertical cell alignment in the surrounding area. Red, sarcomeric α-actinin; green, connexin43; blue, nuclei. White lines denote the direction of underlying fibronectin lines inside the pixels. (C) Angle differences between the direction of aligned cells and underlying fibronectin lines for different pixel sizes and angles of fibronectin lines relative to those in the surrounding area (average of N = 5 cultures). Black dashed line denotes the range of angle gradients (0–20°/pixel) exhibited by 90% of pixels from the maps shown in Fig. 1A. White dashed line denotes pixel size of 190 μm used for cell micropatterning in slice cultures.
Furthermore, analysis of the DTMRI angle maps of ventricular cross sections (Fig. 1) revealed that 90% of pixels in all maps exhibited local changes in fiber direction (angle gradients) of <20°/pixel. As seen in Fig. 2 C, for this range of gradients (to the right of the black dashed line), the use of any pixel size (45 × 45 to 315 × 315 μm2) to design the micropatterned slice cultures would be expected to yield local cell alignments in good agreement with the original DTMRI fiber directions. In particular, the 190 × 190 μm pixel size (white dashed line in Fig. 2 C) was expected to yield cell alignment that would differ from DTMRI angles by <13.7° (intersection of black and white lines in Fig. 2 C) in 90% of micropatterned pixels. The 190 μm pixel size was selected for cell micropatterning because expected errors compared to DTMRI data were minimal and it would yield a maximum slice culture diameter of ∼80 pixels × 190 μm = 15.2 mm. This diameter was expected (as characteristic in natural ventricles) to be comparable to the average wavelength of a single propagating wave, which in our isotropic and uniformly anisotropic cultures was previously measured to be 15–16 mm. In addition, an entire slice culture of this size could be simultaneously mapped within the field of view of our optical mapping setup (Fig. S1).
Structural assessment of micropatterned slice cultures
After cell plating in AS cultures (Fig. 3 A), cardiac cells spread and aligned along the individual fibronectin lines in each 190 × 190 μm2 pixel area. Although intercellular gaps and pixel borders were still apparent after 3 days in culture (Fig. 3 B), by day 6 (Fig. 3 C) the cells had spread to confluence and smoothly transitioned between the neighboring pixels, as expected from experiments in single-pixel patterns (Fig. 2). We quantified the continuity of the cardiac fiber transition across pixel-pixel borders for the entire culture by comparing the fiber angle difference between adjacent edges of neighboring pixels with that between the corresponding pixel centers (Fig. S2). By culture day 6, clearly defined acellular chambers and confluent cell areas were apparent at the macroscopic scale (Fig. 3 D). Connexin43 gap junctions formed between aligned cells in both longitudinal and transverse directions (Fig. 3 E). Compared with macroscopically uniform anisotropic monolayers in our previous studies (18), the micropatterned slice cultures exhibited similar cell densities (assessed by nuclear count per unit area) and low nonmyocyte presence (assessed by vimentin immunostaining; data not shown). In IS cultures, the area delineated by the same ventricular tissue boundaries was populated with randomly oriented, confluent cardiac cells.
Figure 3.
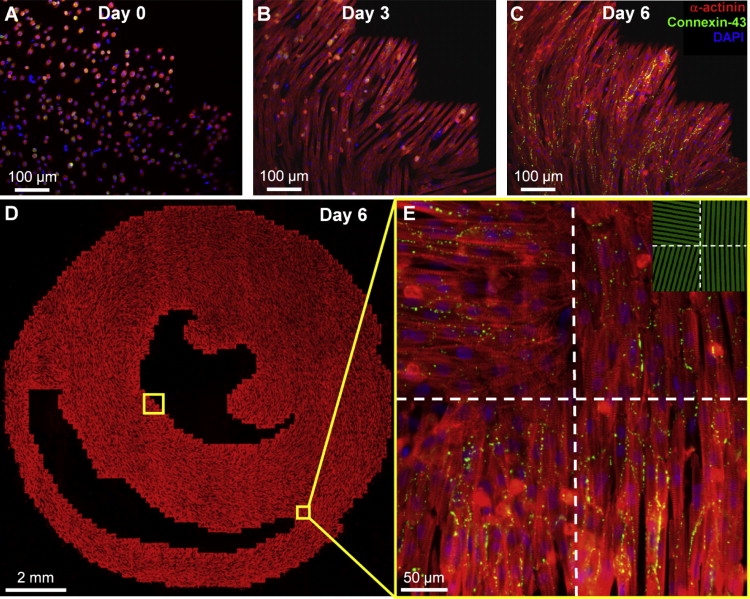
Formation of realistic cardiac microstructure in AS cultures. (A–C) Plated cells were found to attach (A), spread and align along the underlying fibronectin lines (B), and by day 6 (C) form confluent cardiac fibers. (D) Composite image of the entire micropatterned slice culture. (E) Close-up of four adjacent pixels delineated by dashed lines, along with the underlying fibronectin pattern (green, inset). Note abrupt changes in cardiac fiber directions in neighboring pixels without loss of cell confluence.
Validation of local cell alignments against DTMRI maps
Local directions of cell alignment in micropatterned AS cultures were measured on a pixel-by-pixel basis with the use of a programmable microscope stage. As shown in Fig. 4, the original DTMRI fiber angle maps were reproduced with remarkable accuracy for all tested micropatterned slice cultures. Across all pixels and cross sections, the mean absolute angle difference from DTMRI data was 5.6°, which is comparable to that between DTMRI and histological measurements of native heart tissue (32,35). In general, the largest local angle differences between micropatterned slices and DTMRI maps were found in regions with sharp changes in fiber direction (high fiber angle gradients). Furthermore, 90% of pixel angle differences between cell alignment and DTMRI data were <12.7°, in agreement with the value of 13.7° expected from the single-pixel analysis (Fig. 2 C). In contrast, the random local cell directions in ICs and IS cultures (Fig. 1, D and E) differed from DTMRI maps by an average of ∼45°, as expected (not shown).
Figure 4.
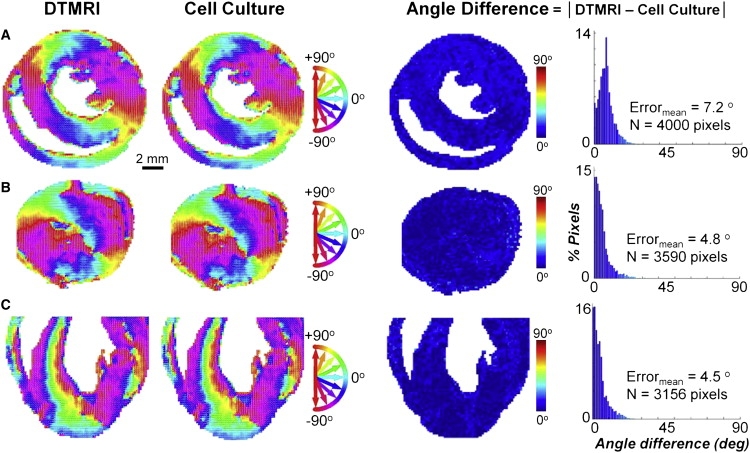
Validation of micropatterning accuracy in AS cultures. DTMRI angle maps (first column), resulting cell culture angle maps (second column), angle difference maps (third column), and corresponding angle difference histograms (fourth column) shown for (A) middle-transverse, (B) apical-transverse, and (C) coronal ventricular sections from Fig. 1A. Circular color map refers to columns 1 and 2; linear color map refers to columns 3 and 4. Note the excellent agreement in microscopic (fiber directions) and macroscopic (tissue boundaries) structural features between cell cultures and corresponding DTMRI-measured ventricular cross sections.
Electrophysiological studies in micropatterned slice cultures
The three distinct culture settings used for electrophysiological studies (IC, IS, and AS) were compared based on optical recordings of action potentials emanating from point stimuli at a basic pacing rate of 2 Hz. As expected with the use of a uniform cell source for all experiments, the mean CV and APD values were comparable in IC (19.79 ± 3.7 cm/s and 81.8 ± 27.3 ms, N = 21 cultures, 21 recordings), IS (20.0 ± 4.7 cm/s and 78.0 ± 23.3 ms, N = 22 cultures, 46 recordings), and AS (20.6 ± 5.1 cm/s and 70.0 ± 13.5 ms, N = 20 cultures, 78 recordings) cultures. Mean impulse wavelengths (APD × CV) were also similar in different settings (16.1, 15.6, and 14.4 mm, respectively) and comparable to the maximum diameter of the slice cultures (15.2 mm).
As revealed by ensemble isochrone maps, pacing at a rate of 2 Hz from the center of standard IC cultures and from all four pacing sites in IS cultures resulted in the expected circular wavefront propagation (Fig. 5, A and B.1–4, Movie S1). In contrast, realistic fiber directions in AS cultures noticeably influenced patterns of wavefront propagation. Specifically, wavefronts propagating along aligned fibers (e.g., through the bulk of the tissue circulating the LV chamber) appeared pointed, which is characteristic of elliptical anisotropic propagation (Fig. 5 C.1–4, Movie S2). Corresponding CV maps revealed regions of higher CV caused by near-simultaneous excitation at the stimulus site (pulse symbol in all cultures in Fig. 6, A–C) or by wavefront collisions (black arrows in IS and AS cultures in Fig. 6, B and C). Consistent with the uniformly distributed isochrone lines (Fig. 5, A and B), CV distributions in IC and IS cultures were found to be relatively uniform (Fig. 6, A and B), with slight reductions of CV observed at abrupt tissue expansions in IS cultures (out of the septum and RV wall in Fig. 6 B.3 and 4). In contrast, consistent with the nonuniformly distributed isochrone lines in AS cultures, a distinct halo of faster longitudinal conduction surrounded the LV chamber with a higher CV was also observed through the RV free wall (Fig. 6 C.2–4). For certain stimulus sites, propagation was also guided transversely across aligned fibers (e.g., through the LV free wall toward the endocardium in Fig. 6 C.1, or through the septum toward the RV in Fig. 6 C.1 and 2) resulting in local conduction slowing.
Figure 5.
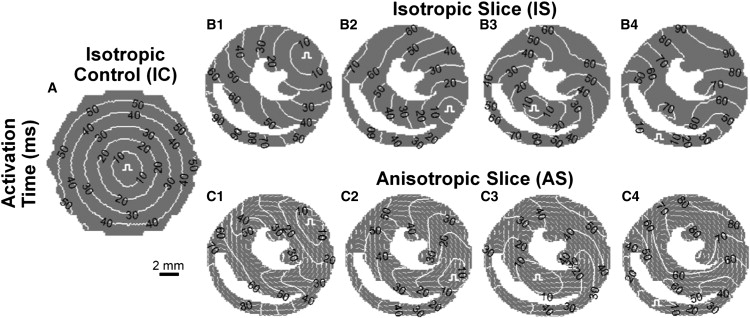
Isochrone maps of impulse propagation in cell cultures. Ensemble average isochrone maps of 2 Hz activation in (A) ICs with stimuli applied at the center, as well as (B) isotropic and (C) AS cultures with stimuli applied at each of the four pacing sites. Pulse symbols denote pacing sites. Underlying quivers in AS cultures in C denote cardiac fiber directions. Note the predominantly circular, uniformly spaced activation patterns in all isotropic cultures (IC and IS) and elongated, lobed activation patterns in AS cultures. Movies of action potential propagation in IS and AS cultures are included in the Supporting Material (Movies S1 and S2).
Figure 6.
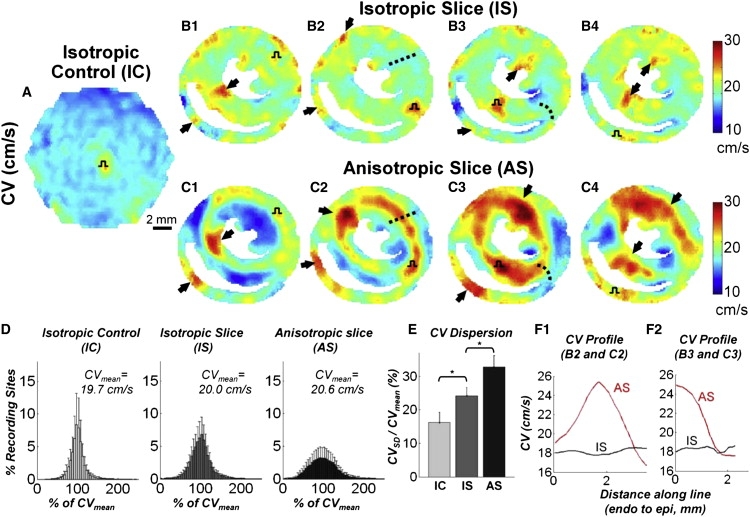
CV maps during impulse propagation in cell cultures. Ensemble average CV maps in (A) ICs with stimuli applied at the center, as well as (B) IS and (C) AS cultures with stimuli applied at each of the four pacing sites. Pulse symbols denote pacing sites. Black arrows indicate regions of collision-induced increases in CV. Note the generally uniform spatial CV distribution in isotropic cultures (IC and IS) and halo of faster conduction around the LV in anisotropic cultures (AS) as well as faster conduction in the RV free wall. (D) CV histogram distributions (% of mean) and (E) corresponding CV dispersions (N = 21, 22, and 20 cultures with 21, 46, and 78 recordings, respectively). Asterisk denotes significant difference with p < 0.05. (F) CV magnitude profiles along the dashed lines in B.2 and C.2 (F.1), and in B.3 and C.3 (F.2) from endo- to epicardium. Local fiber directions around the dashed lines are shown in Fig. S3, G and H.
To quantify the overall nonuniformity of conduction for different culture settings, we constructed histograms of local CVs and determined dispersions relative to the mean. Although the position of the pacing site significantly affected local CVs in slice cultures (especially AS cultures), the resulting changes in total CV dispersion for different pacing sites within the same culture type were negligible (±3%), and therefore dispersion data for all four pacing sites were combined. As shown in Fig. 6 D, in all three culture settings, local CVs during 2 Hz stimulation were distributed around the mean in a symmetric, Gaussian fashion. However, the intrinsic CV dispersion in IC cultures (CVSD/CVmean = 16.3 ± 6.0%) was found to increase with the introduction of realistic tissue boundaries in IS cultures (to 24.2 ± 4.7%) and further increase with the introduction of realistic cell orientations in AS cultures (to 32.8 ± 6.9%; Fig. 6 E). The local influence of natural cell orientations (realistic tissue microstructure) on the intramural CV pattern became more apparent when CV profiles along specific paths were illustrated. For example, wavefronts originating from the anterior septum of IS cultures propagated evenly through the LV free wall, resulting in a relatively constant transmural CV profile (Fig. 6 F.1). In contrast, faster (longitudinal) propagation through the mid-myocardium and slower (transverse) propagation toward the endo- and epicardium in AS cultures yielded a monophasic CV profile along the same path (Fig. 6 F.1, fiber angle map shown in Fig. S3 G). Similarly, wavefronts initiated in the center of the septum of IS cultures exhibited relatively even CV profiles as they split into the RV and LV, despite the geometric source-load mismatch at the septum exit. In contrast, when pacing from the same site, CVs in AS cultures exhibited a significant local drop toward the RV due to a sharp U-turn in cell orientation experienced by wavefronts exiting the septum (see Fig. 8 F.2 and the fiber angle map in Fig. S3 H).
Figure 8.
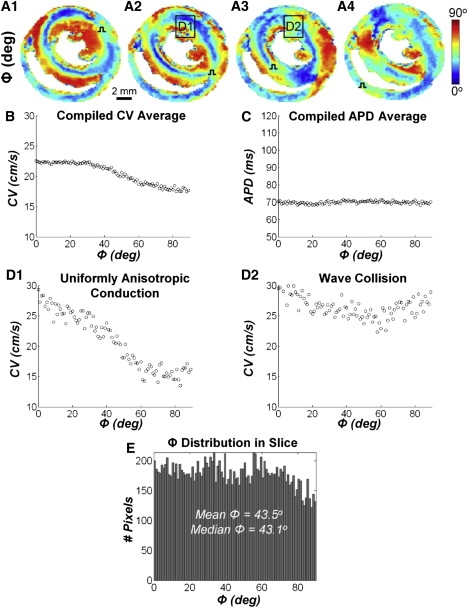
Dependence of local CV on angle (Φ) between direction of propagating wave and underlying cell alignment. (A.1–4) Distinct Φ maps result from pacing at each of the four sites in AS cultures. Data combined for all pixels and all pacing sites reveal significant effects of Φ on the magnitude of local CVs (B) but not APDs (C). For each Φ value (shown in 1° increments), the circle represents an average of all local CV(Φ) or APD(Φ) values. (D) CV versus Φ plots in subregions denoted by boxes in A.2 and A.3. Note that the strong dependence of local CV on the directions of propagation relative to the underlying cell alignment in one subregion exhibiting uniformly anisotropic conduction (D.1, slope = −0.15 cm/s/°, p < 0.001) can be overshadowed by wavefront collision (D.2, slope = −0.01 cm/s/°, p < 0.05). Local fiber directions in these subregions are shown in Fig. S3G. (E) Histogram showing the average distribution of Φ compiled for all pacing sites.
The realistic structural features found to distinctly influence intramural CV patterns did not have the same effect on the spatial distribution of APDs. Ensemble APD maps in all three culture settings (Fig. 7, A–C) revealed an increase in APD at the pacing site due to excess depolarizing current from the stimulus electrode, as well as a relatively monotonic decrease in APD with distance from the pacing site (i.e., an APD gradient) that appeared unaffected by underlying cell orientations, tissue boundaries, or wave collisions. As a result, the overall APD dispersion in micropatterned slice cultures was comparable to the intrinsic dispersion measured in IC cultures, and amounted to an average of 21.4% ± 0.6% (Fig. 7, D–E). The relatively large spatial extent of the observed APD gradient was consistent with that found in computational studies by Sampson and Henriquez (46), and could potentially be attributed to a dynamic increase in the space constant during action potential repolarization as well as the electrotonic influence of the decrease in positive wavefront curvature (i.e., negative waveback curvature) with distance from the pacing site (47).
Figure 7.
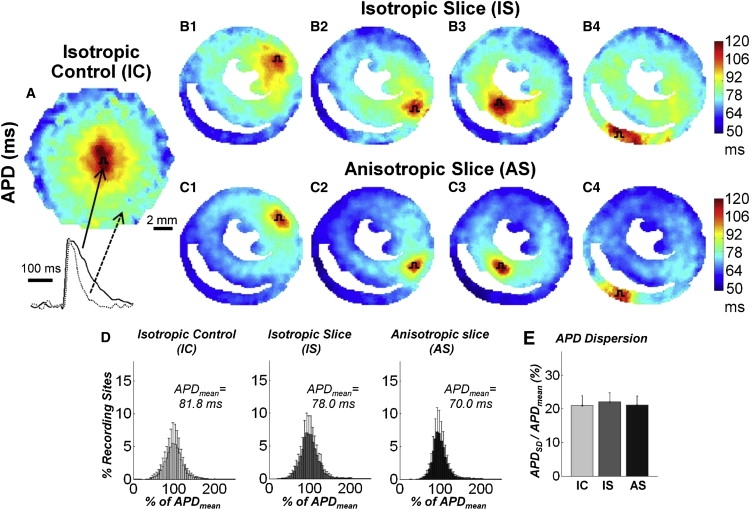
APD maps during impulse propagation in cell cultures. Ensemble average APD maps in (A) ICs with stimuli applied at the center, as well as (B) IS and (C) AS cultures with stimuli applied at each of the four pacing sites. Pulse symbols denote pacing sites. Representative action potential traces shown below A demonstrate decrease in APD with distance from the pacing site. (D) APD histogram distributions (% of mean) and (E) corresponding APD dispersions.
To additionally quantify the influence of underlying local cell orientations on wave propagation in AS cultures, spatial maps were constructed to display the angle difference (Φ) between the local direction of propagation and the underlying cellular orientation in each patterned 190 μm square pixel (Fig. 8 A.1–4). Wavefronts originating from each stimulus site were guided by tissue boundaries and changes in cell orientation to adopt a distinct path of propagation both along and across aligned cells, creating a unique spatial signature in each Φ map. As expected, higher CVs in AS cultures were associated with longitudinal conduction in regions where wavefronts propagated along oriented cells, i.e., where Φ values were low. Similarly, lower CVs were associated with regions where wavefronts propagated at larger angles relative to the underlying fibers, i.e., where Φ values were high. Therefore, remote from pacing and wave collision sites, the spatial CV and Φ maps appeared to have opposite color patterns (compare corresponding panels in Fig. 6 C.1–4 versus Fig. 8 A.1–4). When corresponding values in the two maps (combined for all four pacing sites) were plotted against each other, local CVs decreased monotonically with an increase in Φ (Fig. 8 B). APD values, however, were unaffected by the direction of propagating waves relative to the underlying cell orientation (Fig. 8 C). The local effects of cell orientation on the CV magnitude were most prominent when a wavefront propagated through a bulk region of aligned cells (e.g., Fig. 8 D.1, in the LV during anterior septum stimulus), but could be overshadowed by the accelerating effects of wavefront collision (e.g., Fig. 8 D.2, in the LV during central septum stimulus) or pacing (not shown), which nonspecifically elevated all local CVs regardless of the underlying cell orientations. Overall, the frequency distribution of Φ in AS cultures was uniform across all angles, with wavefronts on average propagating 43.5° relative to the underlying cell orientation (Fig. 8 E).
Discussion
In an effort to bridge the gap between studies of basic cardiac monolayers and intact tissues, we developed a novel cell culture approach in which a high-resolution, nondestructive imaging modality (DTMRI) was combined with cell micropatterning techniques to create reproducible cardiac cell cultures that accurately replicate the microstructure of heart tissue cross sections. In our previous studies, micropatterned parallel lines of fibronectin were used to uniformly align neonatal rat cardiomyocytes over a relatively large area (∼4 cm2) (18). In the study presented here, to faithfully reconstruct the intricate microstructure of cardiac tissue, we introduced an additional level of complexity by constructing a matrix of micropatterned pixels, with each pixel's cell alignment directed to match a corresponding DTMRI data point. To optimize this methodology, fibronectin line widths and spacings, as well as serum and cell-repelling surfactant concentrations, were first systematically varied to yield cardiomyocyte confluence and alignment on the patterned lines while avoiding fibroblast overgrowth and cell adhesion to the unpatterned areas. With these parameters optimized, the ability of fibronectin micropatterns to guide sharp changes in local cardiomyocyte alignment relative to surrounding cells was demonstrated at different spatial resolutions (pixel sizes). Finally, as a proof-of-principle, the optimized micropatterning technique was applied with 190 μm resolution to replicate the microstructure of three murine ventricular cross sections. The resulting local alignment of patterned cardiomyocytes was found to be in excellent agreement with the realistic fiber directions measured by DTMRI.
Due to the inherent structural reproducibility of cellular patterns, micropatterning techniques were recently applied to derive unique structure-function relationships in single cells or small groups of cells. In studies by Théry et al. (48), immunostaining images of 50 different epithelial cells with same micropatterned shape were stacked and their fluorescence intensities averaged to study the effects of cell geometry on the orientation of cell nucleus, centrosome, and Golgi apparatus. Similarly, Nelson et al. (49) averaged fluorescence images of relatively small, identically shaped patterns containing BrdU-labeled epithelial cells (a few hundred cells within an area of less than one square millimeter) to correlate regional cell proliferation with the spatial distribution of mechanical stresses. In another elegant study, Nelson et al. (50) averaged stacks of confocal images from relatively small, 3D-micropatterned, cell-laden gels to study the effect of tissue geometry on branching morphogenesis of mammary epithelial cells. For the first time, to our knowledge, we have optimized the application of micropatterning to a significantly larger number of cells (a few hundred thousand over an area of a few square centimeters), not only to control the shape of the resulting multicellular patterns (i.e., tissue boundaries), but also to reproducibly guide local cellular alignment within these patterns with microscopic precision. In addition, instead of averaging individual fluorescence images capturing a relatively static event (e.g., organelle orientation, protein expression, DNA synthesis, and tissue growth), we rapidly captured thousands of sequential fluorescent maps of dynamic electrical events, spatially registered them to a common DTMRI pattern, and averaged the obtained results among different cell cultures. This process allowed us to correlate the time-dependent functional parameters of action potential propagation with the micro- and macrostructural features of underlying cardiac cells.
The unique structural features of cardiac tissue not only direct normal conduction and contraction, but have also been implicated in the initiation and dynamics of reentry and fibrillation, as well as in the formation of virtual sources during electrical stimulation (3,51–54). For example, the fiber twist in the apex of the heart (51,52), interlaced fibers in the ventricular septum (53), and sharp intramural fiber turns in the LV (3) have all been suggested to facilitate shock-induced reentry and wavebreak, and potentially drive or perpetuate ventricular fibrillation. Furthermore, gross differences in geometry between the RV and LV chambers may additionally affect vulnerability to shock-induced reentry (54). Despite the recognized arrhythmogenic roles of cardiac structure, however, few systematic correlations between electrical function and natural structural features have been derived from recordings of the intact heart. In particular, the functional consequences of the interplay between the microscopic complexities of natural fiber arrangement and the heart's macroscopic gross anatomy have yet to be revealed.
As a first step toward separating and understanding the individual roles of natural macro- and microscopic structural features in action potential propagation, we introduced ventricular cross-sectional boundaries in standard isotropic cultures (IC) to create IS cultures. In addition, DTMRI-measured cell alignment (realistic microstructure) was introduced to obtain AS cultures. The three culture settings (IC, IS, and AS) thus contained distinct structural heterogeneities that ranged in scale from a single cell length for randomly oriented cells (IC and IS) to several cell lengths for realistic changes in local cell alignment (AS), and finally to a macroscopic scale (millimeter to centimeter) for natural tissue boundaries (IS and AS). The midventricular transverse cross section was selected for these studies because its structural features were representative of not only different transverse sections in the same ventricle (Fig. S3), but also ventricles of various species (Fig. S4).
By optically mapping membrane potentials at a basic 2 Hz pacing rate, we found that both microscopic changes in cell alignment and realistic tissue boundaries significantly and additively increased the spatial nonuniformity of conduction (CV dispersion) while having little effect on the spatial dispersion of APD. Mechanistically, the introduction of realistic tissue boundaries in IS (versus IC) cultures yielded both slowing in local conduction due to source-load mismatch (9,55) at sites of abrupt tissue expansions (e.g., propagation out of the RV free wall and septum) and acceleration of local conduction due to dynamic increases in cell excitability (56) at sites of wavefront collision (e.g., waves reuniting around RV and LV chambers). The introduction of realistic (anisotropic) cell orientation in AS (versus IS) cultures further increased spatial CV nonuniformity, as waves propagated more rapidly along uniformly aligned cells or in regions of fiber convergence (“bottlenecking”) and more slowly across uniformly aligned cells or in regions of sharp fiber turns and fiber divergence (“branching”). Accordingly, the presence of realistic tissue boundaries increased the spatial CV dispersion by 49% of the intrinsic dispersion measured in standard ICs, whereas the introduction of realistic fiber directions further increased CV dispersion by an additional 36% (Fig. 6 E). Notably, uniformly aligned fibers or sharp turns in fiber direction significantly affected local CVs over distances as short as 2 mm (Fig. 6 F), yielding local CV gradients as high as 40/s (i.e., 20% of CVmean per mm). In contrast, neither realistic micro- nor macrostructural features significantly affected local APD dispersion (Fig. 7).
In our previous studies, the uniform alignment of cardiomyocytes over the entire coverslip allowed the formation of fully developed elliptical wavefronts that attained maximum (longitudinal) and minimum (transverse) CVs when steadily propagating along and across aligned cells (18). In contrast, the propagating anisotropic wavefronts in realistic AS cultures had limited room to fully develop because they continuously encountered local changes in fiber directions that yielded local variations in downstream load. As a result, local CVs varied as a function of angle Φ (between direction of propagation and underlying fibers) significantly less when compiled for entire AS cultures than in regions with relatively uniform cell alignment (compare Fig. 8, B and D.1). The factors that determine the ability of propagating waves to microscopically follow changes in fiber directions (i.e., local CV versus Φ relationship) remain to be elucidated, but are likely to depend on cell excitability and coupling, as well as the degree of the cellular anisotropy (e.g. for atrial versus ventricular or fibrotic versus healthy tissues).
In general, we expect that cardiac micro-to-macro structure-function relationships (including the role of fiber directions) will be particularly important in critical regimes of slowed conduction (e.g., during ischemia and rapid focal or reentrant excitations), where depolarizing wavefronts are more sensitive to local changes in downstream electrical load. For example, rapid pacing from select locations in AS cultures may reveal specific ventricular sites highly prone to conduction failure. Importantly, these results suggest the existence of purely structural determinants of block and reentry inside the heart that are independent of natural gradients in ion channel expression. The locations with arrhythmogenic structural features may eventually become new targets for antiarrhythmic pacing and ablation. Our preliminary studies indicate that RV-septum junctions in AS are particularly vulnerable to block induced by rapid excitation (57,58).
Model system and study limitations
One limitation of the described in vitro model system is the unavoidable use of neonatal (instead of adult) cardiomyocytes for cell culture, as they are the only available cardiac cells that can be readily micropatterned and cultured to confluence. Another limitation is the 2D nature of the preparation, which ultimately can only provide insights into the in-plane patterns of propagation. However, for the transverse cross section micropatterned in this study (and most other transverse cross sections in the ventricle), the bulk of cardiac fibers have in-plane or near in-plane orientations (Fig. S5, A and C). As a consequence, conduction patterns obtained in the transverse slice culture are likely to resemble patterns that would develop in transverse cross sections of the intact ventricle stimulated from an in-plane pacing site. Differences in conduction would be mainly limited to the left endocardial border where most of the fibers significantly deviate out of plane (Fig. S5 B). Finally, because of the limited spatial resolution of our optical mapping setup (photodiode array), spatial interpolation was required to register electrical measurements obtained with 750 μm resolution to 190 μm pixels in fiber angle maps. Although we anticipate quantitatively similar results with higher optical mapping resolution, similar studies involving high-spatial-resolution camera recordings are currently under way in our laboratory.
Potential applications of micropatterned slice cultures
Within the above limitations, we expect that the ability to control microscopic cardiac cell alignment in a realistic (or any desired) fashion within a relatively large culture area will allow unique studies of the roles of heart tissue microstructure in macroscopic conduction, shock-induced patterns of polarization, and reentry dynamics. In addition, DTMRI can be performed noninvasively in vivo (59) to track the progression of a disease or therapy in the same animal over multiple time points while updating micropatterned slice cultures to study the electrophysiological changes due to altered intraventricular structure. Furthermore, different nonmyocytes (e.g., fibroblasts and adult or embryonic stem cells) can be copatterned with cardiomyocytes to study realistic structure-function relationships in fibrotic or cell-treated hearts. Particularly exciting is the potential use of macrofluidic techniques (60,61) in this system to introduce regional alterations in ion channel function (through drug or gene manipulation) and to systematically dissect the roles of microstructural and functional heterogeneities in normal and abnormal cardiac conduction.
Acknowledgments
We thank Dr. Yi Jiang and Dr. Edward Hsu for supplying DTMRI data used for the micropatterns, James Scull for contributing to the design of the optical mapping setup, and Dr. Joseph Tranquillo for helpful discussions. We also thank Dr. Patrick A. Helm and Dr. Raimond L. Winslow at the Center for Cardiovascular Bioinformatics and Modeling and Dr. Elliot McVeigh at the National Institute of Health for providing the human and canine DTMRI data for Fig. S4 in the Supporting Material.
This work supported in part by an American Heart Association predoctoral fellowship (No. 0715178U) and startup funds from the Department of Biomedical Engineering, Duke University (to Dr. Nenad Bursac).
Supporting Material
References
- 1.de Bakker J.M., van Capelle F.J., Janse M.J., Tasseron S., Vermeulen J.T. Slow conduction in the infarcted human heart. ‘Zigzag’ course of activation. Circulation. 1993;88:915–926. doi: 10.1161/01.cir.88.3.915. [DOI] [PubMed] [Google Scholar]
- 2.Ripplinger C.M., Li W., Hadley J., Chen J., Rothenberg F. Enhanced transmural fiber rotation and connexin 43 heterogeneity are associated with an increased upper limit of vulnerability in a transgenic rabbit model of human hypertrophic cardiomyopathy. Circ. Res. 2007;101:1049–1057. doi: 10.1161/CIRCRESAHA.107.161240. [DOI] [PMC free article] [PubMed] [Google Scholar]
- 3.Valderrabano M., Lee M.H., Ohara T., Lai A.C., Fishbein M.C. Dynamics of intramural and transmural reentry during ventricular fibrillation in isolated swine ventricles. Circ. Res. 2001;88:839–848. doi: 10.1161/hh0801.089259. [DOI] [PubMed] [Google Scholar]
- 4.Muthappan P., Calkins H. Arrhythmogenic right ventricular dysplasia. Prog. Cardiovasc. Dis. 2008;51:31–43. doi: 10.1016/j.pcad.2008.01.002. [DOI] [PubMed] [Google Scholar]
- 5.Schalij M.J., Boersma L., Huijberts M., Allessie M.A. Anisotropic reentry in a perfused 2-dimensional layer of rabbit ventricular myocardium. Circulation. 2000;102:2650–2658. doi: 10.1161/01.cir.102.21.2650. [DOI] [PubMed] [Google Scholar]
- 6.Chou C.C., Nihei M., Zhou S., Tan A., Kawase A. Intracellular calcium dynamics and anisotropic reentry in isolated canine pulmonary veins and left atrium. Circulation. 2005;111:2889–2897. doi: 10.1161/CIRCULATIONAHA.104.498758. [DOI] [PubMed] [Google Scholar]
- 7.Brugada J., Brugada P., Boersma L., Mont L., Kirchhof C. On the mechanisms of ventricular tachycardia acceleration during programmed electrical stimulation. Circulation. 1991;83:1621–1629. doi: 10.1161/01.cir.83.5.1621. [DOI] [PubMed] [Google Scholar]
- 8.Kucera J.P., Kleber A.G., Rohr S. Slow conduction in cardiac tissue, II: effects of branching tissue geometry. Circ. Res. 1998;83:795–805. doi: 10.1161/01.res.83.8.795. [DOI] [PubMed] [Google Scholar]
- 9.Fast V.G., Kleber A.G. Cardiac tissue geometry as a determinant of unidirectional conduction block: assessment of microscopic excitation spread by optical mapping in patterned cell cultures and in a computer model. Cardiovasc. Res. 1995;29:697–707. [PubMed] [Google Scholar]
- 10.Rohr S., Kucera J.P., Fast V.G., Kleber A.G. Paradoxical improvement of impulse conduction in cardiac tissue by partial cellular uncoupling. Science. 1997;275:841–844. doi: 10.1126/science.275.5301.841. [DOI] [PubMed] [Google Scholar]
- 11.Koura T., Hara M., Takeuchi S., Ota K., Okada Y. Anisotropic conduction properties in canine atria analyzed by high- resolution optical mapping: preferential direction of conduction block changes from longitudinal to transverse with increasing age. Circulation. 2002;105:2092–2098. doi: 10.1161/01.cir.0000015506.36371.0d. [DOI] [PubMed] [Google Scholar]
- 12.Parker K.K., Tan J., Chen C.S., Tung L. Myofibrillar architecture in engineered cardiac myocytes. Circ. Res. 2008;103:340–342. doi: 10.1161/CIRCRESAHA.108.182469. [DOI] [PMC free article] [PubMed] [Google Scholar]
- 13.Pedrotty D.M., Klinger R.Y., Badie N., Hinds S., Kardashian A. Structural coupling of cardiomyocytes and noncardiomyocytes: quantitative comparisons using a novel micropatterned cell pair assay. Am. J. Physiol. Heart Circ. Physiol. 2008;295:H390–H400. doi: 10.1152/ajpheart.91531.2007. [DOI] [PMC free article] [PubMed] [Google Scholar]
- 14.Rohr S., Kucera J.P., Kleber A.G. Slow conduction in cardiac tissue, I: effects of a reduction of excitability versus a reduction of electrical coupling on microconduction. Circ. Res. 1998;83:781–794. doi: 10.1161/01.res.83.8.781. [DOI] [PubMed] [Google Scholar]
- 15.Camelliti P., Gallagher J.O., Kohl P., McCulloch A.D. Micropatterned cell cultures on elastic membranes as an in vitro model of myocardium. Nat. Protocols. 2006;1:1379–1391. doi: 10.1038/nprot.2006.203. [DOI] [PubMed] [Google Scholar]
- 16.Rohr S., Salzberg B. Characterization of impulse propagation at the microscopic level across geometrically defined expansions of excitable tissue: multiple site optical recording of transmembrane voltage (MSORTV) in patterned growth heart cell cultures. J. Gen. Physiol. 1994;104:287–309. doi: 10.1085/jgp.104.2.287. [DOI] [PMC free article] [PubMed] [Google Scholar]
- 17.Lim Z.Y., Maskara B., Aguel F., Emokpae R., Jr., Tung L. Spiral wave attachment to millimeter-sized obstacles. Circulation. 2006;114:2113–2121. doi: 10.1161/CIRCULATIONAHA.105.598631. [DOI] [PubMed] [Google Scholar]
- 18.Bursac N., Parker K.K., Iravanian S., Tung L. Cardiomyocyte cultures with controlled macroscopic anisotropy. A model for functional electrophysiological studies of cardiac muscle. Circ. Res. 2002;91:e45–e54. doi: 10.1161/01.res.0000047530.88338.eb. [DOI] [PubMed] [Google Scholar]
- 19.Gaudesius G., Miragoli M., Thomas S.P., Rohr S. Coupling of cardiac electrical activity over extended distances by fibroblasts of cardiac origin. Circ. Res. 2003;93:421–428. doi: 10.1161/01.RES.0000089258.40661.0C. [DOI] [PubMed] [Google Scholar]
- 20.Klinger R., Bursac N. cardiac cell therapy in vitro: reproducible assays for comparing the efficacy of different donor cells. IEEE Eng. Med. Biol. Mag. 2008;27:72–80. doi: 10.1109/MEMB.2007.913849. [DOI] [PMC free article] [PubMed] [Google Scholar]
- 21.Entcheva E., Lu S.N., Troppman R.H., Sharma V., Tung L. Contact fluorescence imaging of reentry in monolayers of cultured neonatal rat ventricular myocytes. J. Cardiovasc. Electrophysiol. 2000;11:665–676. doi: 10.1111/j.1540-8167.2000.tb00029.x. [DOI] [PubMed] [Google Scholar]
- 22.de Diego C., Pai R.K., Dave A.S., Lynch A., Thu M. Spatially discordant alternans in cardiomyocyte monolayers. Am. J. Physiol. Heart Circ. Physiol. 2008;294:H1417–H1425. doi: 10.1152/ajpheart.01233.2007. [DOI] [PubMed] [Google Scholar]
- 23.Fast V.G., Ideker R.E. Simultaneous optical mapping of transmembrane potential and intracellular calcium in myocyte cultures. J. Cardiovasc. Electrophysiol. 2000;11:547–556. doi: 10.1111/j.1540-8167.2000.tb00008.x. [DOI] [PubMed] [Google Scholar]
- 24.Munoz V., Grzeda K.R., Desplantez T., Pandit S.V., Mironov S. Adenoviral expression of IKs contributes to wavebreak and fibrillatory conduction in neonatal rat ventricular cardiomyocyte monolayers. Circ. Res. 2007;101:475–483. doi: 10.1161/CIRCRESAHA.107.149617. [DOI] [PubMed] [Google Scholar]
- 25.Iravanian S., Nabutovsky Y., Kong C.R., Saha S., Bursac N. Functional reentry in cultured monolayers of neonatal rat cardiac cells. Am. J. Physiol. Heart Circ. Physiol. 2003;285:H449–H456. doi: 10.1152/ajpheart.00896.2002. [DOI] [PubMed] [Google Scholar]
- 26.Bub G., Tateno K., Shrier A., Glass L. Spontaneous initiation and termination of complex rhythms in cardiac cell culture. J. Cardiovasc. Electrophysiol. 2003;14:S229–S236. doi: 10.1046/j.1540.8167.90315.x. [DOI] [PubMed] [Google Scholar]
- 27.Bursac N., Aguel F., Tung L. Multiarm spirals in a two-dimensional cardiac substrate. Proc. Natl. Acad. Sci. USA. 2004;101:15530–15534. doi: 10.1073/pnas.0400984101. [DOI] [PMC free article] [PubMed] [Google Scholar]
- 28.Bursac N., Tung L. Acceleration of functional reentry by rapid pacing in anisotropic cardiac monolayers: formation of multi-wave functional reentries. Cardiovasc. Res. 2006;69:381–390. doi: 10.1016/j.cardiores.2005.09.014. [DOI] [PubMed] [Google Scholar]
- 29.Helm P., Beg M.F., Miller M.I., Winslow R.L. Measuring and mapping cardiac fiber and laminar architecture using diffusion tensor MR imaging. Ann. N.Y. Acad. Sci. 2005;1047:296–307. doi: 10.1196/annals.1341.026. [DOI] [PubMed] [Google Scholar]
- 30.Hooks D.A., Trew M.L., Caldwell B.J., Sands G.B., Legrice I.J. Laminar arrangement of ventricular myocytes influences electrical behavior of the heart. Circ Res. 2007;101:e103–e112. doi: 10.1161/CIRCRESAHA.107.161075. [DOI] [PubMed] [Google Scholar]
- 31.LeGrice I.J., Smaill B.H., Chai L.Z., Edgar S.G., Gavin J.B. Laminar structure of the heart: ventricular myocyte arrangement and connective tissue architecture in the dog. Am. J. Physiol. 1995;269:H571–H582. doi: 10.1152/ajpheart.1995.269.2.H571. [DOI] [PubMed] [Google Scholar]
- 32.Hsu E.W., Muzikant A.L., Matulevicius S.A., Penland R.C., Henriquez C.S. Magnetic resonance myocardial fiber-orientation mapping with direct histological correlation. Am. J. Physiol. 1998;274:H1627–H1634. doi: 10.1152/ajpheart.1998.274.5.H1627. [DOI] [PubMed] [Google Scholar]
- 33.Scollan D.F., Holmes A., Zhang J., Winslow R.L. Reconstruction of cardiac ventricular geometry and fiber orientation using magnetic resonance imaging. Ann. Biomed. Eng. 2000;28:934–944. doi: 10.1114/1.1312188. [DOI] [PMC free article] [PubMed] [Google Scholar]
- 34.Scollan D.F., Holmes A., Winslow R., Forder J. Histological validation of myocardial microstructure obtained from diffusion tensor magnetic resonance imaging. Am. J. Physiol. 1998;275:H2308–H2318. doi: 10.1152/ajpheart.1998.275.6.H2308. [DOI] [PubMed] [Google Scholar]
- 35.Holmes A.A., Scollan D.F., Winslow R.L. Direct histological validation of diffusion tensor MRI in formaldehyde-fixed myocardium. Magn. Reson. Med. 2000;44:157–161. doi: 10.1002/1522-2594(200007)44:1<157::aid-mrm22>3.0.co;2-f. [DOI] [PubMed] [Google Scholar]
- 36.The Center for Cardiovascular Bioinformatics and Modeling. http://www.ccbm.jhu.edu/. Accessed August 10, 2006.
- 37.Walker J.G., Guccione J.M., Jiang Y., Zhang P., Wallace A.W. Helical myofiber orientation after myocardial infarction and left ventricular surgical restoration in sheep. J. Thorac. Cardiovasc. Surg. 2005;129:382–390. doi: 10.1016/j.jtcvs.2004.06.006. [DOI] [PubMed] [Google Scholar]
- 38.Reference deleted in proof.
- 39.Jiang Y., Pandya K., Smithies O., Hsu E.W. Three-dimensional diffusion tensor microscopy of fixed mouse hearts. Magn. Reson. Med. 2004;52:453–460. doi: 10.1002/mrm.20191. [DOI] [PubMed] [Google Scholar]
- 40.Tseng W.Y., Dou J., Reese T.G., Wedeen V.J. Imaging myocardial fiber disarray and intramural strain hypokinesis in hypertrophic cardiomyopathy with MRI. J. Magn. Reson. Imaging. 2006;23:1–8. doi: 10.1002/jmri.20473. [DOI] [PubMed] [Google Scholar]
- 41.Detrait E., Lhoest J.B., Bertrand P., van den Bosch de Aguilar P. Fibronectin-pluronic coadsorption on a polystyrene surface with increasing hydrophobicity: relationship to cell adhesion. J. Biomed. Mater. Res. 1999;45:404–413. doi: 10.1002/(sici)1097-4636(19990615)45:4<404::aid-jbm16>3.0.co;2-4. [DOI] [PubMed] [Google Scholar]
- 42.Liu V.A., Jastromb W.E., Bhatia S.N. Engineering protein and cell adhesivity using PEO-terminated triblock polymers. J. Biomed. Mater. Res. 2002;60:126–134. doi: 10.1002/jbm.10005. [DOI] [PubMed] [Google Scholar]
- 43.Bursac N., Papadaki M., Cohen R.J., Schoen F.J., Eisenberg S.R. Cardiac muscle tissue engineering: toward an in vitro model for electrophysiological studies. Am. J. Physiol. 1999;277:H433–H444. doi: 10.1152/ajpheart.1999.277.2.H433. [DOI] [PubMed] [Google Scholar]
- 44.Karlon W.J., Covell J.W., McCulloch A.D., Hunter J.J., Omens J.H. Automated measurement of myofiber disarray in transgenic mice with ventricular expression of ras. Anat. Rec. 1998;252:612–625. doi: 10.1002/(SICI)1097-0185(199812)252:4<612::AID-AR12>3.0.CO;2-1. [DOI] [PubMed] [Google Scholar]
- 45.Fisher N.I. Cambridge University Press; New York: 1993. Statistical Analysis of Circular Data. [Google Scholar]
- 46.Sampson K.J., Henriquez C.S. Electrotonic influences on action potential duration dispersion in small hearts: a simulation study. Am. J. Physiol. Heart Circ. Physiol. 2005;289:H350–H360. doi: 10.1152/ajpheart.00507.2004. [DOI] [PubMed] [Google Scholar]
- 47.Qu Z.L., Xie F.G., Garfinkel A., Weiss J.N. Origins of spiral wave meander and breakup in a two-dimensional cardiac tissue model. Ann. Biomed. Eng. 2000;28:755–771. doi: 10.1114/1.1289474. [DOI] [PubMed] [Google Scholar]
- 48.Théry M., Racine V., Piel M., Pépin A., Dimitrov A. Anisotropy of cell adhesive microenvironment governs cell internal organization and orientation of polarity. Proc. Natl. Acad. Sci. USA. 2006;103:19771–19776. doi: 10.1073/pnas.0609267103. [DOI] [PMC free article] [PubMed] [Google Scholar]
- 49.Nelson C.M., Jean R.P., Tan J.L., Liu W.F., Sniadecki N.J. Emergent patterns of growth controlled by multicellular form and mechanics. Proc. Natl. Acad. Sci. USA. 2005;102:11594–11599. doi: 10.1073/pnas.0502575102. [DOI] [PMC free article] [PubMed] [Google Scholar]
- 50.Nelson C.M., Vanduijn M.M., Inman J.L., Fletcher D.A., Bissell M.J. Tissue geometry determines sites of mammary branching morphogenesis in organotypic cultures. Science. 2006;314:298–300. doi: 10.1126/science.1131000. [DOI] [PMC free article] [PubMed] [Google Scholar]
- 51.Chattipakorn N., Fotuhi P.C., Zheng X., Ideker R.E. Left ventricular apex ablation decreases the upper limit of vulnerability. Circulation. 2000;101:2458–2460. doi: 10.1161/01.cir.101.21.2458. [DOI] [PubMed] [Google Scholar]
- 52.Ashihara T., Namba T., Yao T., Ozawa T., Kawase A. Vortex cordis as a mechanism of postshock activation: arrhythmia induction study using a bidomain model. J. Cardiovasc. Electrophysiol. 2003;14:295–302. doi: 10.1046/j.1540-8167.2003.02408.x. [DOI] [PubMed] [Google Scholar]
- 53.Ikeda T., Kawase A., Nakazawa K., Ashihara T.T., Namba T.T. Role of structural complexities of septal tissue in maintaining ventricular fibrillation in isolated, perfused canine ventricle. J. Cardiovasc. Electrophysiol. 2001;12:66–75. doi: 10.1046/j.1540-8167.2001.00066.x. [DOI] [PubMed] [Google Scholar]
- 54.Rodriguez B., Li L., Eason J.C., Efimov I.R., Trayanova N.A. Differences between left and right ventricular chamber geometry affect cardiac vulnerability to electric shocks. Circ. Res. 2005;97:168–175. doi: 10.1161/01.RES.0000174429.00987.17. [DOI] [PMC free article] [PubMed] [Google Scholar]
- 55.Cabo C., Pertsov A.M., Baxter W.T., Davidenko J.M., Gray R.A. Wave-front curvature as a cause of slow conduction and block in isolated cardiac muscle. Circ. Res. 1994;75:1014–1028. doi: 10.1161/01.res.75.6.1014. [DOI] [PubMed] [Google Scholar]
- 56.Spach M.S., Barr R.C., Serwer G.S., Johnson E.A., Kootsey J.M. Collision of excitation waves in dog Purkinje system—extracellular identification. Circ. Res. 1971;29:499–511. doi: 10.1161/01.res.29.5.499. [DOI] [PubMed] [Google Scholar]
- 57.Badie N., Bursac N. Micropatterned heart slice cultures for studies of intramural cardiac electrophysiology. Proc. Am. Heart Assoc., Chicago, IL. Circulation. 2006;114 II_331. [Google Scholar]
- 58.Badie N., Bursac N. Micropatterned ventricular slice: role of realistic tissue microstructure in impulse conduction. Proc. Am. Heart Assoc., New Orleans, LA. Circulation. 2008;118 S_493. [Google Scholar]
- 59.Wu M.T., Tseng W.Y., Su M.Y., Liu C.P., Chiou K.R. Diffusion tensor magnetic resonance imaging mapping the fiber architecture remodeling in human myocardium after infarction: correlation with viability and wall motion. Circulation. 2006;114:1036–1045. doi: 10.1161/CIRCULATIONAHA.105.545863. [DOI] [PubMed] [Google Scholar]
- 60.Lin J.W., Garber L., Qi Y.R., Chang M.G., Cysyk J. Region of slowed conduction acts as core for spiral wave reentry in cardiac cell monolayers. Am. J. Physiol. Heart Circ. Physiol. 2008;294:H58–H65. doi: 10.1152/ajpheart.00631.2007. [DOI] [PubMed] [Google Scholar]
- 61.Biktashev V.N., Arutunyan A., Sarvazyan N.A. Generation and escape of local waves from the boundary of uncoupled cardiac tissue. Biophys. J. 2008;94:3726–3738. doi: 10.1529/biophysj.107.117630. [DOI] [PMC free article] [PubMed] [Google Scholar]
Associated Data
This section collects any data citations, data availability statements, or supplementary materials included in this article.