

Abstract
The behavior of biological systems is determined by the properties of their component molecules, but the interactions are usually too complex to understand fully how molecular behavior generates cellular behavior. Ca2+ signaling by inositol trisphosphate receptors (IP3R) offers an opportunity to understand this relationship because the cellular behavior is defined largely by Ca2+-mediated interactions between IP3R. Ca2+ released by a cluster of IP3R (giving a local Ca2+ puff) diffuses and ignites the behavior of neighboring clusters (to give repetitive global Ca2+ spikes). We use total internal reflection fluorescence microscopy of two mammalian cell lines to define the temporal relationships between Ca2+ puffs (interpuff intervals, IPI) and Ca2+ spikes (interspike intervals) evoked by flash photolysis of caged IP3. We find that IPI are much shorter than interspike intervals, that puff activity is stochastic with a recovery time that is much shorter than the refractory period of the cell, and that IPI are not periodic. We conclude that Ca2+ spikes do not arise from oscillatory dynamics of IP3R clusters, but that repetitive Ca2+ spiking with its longer timescales is an emergent property of the dynamics of the whole cluster array.
Introduction
Cellular behavior arises from dynamic interactions between molecules, which generate oscillatory responses, bistability (the ability to switch between two distinct stationary states) or other types of behavior. Examples include repetitive membrane potential spikes in neurons (1), glycolytic oscillations in yeast (2), and bistability of cytokine signaling in T lymphocytes (3) or in the cytosolic and mitochondrial Ca2+ concentration in Xenopus oocytes (4). However, the timescales of the cellular behaviors are usually very different from those of the individual molecules that underlie them; ion channels, enzymes, and receptors, for example. Although molecular and cellular behaviors are often individually well characterized, we know little about how one generates the other. Does cell behavior arise at the level of protein complexes or only at the cellular level? How are molecular dynamics coordinated across a cell?
Intracellular Ca2+ signaling by inositol 1,4,5-trisphosphate receptors (IP3R) is particularly interesting in this respect because the cellular behavior is defined largely by Ca2+-mediated interactions between IP3R. IP3R are intracellular Ca2+ channels that are expressed in the membranes of the endoplasmic reticulum (ER). Their opening in response to IP3 and Ca2+ allows Ca2+ to flow rapidly from the ER into the cytosol (5–8). Clusters of up to about 15 IP3R are scattered across the ER membrane with distances of 1–7 μm separating the clusters (9,10). Ca2+ diffusion is expected to allow much stronger coupling between IP3R within a cluster than over the much longer distances between clusters (11). Fluorescence imaging and simulations reveal a hierarchy of Ca2+ release events (12–18). Openings of single IP3R (blips) may trigger collective openings of IP3R within a cluster (puffs) by Ca2+-induced Ca2+ release. Ca2+ diffusing from a puff site can then activate neighboring clusters, eventually leading to a global Ca2+ spike (13). Repetitive sequences of these Ca2+ spikes encode information used to regulate many processes in diverse cells (19–21). The functional hierarchy of individual IP3R, clusters of IP3R, and cluster arrays (22), makes IP3R-mediated Ca2+ signaling well suited to analyses of how cellular behavior emerges from the behavior of individual molecules.
Several independent studies have recently shown that repetitive IP3-evoked global Ca2+ spikes do not behave as regular oscillators, but instead the sequence of interspike intervals (ISI) is stochastic. This was found with astrocytes, microglia, human embryonic kidney (HEK) cells, and processed lipoaspirate cells (23). ISI sequences have not been analyzed with respect to stochasticity in Xenopus oocytes, but large variations are also seen in these cells (24). Similarly, hepatocytes exhibit irregular spike sequences, with a degree of irregularity that depends on the specific agonist stimulation (25–29). Mathematical modeling shows that these stochastic dynamics allow for the full range of observed Ca2+ signals and do not limit their ability to transmit information reliably (16,30–33). A detailed characterization of the distribution of ISI from several cell types (23) established that there was a refractory period immediately after each Ca2+ spike (10–60 s, depending on the cell type), and thereafter spikes occurred randomly. The lower the probability of a spike occurring (as would occur with lesser stimulus intensities), the longer are the average and standard deviation of the ISI sequence. Strong stimulation leads to almost regular spiking with the minimal ISI, because under these conditions the probability of a spike initiating is so high that a spike occurs as soon as the refractory period elapses (23).
Intracellular Ca2+ dynamics are often perceived as a reaction-diffusion system (1,6,34,35). In such a system, the local dynamics result from chemical reactions, and spatial coupling is mediated by diffusion of the reactants. For IP3R-evoked Ca2+ signals, the local dynamics are the opening and closing of IP3R within clusters, the local Ca2+ release, and feedback of the local increase in [Ca2+] to IP3R state dynamics. Spatial coupling is provided by the diffusion of cytosolic free Ca2+ and its modulation by buffers. According to the theory of reaction-diffusion systems (1,36), the local dynamics set the dynamic regime—oscillatory or stationary—and these local dynamics have timescales similar to those of the global dynamics. The minimal ISI would then correspond to the sum of the refractory period and the duration of Ca2+ release from an individual IP3R cluster. A specific prediction of this reaction-diffusion-based theory is that the timescales of Ca2+ signaling at the level of an IP3R cluster (Ca2+ puff, local dynamics) and at the level of the entire cell (Ca2+ spike, global dynamics) should be very similar.
To determine whether the relation between cellular Ca2+ signals and cluster behavior is described by a reaction-diffusion system, we investigate experimentally whether the local dynamics of IP3-induced Ca2+ release exhibit oscillatory behavior on timescales comparable to those of the global dynamics. We characterized the global dynamics by analyzing ISI (23), and characterize the local dynamics by measuring distributions of interpuff intervals (IPI) for each puff site. These measurements used lengthy recordings from cells loaded with the slow Ca2+ buffer, EGTA, which suppresses recruitment of one cluster by another by restricting diffusion of free Ca2+, but it minimally affects dynamics within a cluster (9,37). Although IPI distributions have been analyzed previously, those studies were specifically concerned with the overall frequency of puffs between Ca2+ spikes; they therefore neither eliminated the effects of global Ca2+ spikes on local events nor did they identify the frequency of puffs at individual puff sites (12,24). Here, we examine the local dynamics of each Ca2+ puff site unperturbed by global Ca2+ spikes. We find that the dynamics of IP3R clusters do not exhibit the long timescales of the global dynamics, and that neither IPI distributions nor IPI correlations show oscillatory behavior. We conclude that the timescales and repeated spike generation of cellular Ca2+ signaling are caused by processes that emerge only at the level of the entire cell.
Materials and Methods
Cell culture and preparation of cells for imaging
Human neuroblastoma SH-SY5Y cells were cultured as described (37) in a mixture (1:1) of Ham's F12 medium and Eagle's minimal essential medium, supplemented with fetal calf serum (10%, v/v) and nonessential amino acids (1%, v/v). Cells were incubated at 37°C in a humidified incubator gassed with 95% air and 5% CO2, passaged every 7 days, and used for up to 20 passages. Four days before imaging, cells were harvested in phosphate-buffered saline without Ca2+ or Mg2+, and added to petri dishes with glass coverslips as the base (MatTek, Ashland, MA) at a density of 3 × 10⁴ cells/ml. HEK 293 cells were cultured in Dulbecco's modified Eagle's medium/Ham's F-12, supplemented with l-glutamine (2 mM) and fetal calf serum (10%, v/v). HEK 293 cells were grown in a humidified atmosphere containing 95% air and 5% CO2 at 37°C, and passaged every third day. Two days before imaging cells were harvested and seeded (∼2 × 10⁵ cells/well) into 35-mm (7-mm insert) glass-bottomed dishes (MatTek) precoated with 0.01% poly-l-lysine.
Cells were loaded with membrane-permeant esters of EGTA, Fluo-4, and ci-IP3 by incubation in Hepes-buffered saline (HBS), the composition of which differed slightly for the two cell lines (solely because the different cells were used in different laboratories). HBS had the following composition (mM) for SH-SY5Y cells: NaCl 135, KCl 5, MgMg2 1.2, CaCl2 2.5, Hepes 5, glucose 10, pH 7.4; and for HEK 293 cells: NaCl 135, KCl 5.9, MgCl2 1.2, CaCl2 1.5, Hepes 11.6, glucose 11.5, pH 7.4. Cells were first loaded in HBS containing ciIP3-PM (1 μM, SiChem, Bremen, Germany) at 20°C for 45 min, and then with ciIP3-PM (1 μM) and Fluo-4-AM (2 μM and 5 μM for HEK 293 and SH-SY5Y cells, respectively; Invitrogen, Carlsbad, CA) for 45 min, and finally with HBS containing EGTA-AM for 45 min (1–5 μM, Invitrogen).
Total internal reflection fluorescence (TIRF) microscopy
In SH-SY5Y cells, imaging of changes in intracellular free Ca2+ concentration ([Ca2+]i) used a home-built TIRF microscope system based on an Olympus (Tokyo, Japan) IX 70 microscope with a ×60 TIRF objective (NA, 1.45) (37). Fluo-4 fluorescence was excited at 488 nm, and images of emitted fluorescence (λ > 510 nm) were captured at a resolution of 128 × 128 pixels (1 pixel = 0.33 μm) at 500 frames/s using a Cascade 128 EMCCD camera (Roper Scientific, Tucson, AZ). Photolysis of ciIP3 was evoked by flashes of ultraviolet light (350–400 nm) from a fiber optic arc lamp adjusted to uniformly irradiate a region slightly larger than the imaging frame. Each imaging field was exposed to only a single flash. We note that photolysis of ciIP3 does not release IP3 itself, but a more metabolically stable analog (iIP3) in which the 2- and 3-OH groups of IP3 are linked by an isopropylidene group (38).
The TIRF microscopy methods were similar for HEK 293 cells, using an Olympus IX81 microscope and TIRF objective (×60; NA, 1.45) and Andor (South Windsor, CT) iXon 860 camera (128 × 128 pixels, 1 pixel = 0.33 μm, 100 frames/s) for imaging, and a JML-C2 Xe flash lamp (∼3 mF, ∼1 ms; Rapp OptoElectronic, Hamburg, Germany) for flash photolysis. After subtraction of background fluorescence, the fluorescence intensity within a defined circular region of interest (ROI, diameter ∼1 μm) was expressed as F/Fo, where F is the fluorescence intensity at time, t; and Fo is the average fluorescence intensity from the same ROI collected from ∼10 frames immediately before flash photolysis.
Statistical analysis
Long, stationary traces that were not too noisy were selected for analysis. For statistical analysis, data were normalized using a running average to remove baseline drift (23) (Fig. 1 shows raw data). Puffs were defined as increases in fluorescence intensity that exceeded the baseline by ≥10%. The histograms shown in Fig. 2 were derived by setting the number of bins to the square root of the number of IPI in the sequence. Equation 1 (see below) was then fitted to the histogram. Histograms and nonlinear fits to probability distributions were computed with the software package MATLAB (The MathWorks, Natick, MA). Average (Tav) and standard deviation (σ) of IPI were calculated directly from the IPI sequences. Slope m and intercept x0 of σ-Tav relations were obtained by linear fitting to the curve m(x – x0).
Figure 1.
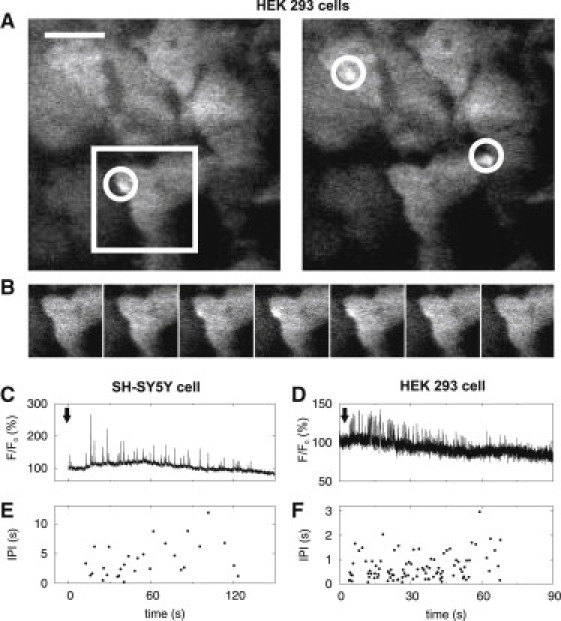
Ca2+ puffs evoked by flash photolysis of ci-IP3 and recorded by TIRF microscopy. (A) TIRF microscopy of Ca2+ puffs in HEK 293 cells. Grayscale images show single image frames (10 ms exposure time) of Fluo-4 fluorescence captured ∼52 s and ∼62 s after photo release of ci-IP3. White circles mark puffs (short-lived bright spots), and are 5 μm2 and larger than the ROI used for statistical analysis. The size of the scale bar is 10 μm. For similar images of puffs in SH-SY5Y cells see (9). (B) Time evolution of the puff marked by the white square in A, the time between the images is 10 ms (sequential frames). (C and D) Fluorescence changes in respectively an SH-SY5Y cell and a HEK 293 cell, monitored from ROI that include a single puff site and expressed as percentages of the basal fluorescence intensities. Arrows indicate times of stimulation by flash photolysis. (E and F) Respective IPI derived from the recordings in C and D.
Figure 2.
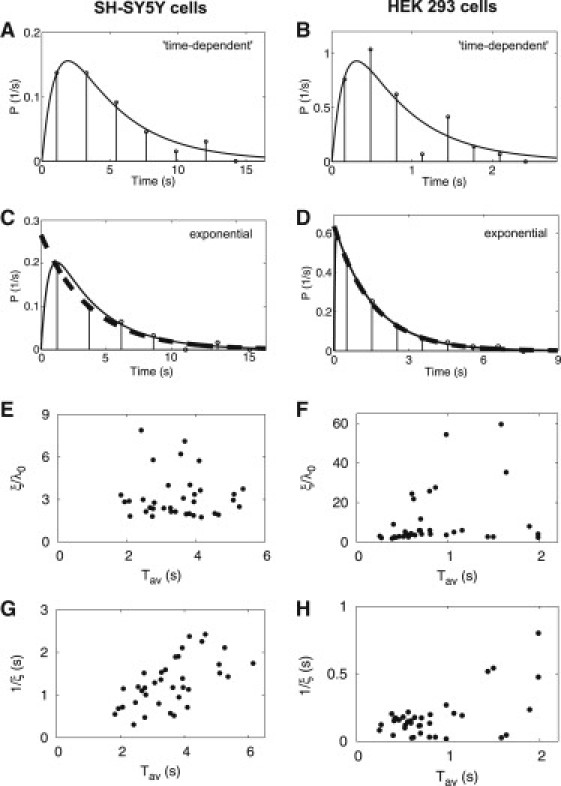
IPI distributions establish that local dynamics do not generate the dynamics of Ca2+ spikes. (A–D) Histograms were constructed from recordings of individual puff sites similar to those shown in Fig. 1 in which the number of bins was set to the square root of the number of IPI (13–100) in the sequence. Full lines are fits to an exponential distribution with a time-dependent rate (Eq. 1). The dashed lines in C and D are fits to the exponential distribution (Eq. 2) and indicate that in these puff sites, the distributions are well described by an exponential function with the probability of initiating a puff being constant throughout the IPI (Eq. 2). (E and F) Fitting each of the histograms (35 for SH-SY5Y cells and 41 for HEK 293 cells) to Eq. 1 shows the variability between puff sites. For some sites (5 in SH-SY5Y and 7 in HEK 293 cells), the ratio ξ/λ0 is so large that the distributions are well described by Eq. 2. For the other sites, ξ is smaller and there is a pronounced maximum for IPI of the same order of magnitude as the average IPI Tav. (G and H) Both Tav and 1/ξ are much smaller than ISI (typically 10–100 s and 20–100 s in SH-SY5Y and HEK 293 cells, respectively; see text for further details).
Probability distributions for interpuff intervals
We describe the distribution of IPI p(t) by an ansatz taking refractoriness after a puff into account. The probability λ for a puff is 0 immediately after a puff has occurred, and then recovers to an asymptotic value λ0 with the recovery rate ξ:
| (1) |
where the integral can be evaluated to obtain an analytical formula. The puff-rate, λ0, is a measure of the typical IPI, similar to the reciprocal of Tav. We obtain excellent fits of the measured IPI distributions to Eq. 1 by choosing λ0 = 1/Tav and determining the value of ξ from nonlinear fitting. For ξ ≫ λ0, Eq. 1 is reduced to the exponential distribution,
| (2) |
which is the waiting-time distribution of the Poisson process, and has a coefficient of variation (CV = standard deviation/mean) of 1.
Results and Discussion
Local dynamics of Ca2+ puffs do not define the dynamics of Ca2+ spikes
The autonomous activity of individual Ca2+ puff sites can be measured by inhibiting global Ca2+ dynamics with EGTA and by imaging local Ca2+ events by TIRF microscopy (37). Although this technique only resolves Ca2+ puffs that occur near the plasma membrane, most puff sites are located adjacent to the plasma membrane in SH-SY5Y cells (37), and our objective was to study IPI rather than the numbers and distribution of cellular puff sites. Fig. 1, A and B, show representative images of puffs in HEK 293 cells, and similar TIRF images of puffs in SH-SY5Y cells are presented in (9). An ROI (diameter ∼1 μm) was retrospectively defined to include a single puff site, and the frequency of puffs within this ROI was then analyzed. Typical records of puffs arising in an SH-SY5Y cell and a HEK 293 cell are shown in Fig. 1. We typically observed 4–5 puff sites within SH-SY5Y cells (9,37) and a single site in HEK 293 cells. We analyzed 35 traces from SH-SY5Y cells and 41 traces from HEK 293 cells, with 13–100 puffs in each trace.
To obtain long puff sequences for statistical analysis while minimizing rundown of puff amplitudes, we used weak flashes to photo release iIP3. This was achieved by varying the duration of the flash (50–100 ms) for recordings from SH-SY5Y cells (Fig. 1 C) (37) and the intensity of a very brief flash (∼1 ms) for HEK 293 cells (Fig. 1 D). Without EGTA, global spikes are induced even at weak stimulation, due to diffusive coupling of puff sites (22,37). It would require impracticably long time series to show that EGTA completely uncouples puff sites, but it is clear from the results that the treatment is sufficient to eliminate Ca2+ spiking and cellular timescales from puff site behavior.
From the IPI sequences (Fig. 1, E and F), we first computed histograms of the IPI measured at each individual puff site (Fig. 2, A–D). Most of the histograms show an initial increase of the IPI distribution. That is compatible with recovery from a negative feedback occurring during the puff. Recovery from such an inhibition can be described by a process with a time-dependent probability per time unit for occurrence of a puff λ: λ(t) = λ0(1-exp(−ξt)) (see Methods Eq. 1). The parameter ξ is the rate of recovery from negative feedback: ξ = 0 means infinitely slow recovery; whereas for large ξ, the Poisson process with constant λ is approached.
The shape of the distributions, fitted to Eq. 1, shows considerable variability between puff sites of the same cell type (compare Fig. 2, A and C, and Fig. 2, B and D). For some sites, the ratio ξ/λ0 is so large (i.e., recovery from inhibition is so rapid) that the distributions are well fit by exponential distributions (Eq. 2) (Fig. 2, C–F). In these cases, the probability of a puff occurring is constant and unaffected by the preceding puff. But for many puff sites, ξ is smaller (i.e., recovery from global negative feedback is slow). These distributions have a lesser probability of a puff occurring immediately after a preceding puff, and a pronounced maximal probability at an IPI of the same order of magnitude as Tav (Fig. 2, A and B). This behavior is consistent with earlier measurements of Ca2+ puffs in Xenopus oocytes (12) and with model simulations (39,40). Fig. 2, G and H, illustrate the considerable variability in ξ-values between puff sites within each cell type.
Measured IPI are well fit by Eq. 1 (Fig. 2, A–D), with each IPI distribution invariably having only one maximum. Oscillatory behavior would provide a multimodal distribution with maxima at the period and multiples of it (41). We have not observed such multimodal distributions and conclude that for periods in the range of the average IPI, there is no periodicity in the IPI sequences.
In reaction-diffusion systems, the global period (ISI in our analyses) is set by the timescale of the local dynamics (i.e., the timescale of recovery from a puff). However, IPI distributions have maxima at <5 s for SH-SY5Y cells (Fig. 2, A and C), and <1 s for HEK 293 cells (Fig. 2, B and D), and recovery times (1/ξ) are shorter than 3 s in both cell types (Fig. 2, G and H). Average IPI in SH-SY5Y cells (<5 s) are considerably shorter than average ISI (∼100 s) after submaximal stimulation with carbachol to evoke formation of IP3 (42). Even when the stimulation intensity is increased, average IPI (∼2 s) remain shorter than ISI (10–20 s) (37). Furthermore, in HEK 293 cells ISI evoked by carbachol (>20 s) (23) are much longer than the IPI reported here. Likewise with Xenopus oocytes, IPI are shorter than ISI (24). We conclude that in each of these three systems, Xenopus oocytes, SH-SY5Y cells, and HEK 293 cells, the period of the Ca2+ spikes (ISI) is not set by the local dynamics of Ca2+ puffs (IPI).
The σ-Tav relation confirms the ansatz for the form of the IPI distribution
The relationship between the average (Tav) and standard deviation (σ) of the IPI can be obtained directly from the data. We use these data to check whether our ansatz (Eq. 1) for the IPI distribution is in agreement with experimental results. For both SH-SY5Y and HEK 293 cells, the σ-Tav relation is linear, with slopes <1 and intercepts on the Tav axis close to zero (Fig. 3, A and B). The intercept represents an absolute refractory period. The slope may be interpreted as a population-averaged coefficient of variation (CV = σ/Tav), which is a measure of noise in the underlying stochastic process. CV = 1 indicates a Poisson process, which has maximal noise, whereas CV = 0 would be a completely deterministic process (43). Our analysis indicates a stochastic process with no absolute refractory period, but with recovery processes that reduce the CV compared to a pure Poisson process. This conclusion concurs with our ansatz for the IPI distribution (Eq. 1) and with the values of the recovery rates obtained by fitting of single IPI distributions (see Fig. 2).
Figure 3.
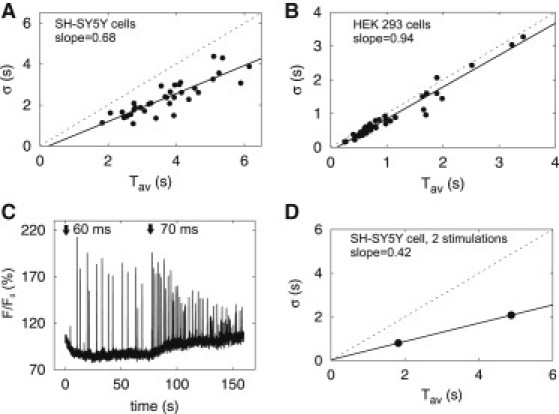
Relation of standard deviation (σ) and average (Tav) of IPI is linear with 0 s intercept and slope smaller than one. (A and B) From IPI sequences similar to those shown in Fig. 1, σ and Tav were calculated. Dashed lines mark the identity function, and solid lines are linear fits with the indicated slope. Each point is from a single puff site in either a SH-SY5Y cell (A) or a HEK 293 cell (B). The intercepts with the Tav axis are 0.26 s (A) and 0.11 s (B). (C) Fluorescence at a single puff site in a SH-SY5Y cell was recorded during stimulation with two successive ultraviolet-flashes at the indicated times and with the indicated flash durations. Because the basal fluorescence intensity increased after the second stimulus, running averages were subtracted for statistical analysis (see Methods). (D) Individual σ-Tav relation from the data shown in C, which provides two data points with σ and Tav for the puff site.
Hitherto, σ-Tav relationships have been derived from comparison of different puff sites, each providing a single σ and Tav (Fig. 3, A and B). To allow the relationship to be analyzed for a single puff site, SH-SY5Y cells were successively stimulated with flashes of increasing intensity and the puff sequences were recorded from the same site after each stimulus (Fig. 3 C). Two values of σ and Tav from these sequences are sufficient to determine a linear relation, yielding the relationship for an individual puff site (Fig. 3 D). From seven independent experiments, the average slope of single-site σ-Tav relations was 0.49 ± 0.14, shallower than that of the population relationship (0.68, see Fig. 3 A), and the average intercept was –0.11 s ± 0.73 s. In both the population and the single-site analyses, the intercepts were almost 0 s, and the slopes <1, indicating recovery processes without an absolute refractory period.
For IP3-evoked Ca2+ signals, the σ-Tav relationship for ISI from individual cells is very similar to that for the population (23). The present analysis of IPI shows that this is not the case for local puff sites. This is consistent with heterogeneity in the recovery process among puff sites (see Fig. 2). The similarity of individual and population σ-Tav relations for ISI (33,44) is therefore a property of the collective behavior of many puff sites.
IPI sequences are not periodic
Another test for the regularity of oscillations is by analysis of correlations between successive events. If puff sequences were to represent noisy oscillations with a period (ISI) of several average IPI, the points in a plot of the nth versus the (n + 1)th IPI (called return map) would lie only around the periphery of a closed curve (being an ellipse in case of sinusoidal oscillations) but not in the center of the area bound by the curve: A pure periodic process moves on a closed trajectory in a plain spanned by any pair of its dynamic variables, because it repeats its trajectory again and again. This applies also when we choose the nth and (n+1)th IPI as these dynamic variables (Fig. 4, A and B). For given amplitude of the IPI changes during one period, the larger the number of IPI per period, the smaller is the difference between successive IPI. Hence, the larger the number of IPI per period, the more similar is the closed trajectory to the line IPI(n) = IPI(n+1) (Fig. 4, A and B).
Figure 4.
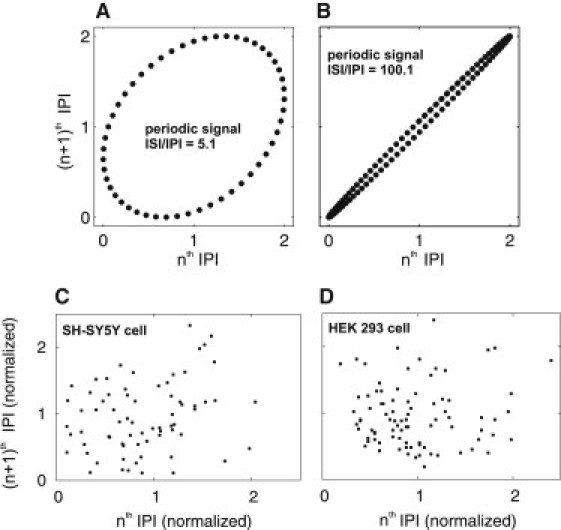
Successive IPI are uncorrelated. (A and B) Return plot for the pure periodic process f = Asin(2πn/N) + B, where A = 1 is the amplitude, B = 1 shifts the process to positive values, n indexes the IPI, and N is the ratio of ISI and IPI: N = 5.1 (A), 100.1 (B). In this periodic process, the relation of the nth versus the (n + 1)th IPI resembles an ellipse, and the width depends on N. (C and D) Return maps of typical puff sites in a SH-SY5Y cell (C) and a HEK 293 cell (D). IPI have been normalized to the average IPI of the site. The obvious lack of an elliptical relationship suggests that there is no periodic relationship between IPI.
We performed such an analysis for all traces containing more than 40 (SH-SY5Y, n = 4) or 60 (HEK, n = 4) successive puffs. Fig. 4, C and D, show typical examples: the pattern is clearly not a regular ellipse. Other methods to test for periodicity, including time correlation or Fourier transform, are not applicable here because they require much longer sequences to give meaningful results (45,46). However, our combination of σ-Tav relations, IPI distributions, and return maps provide strong support for the conclusion that Ca2+ puffs are not periodic and have recovery times that are much faster than global Ca2+ spikes.
Conclusion
After our discovery that Ca2+ spikes emerge from the interaction of clusters of IP3R in a stochastic way (23), we sought to quantify the relationships between puff dynamics and global sequences of Ca2+ spikes. We recorded sequences of Ca2+ puffs free of global dynamics by using EGTA to reduce Ca2+-mediated coupling between puff sites (9,37) (see below). We show that puff dynamics are governed by a stochastic process with average IPI that are much shorter than cellular ISI. Furthermore, puff sites are subject to refractoriness, which does not result in an absolute refractory period but generates a maximum in the IPI distribution (Fig. 2, A–D). Recovery from refractoriness is heterogeneous between puff sites in both SH-SY5Y and HEK 293 cells (Fig. 2, E–H). Some sites recover much faster than the average IPI and so exhibit IPI distributions that are well approximated by an exponential function (Fig. 2, C and D). For other sites, the timescale of recovery is comparable to the average IPI. The heterogeneity of puff sites does not interfere with the ability of cellular Ca2+ spike sequences to transmit information, as we have shown recently on theoretical grounds (33).
We found no evidence for oscillatory dynamics of individual puff sites with a period in the range of the average IPI. We show that IPI exhibit short-lived refractory periods, and that average IPI are briefer than cellular ISI. These conclusions agree with earlier results of population-averaged IPI distributions (12,24). However, our high-resolution statistical analyses of IPI at individual sites exclude the possibility that maxima in IPI distributions were lost due to averaging in earlier studies. We found no evidence that the dynamics of puff sites operate on timescales similar to ISI, and therefore no support for an oscillatory regime of the local IP3-induced Ca2+ release dynamics. This agrees with our conclusion from analysis of Ca2+ spike sequences that intracellular Ca2+ dynamics are not generated by a deterministic oscillator (23). Those results were predicted from simulations of local cytosolic [Ca2+] and a channel state model in which the sensitivity of channel dynamics to Ca2+ feedback was in the range of measured values (11,17). Channel cluster dynamics are nonoscillatory (except in very small unphysiological parameter ranges), because local Ca2+ concentrations saturate feedback (17). Our study here provides direct support for those predictions from analysis of the dynamics of single puff sites.
If Ca2+ oscillations do not arise from local oscillatory dynamics, how can we explain the emergence of the timescale of Ca2+ spikes at the cellular level? The cellular timescale arises from global feedbacks and the wave-like character of global Ca2+ spikes. A global spike occurs when a puff initiates a Ca2+ wave that spreads through the cell, and because this nucleation event is less likely than the occurrence of a puff, cellular timescales (ISI) are longer than average IPI (23). This also explains why small additions of Ca2+ buffer, which weakens the spatial coupling of puff sites by Ca2+ diffusion, dramatically increase the average ISI and the standard deviation (23,31). Recovery from global negative feedback (such as depletion of Ca2+ from the ER) and/or (slow) positive feedback (such as accumulation of pacemaker Ca2+) (24), slowly increase the wave nucleation probability after a Ca2+ spike. Such global feedback determines the average ISI. Regular oscillations arise when the probability of initiating a Ca2+ spike rises quickly after a refractory period (23,44). This might occur if there was cooperativity in the negative feedback, for example (47) or if an oscillating system drove intracellular Ca2+ release (48).
Many mathematical models assume local oscillatory dynamics (6,49), but this is inconsistent with our experimental results. These models typically assume that the ISI is determined by recovery from refractoriness of the puff site, but this leads to either unrealistically long recovery times or ISI that are too short. A recent modeling study (33) using IPI distributions similar to those presented here and measured puff duration distributions showed that the wave nucleation mechanism described previously is sufficient to generate the cellular timescale. Global feedbacks explain the variety of ISI distributions observed in different cells and they determine the information content of Ca2+ signals (33,48). The ISI distributions generated by this model are simple in that they are characterized by only two or three parameters. That simplicity allows the system to transmit information robustly (33) because it guarantees convergence of the many pathways controlling Ca2+ signals onto only two control parameters. IPI distributions presented here are also simple: they are characterized by the recovery rate ξ and the asymptotic puff probability λ0 (Eq. 1). However, we did not find a conserved and robust variable or function as the slope of the σ-Tav relation in cellular signals.
Waves of release cause global Ca2+ concentration spikes during IP3-induced Ca2+ signaling (13,14), but it was not hitherto known whether the waves cause the dynamics on the timescale of the ISI or merely synchronize clusters oscillating on that timescale. We have now shown that waves cause the spike timescale. IP3-induced Ca2+ signaling is a hierarchical system where each structural level has its own timescale due to its specific spatial organization of the release channels.
Acknowledgments
We thank Alexander Skupin for source-codes for spike-train analysis and discussions.
K.T. was supported by the Deutsche Forschungsgemeinschaft, SFB 555, by the Functdyn program of the European Science Foundation, and, for laboratory work, by the Wellcome Trust. I.P. acknowledges funding by National Institutes of Health grants GM65830 and GM48071. C.W.T. and S.C.T. were supported by the Wellcome Trust (085295).
Footnotes
This is an Open Access article distributed under the terms of the Creative Commons-Attribution Noncommercial License (http://creativecommons.org/licenses/by-nc/2.0/), which permits unrestricted noncommercial use, distribution, and reproduction in any medium, provided the original work is properly cited.
References
- 1.Keener J., Sneyd J. Springer; New York: 2009. Mathematical Physiology. [Google Scholar]
- 2.Wolf J., Passarge J., Westerhoff H.V. Transduction of intracellular and intercellular dynamics in yeast glycolytic oscillations. Biophys. J. 2000;78:1145–1153. doi: 10.1016/S0006-3495(00)76672-0. [DOI] [PMC free article] [PubMed] [Google Scholar]
- 3.Busse D., de la Rosa M., Höfer T. Competing feedback loops shape IL-2 signaling between helper and regulatory T lymphocytes in cellular microenvironments. Proc. Natl. Acad. Sci. USA. 2010;107:3058–3063. doi: 10.1073/pnas.0812851107. [DOI] [PMC free article] [PubMed] [Google Scholar]
- 4.Falcke M., Hudson J.L., Lechleiter J.D. Impact of mitochondrial Ca2+ cycling on pattern formation and stability. Biophys. J. 1999;77:37–44. doi: 10.1016/S0006-3495(99)76870-0. [DOI] [PMC free article] [PubMed] [Google Scholar]
- 5.Taylor C.W., Laude A.J. IP3 receptors and their regulation by calmodulin and cytosolic Ca2+ Cell Calcium. 2002;32:321–334. doi: 10.1016/s0143416002001859. [DOI] [PubMed] [Google Scholar]
- 6.Falcke M. Reading the patterns in living cells–the physics of Ca2+ signaling. Adv. Phys. 2004;53:255–440. [Google Scholar]
- 7.Foskett J.K., White C., Mak D.O. Inositol trisphosphate receptor Ca2+ release channels. Physiol. Rev. 2007;87:593–658. doi: 10.1152/physrev.00035.2006. [DOI] [PMC free article] [PubMed] [Google Scholar]
- 8.Taylor C.W., Tovey S.C. IP3 receptors: toward understanding their activation. Cold Spring Harb. Perspect. Biol. 2010;2:a004010. doi: 10.1101/cshperspect.a004010. [DOI] [PMC free article] [PubMed] [Google Scholar]
- 9.Smith I.F., Parker I. Imaging the quantal substructure of single IP3R channel activity during Ca2+ puffs in intact mammalian cells. Proc. Natl. Acad. Sci. USA. 2009;106:6404–6409. doi: 10.1073/pnas.0810799106. [DOI] [PMC free article] [PubMed] [Google Scholar]
- 10.Taufiq-Ur-Rahman, Skupin A., Falcke M., Taylor C.W. Clustering of InsP3 receptors by InsP3 retunes their regulation by InsP3 and Ca2+ Nature. 2009;458:655–659. doi: 10.1038/nature07763. [DOI] [PMC free article] [PubMed] [Google Scholar]
- 11.Thul R., Falcke M. Release currents of IP3 receptor channel clusters and concentration profiles. Biophys. J. 2004;86:2660–2673. doi: 10.1016/S0006-3495(04)74322-2. [DOI] [PMC free article] [PubMed] [Google Scholar]
- 12.Yao Y., Choi J., Parker I. Quantal puffs of intracellular Ca2+ evoked by inositol trisphosphate in Xenopus oocytes. J. Physiol. 1995;482:533–553. doi: 10.1113/jphysiol.1995.sp020538. [DOI] [PMC free article] [PubMed] [Google Scholar]
- 13.Marchant J.S., Callamaras N., Parker I. Initiation of IP3-mediated Ca2+ waves in Xenopus oocytes. EMBO J. 1999;18:5285–5299. doi: 10.1093/emboj/18.19.5285. [DOI] [PMC free article] [PubMed] [Google Scholar]
- 14.Bootman M., Niggli E., Lipp P. Imaging the hierarchical Ca2+ signalling system in HeLa cells. J. Physiol. 1997;499:307–314. doi: 10.1113/jphysiol.1997.sp021928. [DOI] [PMC free article] [PubMed] [Google Scholar]
- 15.Bootman M.D., Berridge M.J., Lipp P. Cooking with calcium: the recipes for composing global signals from elementary events. Cell. 1997;91:367–373. doi: 10.1016/s0092-8674(00)80420-1. [DOI] [PubMed] [Google Scholar]
- 16.Falcke M. On the role of stochastic channel behavior in intracellular Ca2+ dynamics. Biophys. J. 2003;84:42–56. doi: 10.1016/S0006-3495(03)74831-0. [DOI] [PMC free article] [PubMed] [Google Scholar]
- 17.Thul R., Falcke M. Stability of membrane bound reactions. Phys. Rev. Lett. 2004;93:188103. doi: 10.1103/PhysRevLett.93.188103. [DOI] [PubMed] [Google Scholar]
- 18.John L.M., Mosquera-Caro M., Lechleiter J.D. Control of IP3-mediated Ca2+ puffs in Xenopus laevis oocytes by the Ca2+-binding protein parvalbumin. J. Physiol. 2001;535:3–16. doi: 10.1111/j.1469-7793.2001.t01-2-00003.x. [DOI] [PMC free article] [PubMed] [Google Scholar]
- 19.Dolmetsch R.E., Xu K., Lewis R.S. Calcium oscillations increase the efficiency and specificity of gene expression. Nature. 1998;392:933–936. doi: 10.1038/31960. [DOI] [PubMed] [Google Scholar]
- 20.Li W., Llopis J., Tsien R.Y. Cell-permeant caged InsP3 ester shows that Ca2+ spike frequency can optimize gene expression. Nature. 1998;392:936–941. doi: 10.1038/31965. [DOI] [PubMed] [Google Scholar]
- 21.Schulman H., Hanson P.I., Meyer T. Decoding calcium signals by multifunctional CaM kinase. Cell Calcium. 1992;13:401–411. doi: 10.1016/0143-4160(92)90053-u. [DOI] [PubMed] [Google Scholar]
- 22.Berridge M.J., Bootman M.D., Roderick H.L. Calcium signalling: dynamics, homeostasis and remodelling. Nat. Rev. Mol. Cell Biol. 2003;4:517–529. doi: 10.1038/nrm1155. [DOI] [PubMed] [Google Scholar]
- 23.Skupin A., Kettenmann H., Falcke M. How does intracellular Ca2+ oscillate: by chance or by the clock? Biophys. J. 2008;94:2404–2411. doi: 10.1529/biophysj.107.119495. [DOI] [PMC free article] [PubMed] [Google Scholar]
- 24.Marchant J.S., Parker I. Role of elementary Ca2+ puffs in generating repetitive Ca2+ oscillations. EMBO J. 2001;20:65–76. doi: 10.1093/emboj/20.1.65. [DOI] [PMC free article] [PubMed] [Google Scholar]
- 25.Green A.K., Cobbold P.H., Dixon C.J. Thimerosal enhances agonist-specific differences between [Ca2+]i oscillations induced by phenylephrine and ATP in single rat hepatocytes. Cell Calcium. 1999;25:173–178. doi: 10.1054/ceca.1998.0017. [DOI] [PubMed] [Google Scholar]
- 26.Green A.K., Dixon C.J., Fisher M.J. Adenine dinucleotide-mediated cytosolic free Ca2+ oscillations in single hepatocytes. FEBS Lett. 1993;322:197–200. doi: 10.1016/0014-5793(93)81567-j. [DOI] [PubMed] [Google Scholar]
- 27.Rooney T.A., Sass E.J., Thomas A.P. Characterization of cytosolic calcium oscillations induced by phenylephrine and vasopressin in single fura-2-loaded hepatocytes. J. Biol. Chem. 1989;264:17131–17141. [PubMed] [Google Scholar]
- 28.Perc M., Green A.K., Marhl M. Establishing the stochastic nature of intracellular calcium oscillations from experimental data. Biophys. Chem. 2008;132:33–38. doi: 10.1016/j.bpc.2007.10.002. [DOI] [PubMed] [Google Scholar]
- 29.Dupont G., Abou-Lovergne A., Combettes L. Stochastic aspects of oscillatory Ca2+ dynamics in hepatocytes. Biophys. J. 2008;95:2193–2202. doi: 10.1529/biophysj.108.133777. [DOI] [PMC free article] [PubMed] [Google Scholar]
- 30.Williams G.S., Huertas M.A., Smith G.D. A probability density approach to modeling local control of calcium-induced calcium release in cardiac myocytes. Biophys. J. 2007;92:2311–2328. doi: 10.1529/biophysj.106.099861. [DOI] [PMC free article] [PubMed] [Google Scholar]
- 31.Skupin A., Falcke M. Statistical properties and information content of calcium oscillations. Genome Inform. 2007;18:44–53. [PubMed] [Google Scholar]
- 32.Skupin A., Falcke M. Statistical analysis of calcium oscillations. Eur. Phys. J. 2010;187:231–240. [Google Scholar]
- 33.Thurley K., Falcke M. Derivation of Ca2+ signals from puff properties reveals that pathway function is robust against cell variability but sensitive for control. Proc. Natl. Acad. Sci. USA. 2011;108:427–432. doi: 10.1073/pnas.1008435108. [DOI] [PMC free article] [PubMed] [Google Scholar]
- 34.Schuster S., Marhl M., Höfer T. Modelling of simple and complex calcium oscillations. From single-cell responses to intercellular signalling. Eur. J. Biochem. 2002;269:1333–1355. doi: 10.1046/j.0014-2956.2001.02720.x. [DOI] [PubMed] [Google Scholar]
- 35.Sneyd J., Falcke M., Fox C. A comparison of three models of the inositol trisphosphate receptor. Prog. Biophys. Mol. Biol. 2004;85:121–140. doi: 10.1016/j.pbiomolbio.2004.01.013. [DOI] [PubMed] [Google Scholar]
- 36.Mikhailov A. Springer; Berlin: 1994. Foundations of Synergetics. [Google Scholar]
- 37.Smith I.F., Wiltgen S.M., Parker I. Localization of puff sites adjacent to the plasma membrane: functional and spatial characterization of Ca2+ signaling in SH-SY5Y cells utilizing membrane-permeant caged IP3. Cell Calcium. 2009;45:65–76. doi: 10.1016/j.ceca.2008.06.001. [DOI] [PMC free article] [PubMed] [Google Scholar]
- 38.Dakin K., Li W.H. Cell membrane permeable esters of d-myo-inositol 1,4,5-trisphosphate. Cell Calcium. 2007;42:291–301. doi: 10.1016/j.ceca.2006.12.003. [DOI] [PubMed] [Google Scholar]
- 39.Higgins E.R., Schmidle H., Falcke M. Waiting time distributions for clusters of IP3 receptors. J. Theor. Biol. 2009;259:338–349. doi: 10.1016/j.jtbi.2009.03.018. [DOI] [PubMed] [Google Scholar]
- 40.Thul R., Thurley K., Falcke M. Toward a predictive model of Ca2+ puffs. Chaos. 2009;19:037108. doi: 10.1063/1.3183809. [DOI] [PubMed] [Google Scholar]
- 41.Verechtchaguina T., Sokolov I.M., Schimansky-Geier L. Interspike interval densities of resonate and fire neurons. Biosystems. 2007;89:63–68. doi: 10.1016/j.biosystems.2006.03.014. [DOI] [PubMed] [Google Scholar]
- 42.Van Acker K., Nadif Kasri N., Callewaert G. IP3-mediated Ca2+ signals in human neuroblastoma SH-SY5Y cells with exogenous overexpression of type 3 IP3 receptor. Cell Calcium. 2002;32:71–81. doi: 10.1016/s0143-4160(02)00092-1. [DOI] [PubMed] [Google Scholar]
- 43.Van Kampen N.G. Elsevier Science B.V.; Amsterdam: 2002. Stochastic Processes in Physics and Chemistry. [Google Scholar]
- 44.Skupin A., Kettenmann H., Falcke M. Calcium signals driven by single channel noise. PLOS Comput. Biol. 2010;6(8) doi: 10.1371/journal.pcbi.1000870. pii: e1000870. [DOI] [PMC free article] [PubMed] [Google Scholar]
- 45.Press W.H., Flannery B.P., Vetterlin W.T. Cambridge University Press; New York: 1992. Numerical Recipes in C: The Art of Scientific Computing. [Google Scholar]
- 46.Cox D.R., Lewis P.A.W. John Wiley & Sons; New York: 1966. The Statistical Analysis of Series of Events. [Google Scholar]
- 47.Wang K., Rappel W.J., Levine H. Cooperativity can reduce stochasticity in intracellular calcium dynamics. Phys. Biol. 2004;1:27–34. doi: 10.1088/1478-3967/1/1/003. [DOI] [PubMed] [Google Scholar]
- 48.Kummer U., Olsen L.F., Baier G. Switching from simple to complex oscillations in calcium signaling. Biophys. J. 2000;79:1188–1195. doi: 10.1016/S0006-3495(00)76373-9. [DOI] [PMC free article] [PubMed] [Google Scholar]
- 49.Jung P., Swaminathan D., Ullah A. Calcium spikes: chance or necessity? Chem. Phys. 2010;375:625–629. [Google Scholar]