

Abstract
Recent studies have revealed that Ca2+ not only regulates the contraction of cardiomyocytes, but can also function as a signaling agent to stimulate ATP production by the mitochondria. However, the spatiotemporal resolution of current experimental techniques limits our investigative capacity to understand this phenomenon. Here, we created a detailed three-dimensional (3D) cardiomyocyte model to study the subcellular regulatory mechanisms of myocardial energetics. The 3D cardiomyocyte model was based on the finite-element method, with detailed subcellular structures reproduced, and it included all elementary processes involved in cardiomyocyte electrophysiology, contraction, and ATP metabolism localized to specific loci. The simulation results were found to be reproducible and consistent with experimental data regarding the spatiotemporal pattern of cytosolic, intrasarcoplasmic-reticulum, and mitochondrial changes in Ca2+; as well as changes in metabolite levels. Detailed analysis suggested that although the observed large cytosolic Ca2+ gradient facilitated uptake by the mitochondrial Ca2+ uniporter to produce cyclic changes in mitochondrial Ca2+ near the Z-line region, the average mitochondrial Ca2+ changes slowly. We also confirmed the importance of the creatine phosphate shuttle in cardiac energy regulation. In summary, our 3D model provides a powerful tool for the study of cardiac function by overcoming some of the spatiotemporal limitations of current experimental approaches.
Introduction
In addition to their essential role in supplying energy to the heart, cardiac mitochondria have been observed to take up and release calcium (Ca2+) in cardiomyocytes. However, although the Ca2+-buffering capacity of the mitochondria is potentially significant, its contribution to excitation-contraction coupling through the regulation of cytosolic [Ca2+] has been proven to be negligible (1). Moreover, recent studies have identified further functional significance of mitochondrial Ca2+ flux, in that it provides a signal to activate the electron transport chain and ATP synthesis (2,3). Because the change in cytosolic Ca2+ concentration also serves as the signal for sarcomere contraction (the primary energy-consuming function of the myocyte), Ca2+ flux to the mitochondria may constitute a feed-forward regulatory mechanism for rapid fine-tuning of energy balance within the myocardium. Whether such a feed-forward mechanism is indeed stimulated by the beat-to-beat changes in the mitochondrial calcium concentration (fast Ca2+ uptake model) or by integrated changes in cytosolic Ca2+ concentration (slow Ca2+ uptake model) remains to be determined (4,5).
Prior studies have demonstrated, using Ca2+ indicators, that mitochondrial Ca2+ concentration changes from beat to beat (6,7); however, the high potential of signal interference from cytosolic Ca2+ cannot be excluded in these studies (5,8). On the other hand, where the cytoplasmic Ca2+ fluorescence was minimized, both slow (9–11) and fast (12,13) mitochondrial Ca2+ uptake has been reported. Recent studies using genetically targeted mitochondrial Ca2+ probes reported the occurrence of fast Ca2+ uptake by the mitochondria, but with the slow decay of mitochondrial Ca2+ still apparent (14,15). Aside from the technical issues involved, research into the mode of mitochondrial Ca2+ uptake has demanded important mechanistic considerations. First, whereas the physiological Ca2+ transient peaks at 1–2 μmol/L under normal physiological conditions, the half-maximal effective concentration (EC50) of the Ca2+ uniporter is reported to be much higher (16,17). Put simply, for the mitochondria to take up a significant amount of Ca2+ in this setting, the mitochondria must sense a transient increase in localized [Ca2+] (in the microdomain). To date, the existence of such a microenvironment has been suggested only indirectly or theoretically (13,18,19). Second, because mitochondrial Ca2+ cycling dissipates both membrane potential (ΔΨ) and ΔpH across the mitochondrial inner membrane, additional energy is required for their maintenance. In this sense, it is questionable whether the beat-to-beat adjustment of mitochondrial ATP synthesis to energy demand is cost-effective. Despite the recent advances in equipment and techniques, the current experimental approaches cannot provide us with sufficient resolution with regard to both space and time to resolve these unanswered questions.
Computer simulations are now used for a wide array of applications, facilitating the understanding of complex biochemical and physical processes, including those involved in the bioenergetics of cardiomyocytes (13,20–23). In addition to its potential as an alternative to exhaustive experiments, computer simulation also enables unobstructed observation of biological processes, as well as accurate quantification of the processes occurring beyond the resolution limits of methods currently employed. However, the majority of simulated models constructed to date have primarily focused on the interactions of specific chemical species and elementary processes, with less attention afforded to the geometric aspects of organelle function or the physics underlying Ca2+ movement.
We previously developed a three-dimensional (3D) cardiomyocyte model based on the finite-element method, in which the Ca2+ wave and resultant contraction were reproducible and authentic (24). The study presented here significantly extends this line of research, enhancing the cardiomyocyte model by adding detailed subcellular structures, including the sarcolemma with t-tubule system, the SR (sarcoplasmic reticulum), the myofibril, and mitochondria. By solving the elementary processes in each organelle, diffusion of Ca2+ and energy metabolites, and deformation of the sarcomere induced by active contraction, this model is shown to successfully reproduce changes in cytosolic, intra-SR, and mitochondrial Ca2+ during contraction in various inotropic states observed by other experimental methods. Detailed analysis suggests that although the observed large cytosolic Ca2+ gradient facilitates uptake by the mitochondrial Ca2+ uniporter to produce beat-to-beat changes in mitochondrial Ca2+ concentration ([Ca2+]) near the Z-line region, the average mitochondrial [Ca2+] changes slowly. We also confirmed the importance of the creatine phosphate shuttle in cardiac energy regulation. Our 3D model of cardiac excitation-contraction and metabolism provides a powerful tool for in-depth analysis of cardiac physiology and function, expanding the temporal and spatial limits of current experimental approaches.
Materials and Methods
This model is an extension of our previous 3D cardiomyocyte model (24) to include metabolic processes as well as three features that distinguish it from our earlier model:
-
1.
Detailed subcellular structures, including the sarcolemma with t-tubule system, SR, myofibril, and mitochondria, are reproduced in 3D space, arranged based on published reports.
-
2.
The effect of specific reactions occurring within each functional component (metabolites or ions) able to diffuse across the cytosolic space in 3D, enabling observation of secondary effects at remote loci.
-
3.
The contraction (cross-bridge) model was modified to include the dependence of force generation on metabolite level, sarcomere length, and shortening velocity. Force generation and the resultant deformation of finite elements were repeated to reproduce the true physiological contraction of the myocyte.
The 3D finite-element model of the myocyte
Fig. 1 A displays the structure of the 3D myocyte model. To reduce the computational cost, the segment was modeled to contain three myofibrils of one sarcomere length, together with the adjacent cell membrane and organelle. The rationale behind the modeling was that it reproduced longitudinal periodicity and axial symmetry of the myocyte. It was assumed that in a cylindrical myocyte containing 40 myofibrils, three radially arranged myofibrils occupied the space between the cell membrane and the center of the myocyte. At the final stage, further reductions were implemented so that only one-quarter of this model (halved in both length and width) was included for analysis. Such modeling of the small symmetrical segment due to the limited computational power prevented reproduction of local heterogeneity and the axial elements of the t-tubule structure. To overcome this, models were tested in which the t-tubule was partially deleted. Although local deletion of t-tubule induced slight delays in both the upstroke and decay of local Ca2+ transients, global behavior of the cell (Ca2+ transient, ADP, and SR [Ca2+]) was not notably altered (Fig. S5 and Fig. S6 in the Supporting Material). In addition, L-type Ca2+ channels (LCCs) are not distributed in the axial elements of t-tubules (25); therefore, omission of the axial element from the model would not significantly affect Ca2+ handling. Accordingly, the original model illustrated in Fig. 1 was found to be sufficient and was used subsequently for all simulations. The 3D structure was modeled on a hexahedral solid finite-element model, consisting of 1861 nodes and 581 elements. The total numbers of degrees of freedom were 6164 for mechanical analyses and ∼20,000 for physiological simulation. Subcellular components including the mitochondria, myofibril (A-zone, I-zone, and M-line), junctional and network SR (JSR and NSR, respectively), cell membrane, and t-tubules were located at the appropriate nodes to reproduce the anatomical structure and occupy the relative volume (1,26–28). Because the function of each subcellular component was primarily based on the mathematical formulation proposed by Cortassa et al. (28), modeling of the excitation-contraction coupling of the guinea pig myocyte, the volume ratio of subcellular components (29), and ion channel distribution (30) was also adjusted based on the guinea pig cardiomyocyte. Each subcellular component could exchange ions and/or metabolites into the surrounding cytosol, and these molecules diffused freely through the cytosolic space.
Figure 1.
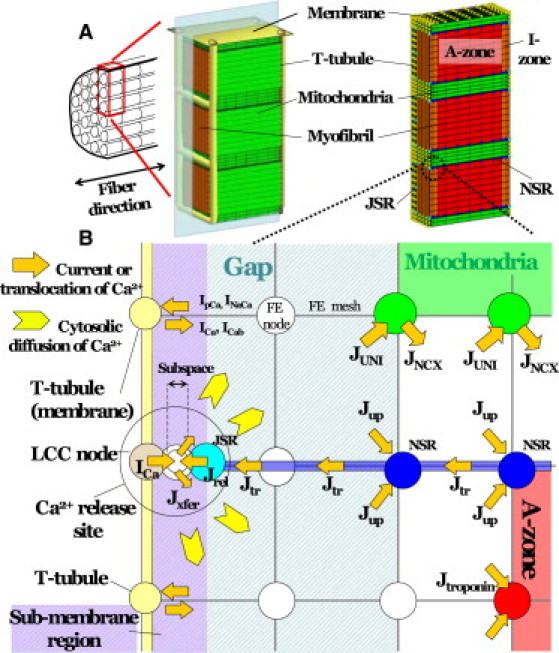
(A) 3D cardiomyocyte model consisting of three myofibrils of one sarcomere length, including adjacent cell membrane and organelles. The finite-element method was used for modeling. (B) Detailed illustration of the model near the t-tubule region including the pathways for Ca2+ regulation. Jx represents Ca2+ flux by either the uniporter (UNI) or the Na+-Ca2+ exchanger (NCX), uptake by NSR (up), release from JSR (rel), transfer from NSR to JSR (tr), transfer from subspace to cytosol (xfer), or binding to troponin C (troponin). Ix represents the Ca2+ current from the LCC (Ca), sarcolemmal Ca2+ pump (pCa), Na+-Ca2+ exchanger (NaCa), or background current (Cab). In this region, mesh sizes were made finer for more detailed analysis.
Reaction-diffusion equations
Several investigations of Ca2+ dynamics utilizing 3D models have been reported (24). The study described here adopted these formulas for calculating the transport and exchange of metabolites and signaling molecules.
The multiple reaction-diffusion fields for Ca2+ and five substrates, including creatine (Cr), creatine phosphate (CP), inorganic phosphate (Pi), adenosine triphosphate (ATP), and adenosine diphosphate (ADP), were defined in the cytosolic space. The reaction-diffusion equations have the x axis in the longitudinal direction, with the z axis in the radial direction, as described below.
At a node where a functional component exists,
| (1) |
Alternatively,
| (2) |
S denotes one of the six substrates, i indicates the location (node), is a diagonal matrix describing the diffusivity of substrate S, is the concentration of S at position i, and is the function describing the reaction of substrate S.
Details of the reaction and diffusion processes near Ca2+ release sites are illustrated in Fig. 1 B. In this model, the LCC node, JSR node, subspace node, and cytosolic node are colocalized to the Ca2+ release site but possess their own Ca2+ concentrations for finite-element analysis. The current through the LCC (ICa) flows into the subspace and activates ryanodine receptors located on the JSR node. Ca2+ released from the JSR (Jrel) also flows into the subspace and thereafter moves to the cytosolic node to diffuse throughout the entire cytosol. Within the cytosolic space, Ca2+ is taken up by the Ca2+ uniporter of the mitochondrial node, bound to troponin C in the A-zone thin filament, and sequestered by SERCA2 on the NSR before eventually being transported back to the JSR. Further details outlining the model can be found in the Supporting Material. Similar calculations were performed at each node and for all the ions and metabolites, where pertinent.
Mitochondria and energy metabolism
To incorporate the high EC50 of the Ca2+ uniporter, we adopted the model proposed by Dash et al. (31). Because mitochondria are exposed to a large cytosolic Ca2+ gradient, it was hypothesized that a Ca2+ gradient may also exist in the mitochondrial matrix, enabling it to activate the tricarboxylic acid cycle to regionally upregulate NADH and ATP synthesis. To reproduce this process, the reaction-diffusion equation of Ca2+ inside the mitochondrial matrix was performed separately considering impermeability of the mitochondrial inner membrane. The exchanges of ions and metabolites between the cytosol and matrix via the inner membrane were mediated by channels and uniporters. The transport of ions and energy metabolites is diagrammed in Fig. S3.
ATP synthesized within the mitochondrial matrix is released into the intermembrane space via the adenine nucleotide translocator (ANT) and transferred to the site of ATP utilization via one of two major pathways, direct diffusion or creatine phosphate (CP) shuttle. In the CP shuttle, ATP is converted to easily diffusible CP by mitochondrial creatine kinase (Mit-CK) localized within the intermembrane space. After diffusion of CP to the site of energy utilization, CP is converted back to ATP through an inverse reaction. The myofibril is the major site of energy utilization, where the ATP regenerating system is localized at the M-line as M-line-bound CK (32). Because no regenerating system exists at the A-zone, I-zone, or Z-line, regenerated ATP diffuses to the A-zone from the M-line. The relative contribution of these two pathways to energy transfer is examined in this study.
Excitation-contraction coupling and myocyte shortening
To establish the link between cross-bridge kinetics and energy metabolism, we adopted the sarcomere model developed by Negroni et al. (33), with a modification made by Matsuoka et al. (34). This model was positioned at each point of the A-zone and generated force depending on the local Ca2+ and energy-metabolite concentrations. Using these force values, the mechanical equilibrium was calculated using the finite-element method, assuming hyperelasticity of the material (material properties are listed in Table S2 and Table S3, with validation in Fig. S7 and Fig. S8).
Study protocol
Simulations were performed at 0.5, 1, and 2 Hz. Data obtained at the 200th contraction (pseudo-steady state) were compared. The effect of β-adrenergic stimulation was examined by upregulation of both the LCC (to 125%) and SR Ca2+ pump (to 200%) based on prior reports (35,36). The transient response after an abrupt increase in pacing rate from 0.25 to 2 Hz was also examined. The parameters for slow (maximum rate of mitochondrial Ca2+ uniporter (Vmaxuni) = 5.0 × 10⁻⁶ mM/ms, maximum rate of mitochondrial NCX (VmaxNCX) = 2.0 × 10⁻⁵ mM/ms) and fast (Vmaxuni = 2.0 × 10⁻⁵ mM/ms, VmaxNCX = 8.0 × 10⁻⁵ mM/ms) mitochondrial Ca2+ handling were applied, and the steady states and transient responses were compared.
Computation
Computation was performed using an Intel Xeon CPU (3.2 GHz) and required 1000 s for a single cycle of 1 Hz contraction. All program codes were written in-house.
Results
Ca2+ transients during contraction under steady-state conditions
Changes in [Ca2+], force, and [ADP] during free contractions at 1 Hz are illustrated as time-lapsed 3D images in Fig. 2, with other metabolites and mitochondrial Ca2+ illustrated in Fig. S10 and Movie S1. Ca2+ released from the JSR attains a high cytosolic concentration at both ends of the sarcomere but fades rapidly via uptake by the NSR as it diffuses toward the M-line (Fig. 2, left column). Force generation by the cross-bridges follows the [Ca2+] in the A-zone (Fig. 2, middle column). Accumulation of ADP also follows the course of force generation; however, spatial distributions were shifted toward the periphery (Z-line) due to the regeneration of ATP at the M-line and an enhanced ATP utilization rate (expressed as the rise in ADP level) caused by the high local [Ca2+] (Fig. 2, right column). In this simulation of 1 Hz, sarcomere shortening was found to be 9%. Membrane potential and currents are shown in Fig. S9.
Figure 2.
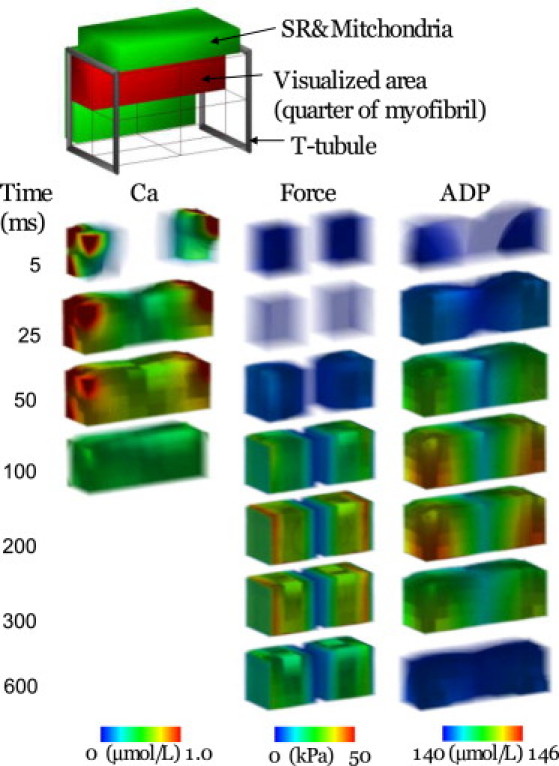
Time-lapse images displaying the spatial distribution of [Ca2+], force, and [ADP]. Each panel represents one-quarter of one sarcomere. Numbers on the left indicate time (ms) after the onset of contraction.
To further examine the spatiotemporal distribution of Ca2+ displayed in Fig. 2, local Ca2+ signals were sampled at various points in the cytosolic space and SR under both shortening and isometric conditions and plotted with the time course of length and force for each contraction mode (Fig. 3). The beginning of both shortening (Fig. 3 A) and isometric (Fig. 3 E) contraction was associated with an immediate rise in Ca2+ within the subspace (peaking at ∼100 μM). This rise coincided with a reduction in SR Ca2+ (Fig. 3, B and F). Ca2+ transients in the submembranous space (∼20 nm from the t-tubule (Fig. 3 I)) were plotted with cytosolic [Ca2+] (Fig. 3, C and G). Similar to the subspace, submembranous Ca2+ transients peaked rapidly, although they only reached ∼4 μM, comparable to previous experimental findings (Fig. 3 J (37)). Cytosolic [Ca2+] was averaged over the entire model except mitochondrial space, assuming that the experimentally recorded Ca2+ signal reflects the fluorescence averaged over the sarcomere. The averaged cytosolic Ca2+ transients determined by the current simulation were in agreement with published experimental results (Fig. 3 J (37)), supporting the validity of this model. Within the cytosolic space, data were recorded along the center of the sarcomere at two points, 0.1 μm (I-zone) and 0.7 μm (A-zone), respectively, from the Z-line (Fig. 3, D and H). In the I-zone, the Ca2+ transient peak was lower (∼1.6 μM) and delayed (∼40 ms under free contractions and ∼50 ms under isometric conditions) after depolarization. Ca2+ peaks at the A-zone were further reduced and delayed (∼65 ms) compared to the I-zone under both isometric and free conditions.
Figure 3.
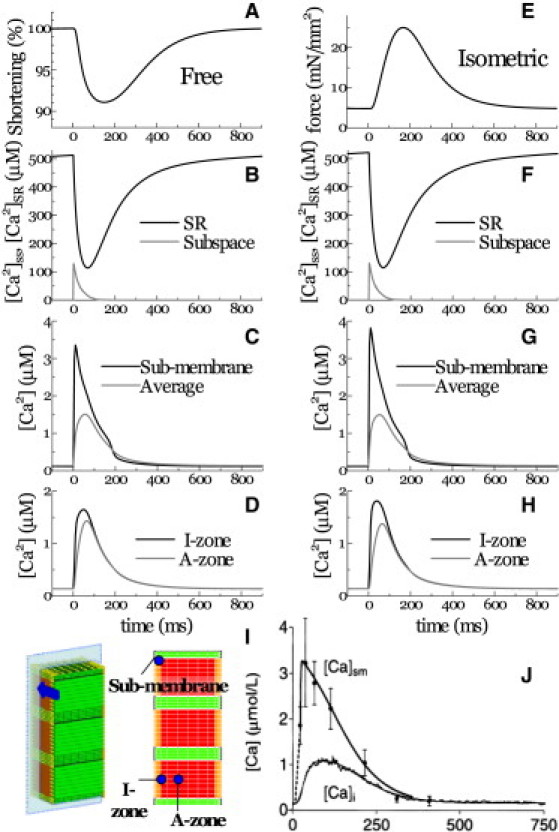
Ca2+ transients at various loci are displayed in response to changes in length (A) or force (E) for unloaded (left column) and isometric (right column) contraction. Ca2+ transients were sampled at the SR and the subspace (B and F), the I-zone and A-zone (C and G), and the submembrane (D) and whole-cytosolic (averaged) regions (H). (I) Positions referred to in panels C–H. (J) Experimental data for the submembrane and bulk cytosolic Ca2+ transients (reproduced from Weber et al. (37) by copyright permission of the American Heart Association).
Investigating the issue of a fast- or slow-uptake model for mitochondrial Ca2+ handling, we compared the simulation results based on the fast and slow parameter sets with experimental observations (13). For this purpose, mitochondrial and cytosolic Ca2+ transients were compared before and after positive inotropic intervention (Fig. 4, C and D (13)). Positive inotropy was stimulated by upregulation of both the LCC and the SR Ca2+ pump. Inotropic intervention increased the peak amplitude of the cytosolic Ca2+ transient and accelerated its rapid decay (Fig. 4 A, dashed line) when compared to control (solid line), as reported in the experiment (Fig. 4 C (13)). Global mitochondrial Ca2+ transients averaged over the entire mitochondrial space increased in amplitude and baseline levels (compare Fig. 4 B, solid and dashed lines) in both fast (red lines) and slow (black lines) models. The fast model produced greater magnitudes of mitochondrial [Ca2+] compared to the slow model, thus reproducing the experimental results (Fig. 4, C and D). However, observing the local mitochondrial Ca2+ transient near the Ca2+ release site under slow model conditions, its amplitude was found to be even larger than under fast model conditions (blue lines). Please note that its steep upstroke also resembles the experimental observation.
Figure 4.
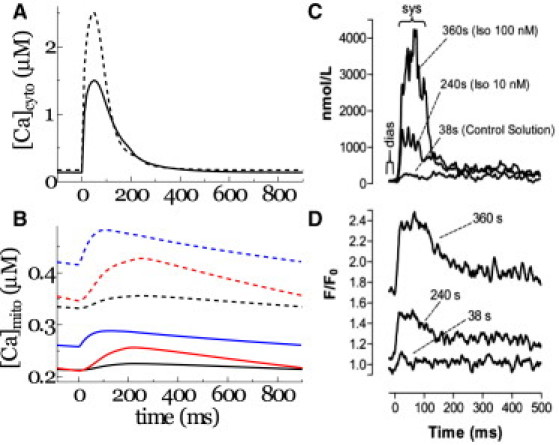
(A and B) Cytosolic (A) and mitochondrial (B) Ca2+ transients subjected to control (solid line) or positive inotropic (dashed line) conditions. Averaged mitochondrial Ca2+ transients under slow (black line) and fast (red line) parameters for mitochondrial Ca2+ handling, and local mitochondrial Ca2+ transient under slow parameters are compared in B. (C and D) Prior experimental data for cytosolic (C) and mitochondrial (D) Ca2+ transients from Maack et al. (13) are provided for comparison (by copyright permission of the American Heart Association).
Transient responses
The responses of [Ca2+]mito and [NADH] to abrupt changes in pacing rate were compared between the simulation presented here (Fig. 5, A and B) and the experimental results reported by Brandes and Bers in rat trabeculae (Fig. 5, C and D (38)). Following the experimental protocol of Brandes and Bers (38), the pacing frequency was abruptly increased from 0.25 Hz to 2 Hz, then relaxed back to 0.25 Hz. Both the fast and slow parameter sets were applied under these conditions, and the results were compared. When subjected to the fast parameters, the change in pacing rate caused a significant increase in mitochondrial Ca2+ transient amplitude (Fig. 5 A, red line). In contrast to the experimental results, the simulation failed to reveal either undershooting or overshooting of NADH (Fig. 5 B (red line) and D (38)). In contrast, under the slow parameters, the NADH response displayed both undershooting and overshooting (Fig. 5 B, black line), correlating with the rise of mitochondrial Ca2+ (Fig. 5 A, black line), consistent with the experimental results. Taken together, the mitochondrial Ca2+ transient produced by our simulation model is consistent with experimental findings only under slow Ca2+ handling parameters.
Figure 5.
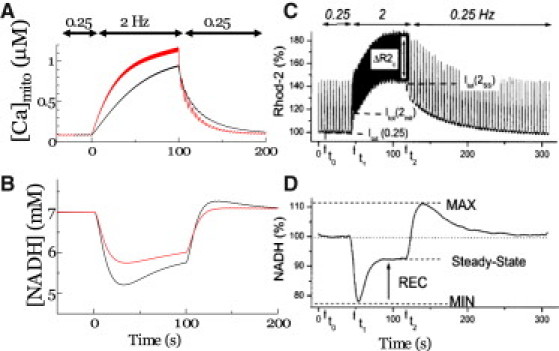
Simulated transient response of [Ca]mito (A) and [NADH] (B) are compared to prior experimental observations of NADH (C) and mitochondrial Ca2+ (D) after an increase in stimulation frequency from 0.25 to 2 Hz in rat cardiac trabeculae (reproduced from Brandes and Bers (38) by copyright permission of the Biophysical Society). Under the simulation model, two sets of parameters, fast (red line) and slow (black line), are used.
Energy metabolism
Temporal changes in the concentrations of energy metabolites at various loci within the sarcomere were plotted with [Ca2+] at three different pacing rates (Fig. 6 and Fig. S10). The concentration of Ca2+ was found to decrease rapidly after peaking near the Z-line with a progressive delay in its peak timing when approaching the M-line (Fig. 6, top row). ADP accumulation was found to occur in the Z-line half of the sarcomere, but displayed no delay in its timing (Fig. 6, second row). The concentration of creatine increased gradually but homogeneously along the fiber direction due to its high diffusivity (Fig. 6, third row). These trends were common to all three pacing conditions tested. In contrast, the response of ANT activity (VANT) in the mitochondria displayed a unique dependence on the pacing rate (Fig. 6, bottom row). At low pacing (0.5 Hz), VANT peaked at ∼100 ms near the Z-line (early peak), with a less prominent peak also apparent (yellow green) at ∼400 ms near the M-line (late peak), which coincided with the peak of Cr. The late peak became diminished with increased pacing, and at 2 Hz was no longer evident.
Figure 6.
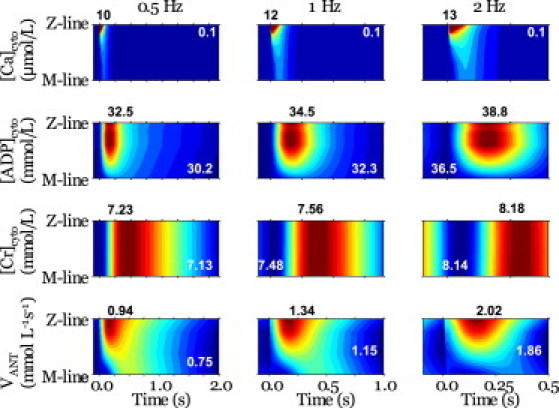
Spatiotemporal patterns of (top to bottom) [Ca2+]cyto, [ADP]cyto, [Cr]cyto, and ANT exchange velocity. Results for loading of 0.5 Hz (left column), 1 Hz (regarded as control) (middle column), and 2 Hz (right column) are compared. Each panel presents data from half of one sarcomere, with the Z-line at the top and the M-line at the bottom, after each stimulus. Maximum values (dark red) are given by black numbers above the panels, and minimum values (dark blue) by white letters in the panels.
The total amount of ATP synthesis occurring within the sarcomere was compared with the amount converted to CP when subjected to 0.5, 1, or 2 Hz of pacing. The fraction of energy supplied by the CP shuttle system was calculated to be 48.8% (76.1 of 155 μmol L−1 s−1) at 0.5 Hz, 47.4% (114 of 241 μmol L−1 s−1) at 1 Hz, and 46.5% (183 of 393 μmol L−1 s−1) at 2 Hz.
Discussion
An integrated model of cardiomyocyte function
This study employed a 3D cardiomyocyte model in which the electrical, energetic, and mechanical dynamics were integrated with detailed ultrastructures. There have been several previous attempts to develop computational models capable of coupling electrophysiology and Ca2+ handling with mitochondrial energetics (28,34); however, because the majority of these models are lumped-parameter models, assuming microcompartments of reaction pools to avoid the computationally challenging partial differential equations, these models only provide us with spatially averaged behavior of ions and metabolites. More intricate models that account for the spatiotemporal pattern of subcellular activities have been developed, but these models have focused only on the transfer of energy metabolites (20,39). To our knowledge, this is the first 3D model to define myocardial energetics coupled with both electrophysiology and Ca2+ handling, and to be capable of reproducing the reaction-diffusion phenomena involved in cardiac energy production and utilization. The results obtained using this model go a long way toward explaining some of the controversies currently debated in the field of myocardial energy dynamics, as this model is not subject to the spatiotemporal resolution limitations imposed by current experimental techniques.
Comparison with previous experimental studies
The current simulation model successfully reproduced fundamental contractile characteristics of the cardiac sarcomere. Not only was the average cytosolic [Ca2+] (∼1 μM) amplitude and [Ca]SR profile typical of a cardiac sarcomere (Figs. 3, B and F, and 4, A and C), but the subcellular distributions and temporal changes of Ca2+ were also consistent with previous investigations. For example, Weber et al. (37) estimated the submembrane [Ca2+] ([Ca2+]sm), sensed by the Na-Ca exchanger (NCX) by determining the NCX tail current and bulk [Ca2+] ([Ca2+]b) transient. They revealed that the [Ca2+]sm reaches its peak in <32 ms of the action-potential upstroke, and to a level higher than bulk [Ca2+] (Fig. 3 I). Consistent with this observation, submembrane [Ca2+] in our simulation was found to peak at 10 ms (∼4 μM) (Fig. 3, C and G). Observing the subspace [Ca2+], no experimental data have been reported to date, although several numerical estimates using detailed diad geometry (40,41) yield values similar to those of the simulation presented here (Fig. 3, B and F). As for the effect of contraction mode, the peaks of local Ca2+ transients under isometric conditions were found to be higher in the submembrane region and I-zone, but reduced in the A-zone compared to the Ca2+ transients under free contraction (compare Fig. 3, C and G, and Fig. 3, D and H). Furthermore, the time to peak in the I-zone was faster by 10 ms. These differences in Ca2+ dynamics observed under different loading conditions are due to the increase in diffusion distance caused by widening of the myocyte; however, we are unaware of any comparable experimental data. On the other hand, the global Ca2+ transient did not differ between the isometric and free-contraction modes (compare Fig. 3, C and G). This finding supports a previous study by White et al. indicating that altering length had no effect on the global Ca2+ transient in guinea pig myocytes (42). In contrast, Yasuda et al. reported a significant increase in Ca2+ transient peak during shortening contraction in rat ventricular myocytes (43). The cause of this discrepancy remains to be confirmed, but the strain dependence of affinity of Ca2+ for troponin C, which we did not incorporate into this model, could be a factor.
Some studies using 31P NMR (44,45) have identified cyclic changes in high-energy phosphate levels (∼10%) during the cardiac cycle. However, other studies have found that cyclical changes are undetectable, or estimated to be only 1.6%, even assuming instantaneous ATP hydrolysis with no resysnthesis (46,47). The reason for this discrepancy is not clear, but as discussed by Illing et al. (44), cyclic changes are mainly found with a high heart rate under crystalline perfusion (inadequate substrate supply) and in vivo large animal studies (low heart rate and blood perfusion) were unable to detect ATP cycling. Our model assumed an adequate substrate supply and reproduced cyclic changes in these metabolites (Fig. 6), but the relative amplitude was small (<1%). Consistent with these results, a simulation study that took into account the effect of high subsarcolemmal Ca2+ concentration on the regulation of metabolite concentrations reported even smaller fluctuations (48).
Mitochondrial response
In response to experimentally induced changes in the pacing rate, [Ca]mito is reported to increase or decrease gradually, whereas NADH levels are reported to undershoot and overshoot at the transitions (Fig. 5, C and D) (38). Our simulation reproduced these responses in [Ca2+]mito and NADH, paralleling the experimental findings over time; however, these effects were only produced under the slow parameters for mitochondrial Ca2+ handling (Fig. 5, A and B). Despite these promising comparative results, the large beat-to-beat oscillations in [Ca2+]mito were not observed in our simulation, nor in the simulation study of Cortassa et al. (28). For the large beat-to-beat oscillations in [Ca]mito to occur, the mitochondrial Ca2+ uniporter must encounter high local [Ca2+]cyto due to its high EC50. In addition, a high velocity of mitochondrial Ca transport is required. Because our simulation is comprised of a high submembrane [Ca2+]cyto, the fast parameters, i.e., high Vunimax and high VNCXmax, reproduced the large beat-to-beat [Ca2+]mito oscillations (Fig. 4 B, solid lines); however, the under- and overshooting of NADH disappeared under fast parameters (Fig. 5 B, red line). The disparities between our model and prior experimental reports of beat-to-beat [Ca2+]mito oscillations and NADH levels may be explained by the following two possibilities. 1), The experimentally determined fluorescent Ca2+ signal may come preferentially from near the Z-line region, where a large transient with steep upstroke can be obtained in our simulation under slow parameters (Fig. 4 B, blue lines). 2), The disparity may be due to potential errors in modeling the NCX, originating from the controversies of its stoichiometry (49) and Km dependency on matrix pH (50).
The predicted reductions in cytosolic Ca2+ transients due to mitochondrial uptake at 1 Hz were ∼2% and 7% under slow and fast mitochondrial Ca2+ handling parameters, respectively. Most experimental estimates suggest that this fraction is <∼2% (1), supporting the slow model, but one study reported values as high as ∼36% (13), which were estimated from large beat-to-beat [Ca2+]mito oscillations. The above discussion may be applied to reconcile such discrepant findings, and in fact, the latter study also suggested that the close proximity of the mitochondria to the Z-line region is the key to realizing a fast response. The authors of that study also performed numerical simulations to reproduce large cyclic changes in [Ca2+]mito by referring to the [Ca2+] in subspace, but metabolic processes were not included in their model.
Finally, it is notable that [Ca2+]mito is not solely governed by the mitochondrial Ca2+ uniporter sensing transient high [Ca2+]cyto induced by SR Ca2+ release. During the resting phase, Ca2+ extrusion by NCX in t-tubules lowers [Ca2+]cyto to near the Z-line region to facilitate the release flux of Ca2+ by mitochondrial NCX. In addition, because the actions of the mitochondrial uniporter and NCX are driven by the inner membrane potential, the energetic state also affects mitochondrial Ca2+ cycling.
Functional significance of the CP shuttle
Comparison of the findings of spatiotemporal distribution of energy metabolites under different loading conditions suggests the functional significance of CP shuttling. At 0.5 Hz, ANT activity was found to peak at ∼100 ms at loci near the Z-line (Fig. 6, bottom row, left), which coincides with the peak of ADP (Fig. 6, second row, left). Because [ADP] preferentially increases in this region, it is natural to consider that this early peak in ANT activity is induced by the ADP diffusing into the mitochondria. However, we found that the region of high [ADP] is shifted to the I-band rather than to the A-band, where ATP consumption is high (Fig. 6, second row, and Fig. 2). This shift in ADP distribution, caused by M-line-bound CK, may be beneficial for force generation, by avoiding the accumulation of ADP around cross-bridges at the A-band. It is interesting that we identified another less prominent peak in VANT at 400 ms, coinciding with the Cr peak. It appears that this late peak of VANT may extend toward the Z-line, delaying the decay of ANT activity near the Z-line. Although ANT is not directly activated by Cr, such a spatiotemporal coincidence suggests that the Cr-CP system is capable of modulating mitochondrial activity without raising the ADP level at the A-band.
As the pacing rate was increased, the late VANT peak became less prominent, and at 2Hz, it had ceased to exist, with only the early peak at ∼100 ms (Fig. 6, bottom row, right), despite Cr maintaining its delayed peak, as observed under lower loading conditions. Further analysis revealed that the concentration of Cr, even at its nadir, is much greater than the peak value observed under control conditions (Fig. 6, third row). We hypothesize that this is likely due to the limited capacity of the mitochondria to maintain the energy balance in response to the excessive amount of ADP produced. This would subsequently cause [Cr] to remain elevated throughout the relaxation phase. Put simply, the Cr system providing the stimulatory signal for energy production has become saturated. The contribution of the CP shuttle in the energy-transfer process supports this hypothesis, as the absolute contribution of the CP shuttle was found to increase with higher-frequency pacing (from 76.1 μmol L−1 s−1 under 0.5 Hz to 183 μmol L−1 s−1 under 2 Hz), although the relative contribution was in fact reduced (from 48.8% under 0.5 Hz to 46.5% under 2 Hz). Our simulation model calculations indicated that the CP shuttle system had a relative contribution of ∼50%, comparable to results of a prior experimental study demonstrating that the uncoupling of the CK system lowered the sliding velocity of cardiac myosin by 30% (51). Moreover, Kaasik et al. also reported that ATP directly supplied by the mitochondria was nearly as effective as CK-supplied ATP, and they estimated that 65% of the ATP consumed came from the CK reaction, with the remaining 35% from the mitochondria (52).
Limitations of the model
Because of the current lack of experimental observations of some of the material properties and microscopic structures, this model required the use of estimations and approximations that warrant further explanation. First, in the reaction-diffusion equations, electrical field and convection are not considered to be the source of motive force for the transport of ions and metabolites. Although their contribution is considered to be small compared with that of diffusion, quantitative analyses over a wide range of conditions are required. To model mitochondrial membrane potential, the electric field was ignored, assuming equipotential of the mitochondrial membrane, partly due to the complex folding of its structure. However, we cannot deny the possibility that uneven distribution of ions in the cytosol and/or mitochondrial matrix could create potential gradients, altering ATP synthesis.
Second, diffusion coefficients inside the mitochondrial matrix are controversial. Experimental estimates of matrix diffusivity range from one-third to one-fortieth of that of the cytosol (53,54). Moreover, a prior simulation study reported that the apparent diffusion coefficient of a closed cylinder decreased to half, with 20 diffusion barriers, each occluding 53% of the lumen (55). Preliminary studies were performed in which the diffusivity was varied from one-half to one-thousandth of that of the cytosol, but little difference in energetic balance was detected (data not shown). The lack of change could be partially due to the equipotential assumption of the mitochondrial membrane, but this remains to be confirmed.
The mathematical models for the LCC need improvements to respond to regional variation in Ca2+ transients. Because the models currently used are phenomenological in nature and designed to function either in the junction or on the surface of sarcolemma, we needed to use two different models of LCC depending on the range of [Ca2+] they refer. This point is further discussed in Section 3 of the Supporting Material.
Because of the limited computational power, we attempted to examine the role of a general, idealistic arrangement of subcellular structures. However, as suggested by a recent study (56), geometry that is more realistic can change the diffusion distances and affect the predictions of Ca2+ and metabolite gradients.
The concept of the CaRU consisting of LCCs and RyRs is supported by the observation of Ca2+ sparks (57), but we did not simulate this important phenomenon in our study. Further improvement of the model is required to reproduce such a stochastic process.
Acknowledgments
This research is supported by the Japan Society for the Promotion of Science (JSPS) through its Research Fellowships for Young Scientists (to A.H.) and its Funding Program for World-Leading Innovative R&D on Science and Technology (FIRST) (to A.H., J.O., T.W., S. S., and T.H.), and by JSPS KAKENHI (grant-in-aid) (B) (20300152) (to S.S.). It was also supported by the Japan Science and Technology Agency (JST) through its University-Industry Collaborative Grants Fostering Innovation in Technology-Seeds.
Supporting Material
References
- 1.Bers D.M. Excitation-Contraction Coupling and Cardiac Contractile Force. Kluwer Academic; Dordrecht: 2001. Sources and sinks of activator calcium; pp. 39–56. [Google Scholar]
- 2.Balaban R.S., Bose S., Territo P.R. Role of calcium in metabolic signaling between cardiac sarcoplasmic reticulum and mitochondria in vitro. Am. J. Physiol. Cell Physiol. 2003;284:C285–C293. doi: 10.1152/ajpcell.00129.2002. [DOI] [PubMed] [Google Scholar]
- 3.Territo P.R., Mootha V.K., Balaban R.S. Ca2+ activation of heart mitochondrial oxidative phosphorylation: role of the F0/F1-ATPase. Am. J. Physiol. Cell Physiol. 2000;278:C423–C435. doi: 10.1152/ajpcell.2000.278.2.C423. [DOI] [PubMed] [Google Scholar]
- 4.Csordás G., Thomas A.P., Hajnóczky G. Calcium signal transmission between ryanodine receptors and mitochondria in cardiac muscle. Trends Cardiovasc. Med. 2001;11:269–275. doi: 10.1016/s1050-1738(01)00123-2. [DOI] [PubMed] [Google Scholar]
- 5.O'Rourke B., Blatter L.A. Mitochondrial Ca2+ uptake: tortoise or hare? J. Mol. Cell. Cardiol. 2009;46:767–774. doi: 10.1016/j.yjmcc.2008.12.011. [DOI] [PMC free article] [PubMed] [Google Scholar]
- 6.Trollinger D.R., Cascio W.E., Lemasters J.J. Mitochondrial calcium transients in adult rabbit cardiac myocytes: inhibition by ruthenium red and artifacts caused by lysosomal loading of Ca2+-indicating fluorophores. Biophys. J. 2000;79:39–50. doi: 10.1016/S0006-3495(00)76272-2. [DOI] [PMC free article] [PubMed] [Google Scholar]
- 7.Mackenzie L., Roderick H.L., Bootman M.D. The spatial pattern of atrial cardiomyocyte calcium signalling modulates contraction. J. Cell Sci. 2004;117:6327–6337. doi: 10.1242/jcs.01559. [DOI] [PubMed] [Google Scholar]
- 8.Dedkova E.N., Blatter L.A. Mitochondrial Ca2+ and the heart. Cell Calcium. 2008;44:77–91. doi: 10.1016/j.ceca.2007.11.002. [DOI] [PubMed] [Google Scholar]
- 9.Miyata H., Silverman H.S., Hansford R.G. Measurement of mitochondrial free Ca2+ concentration in living single rat cardiac myocytes. Am. J. Physiol. 1991;261:H1123–H1134. doi: 10.1152/ajpheart.1991.261.4.H1123. [DOI] [PubMed] [Google Scholar]
- 10.Griffiths E.J., Stern M.D., Silverman H.S. Measurement of mitochondrial calcium in single living cardiomyocytes by selective removal of cytosolic indo 1. Am. J. Physiol. 1997;273:C37–C44. doi: 10.1152/ajpcell.1997.273.1.C37. [DOI] [PubMed] [Google Scholar]
- 11.Zhou Z., Matlib M.A., Bers D.M. Cytosolic and mitochondrial Ca2+ signals in patch clamped mammalian ventricular myocytes. J. Physiol. 1998;507:379–403. doi: 10.1111/j.1469-7793.1998.379bt.x. [DOI] [PMC free article] [PubMed] [Google Scholar]
- 12.Griffiths E.J. Species dependence of mitochondrial calcium transients during excitation-contraction coupling in isolated cardiomyocytes. Biochem. Biophys. Res. Commun. 1999;263:554–559. doi: 10.1006/bbrc.1999.1311. [DOI] [PubMed] [Google Scholar]
- 13.Maack C., Cortassa S., O'Rourke B. Elevated cytosolic Na+ decreases mitochondrial Ca2+ uptake during excitation-contraction coupling and impairs energetic adaptation in cardiac myocytes. Circ. Res. 2006;99:172–182. doi: 10.1161/01.RES.0000232546.92777.05. [DOI] [PMC free article] [PubMed] [Google Scholar]
- 14.Robert V., Gurlini P., Pozzan T. Beat-to-beat oscillations of mitochondrial [Ca2+] in cardiac cells. EMBO J. 2001;20:4998–5007. doi: 10.1093/emboj/20.17.4998. [DOI] [PMC free article] [PubMed] [Google Scholar]
- 15.Bell C.J., Bright N.A., Griffiths E.J. ATP regulation in adult rat cardiomyocytes: time-resolved decoding of rapid mitochondrial calcium spiking imaged with targeted photoproteins. J. Biol. Chem. 2006;281:28058–28067. doi: 10.1074/jbc.M604540200. [DOI] [PubMed] [Google Scholar]
- 16.Gunter T.E., Gunter K.K., Gavin C.E. Mitochondrial calcium transport: physiological and pathological relevance. Am. J. Physiol. 1994;267:C313–C339. doi: 10.1152/ajpcell.1994.267.2.C313. [DOI] [PubMed] [Google Scholar]
- 17.Sedova M., Dedkova E.N., Blatter L.A. Integration of rapid cytosolic Ca2+ signals by mitochondria in cat ventricular myocytes. Am. J. Physiol. Cell Physiol. 2006;291:C840–C850. doi: 10.1152/ajpcell.00619.2005. [DOI] [PubMed] [Google Scholar]
- 18.Sharma V.K., Ramesh V., Sheu S.S. Transport of Ca2+ from sarcoplasmic reticulum to mitochondria in rat ventricular myocytes. J. Bioenerg. Biomembr. 2000;32:97–104. doi: 10.1023/a:1005520714221. [DOI] [PubMed] [Google Scholar]
- 19.Belmonte S., Morad M. ‘Pressure-flow’-triggered intracellular Ca2+ transients in rat cardiac myocytes: possible mechanisms and role of mitochondria. J. Physiol. 2008;586:1379–1397. doi: 10.1113/jphysiol.2007.149294. [DOI] [PMC free article] [PubMed] [Google Scholar]
- 20.Aliev M.K., van Dorsten F.A., Saks V.A. Mathematical model of compartmentalized energy transfer: its use for analysis and interpretation of 31P-NMR studies of isolated heart of creatine kinase deficient mice. Mol. Cell. Biochem. 1998;184:209–229. [PubMed] [Google Scholar]
- 21.Cortassa S., Aon M.A., O'Rourke B. An integrated model of cardiac mitochondrial energy metabolism and calcium dynamics. Biophys. J. 2003;84:2734–2755. doi: 10.1016/S0006-3495(03)75079-6. [DOI] [PMC free article] [PubMed] [Google Scholar]
- 22.Shannon T.R., Wang F., Bers D.M. A mathematical treatment of integrated Ca dynamics within the ventricular myocyte. Biophys. J. 2004;87:3351–3371. doi: 10.1529/biophysj.104.047449. [DOI] [PMC free article] [PubMed] [Google Scholar]
- 23.Bazil J.N., Buzzard G.T., Rundell A.E. Modeling mitochondrial bioenergetics with integrated volume dynamics. PLOS Comput. Biol. 2010;6:e1000632. doi: 10.1371/journal.pcbi.1000632. [DOI] [PMC free article] [PubMed] [Google Scholar]
- 24.Okada J., Sugiura S., Hisada T. Three-dimensional simulation of calcium waves and contraction in cardiomyocytes using the finite element method. Am. J. Physiol. Cell Physiol. 2005;288:510–522. doi: 10.1152/ajpcell.00261.2004. [DOI] [PubMed] [Google Scholar]
- 25.Scriven D.R.L., Dan P., Moore E.D.W. Distribution of proteins implicated in excitation-contraction coupling in rat ventricular myocytes. Biophys. J. 2000;79:2682–2691. doi: 10.1016/S0006-3495(00)76506-4. [DOI] [PMC free article] [PubMed] [Google Scholar]
- 26.Aliev M.K., Dos Santos P., Saks V.A. Water content and its intracellular distribution in intact and saline perfused rat hearts revisited. Cardiovasc. Res. 2002;53:48–58. doi: 10.1016/s0008-6363(01)00474-6. [DOI] [PubMed] [Google Scholar]
- 27.Chen-Izu Y., McCulle S.L., Izu L.T. Three-dimensional distribution of ryanodine receptor clusters in cardiac myocytes. Biophys. J. 2006;91:1–13. doi: 10.1529/biophysj.105.077180. [DOI] [PMC free article] [PubMed] [Google Scholar]
- 28.Cortassa S., Aon M.A., Winslow R.L. A computational model integrating electrophysiology, contraction, and mitochondrial bioenergetics in the ventricular myocyte. Biophys. J. 2006;91:1564–1589. doi: 10.1529/biophysj.105.076174. [DOI] [PMC free article] [PubMed] [Google Scholar]
- 29.Forbes M.S., van Neil E.E. Membrane systems of guinea pig myocardium: ultrastructure and morphometric studies. Anat. Rec. 1988;222:362–379. doi: 10.1002/ar.1092220409. [DOI] [PubMed] [Google Scholar]
- 30.Pásek M., Simurda J., Christé G. A model of the guinea-pig ventricular cardiac myocyte incorporating a transverse-axial tubular system. Prog. Biophys. Mol. Biol. 2008;96:258–280. doi: 10.1016/j.pbiomolbio.2007.07.022. [DOI] [PubMed] [Google Scholar]
- 31.Dash R.K., Beard D.A. Analysis of cardiac mitochondrial Na+-Ca2+ exchanger kinetics with a biophysical model of mitochondrial Ca2+ handling suggests a 3:1 stoichiometry. J. Physiol. 2008;586:3267–3285. doi: 10.1113/jphysiol.2008.151977. [DOI] [PMC free article] [PubMed] [Google Scholar]
- 32.Wegmann G., Zanolla E., Wallimann T. In situ compartmentation of creatine kinase in intact sarcomeric muscle: the acto-myosin overlap zone as a molecular sieve. J. Muscle Res. Cell Motil. 1992;13:420–435. doi: 10.1007/BF01738037. [DOI] [PubMed] [Google Scholar]
- 33.Negroni J.A., Lascano E.C. A cardiac muscle model relating sarcomere dynamics to calcium kinetics. J. Mol. Cell. Cardiol. 1996;28:915–929. doi: 10.1006/jmcc.1996.0086. [DOI] [PubMed] [Google Scholar]
- 34.Matsuoka S., Sarai N., Noma A. Simulation of ATP metabolism in cardiac excitation-contraction coupling. Prog. Biophys. Mol. Biol. 2004;85:279–299. doi: 10.1016/j.pbiomolbio.2004.01.006. [DOI] [PubMed] [Google Scholar]
- 35.Brette F., Rodriguez P., Orchard C.H. β-adrenergic stimulation restores the Ca transient of ventricular myocytes lacking t-tubules. J. Mol. Cell. Cardiol. 2004;36:265–275. doi: 10.1016/j.yjmcc.2003.11.002. [DOI] [PubMed] [Google Scholar]
- 36.Brette F., Despa S., Orchard C.H. Spatiotemporal characteristics of SR Ca2+ uptake and release in detubulated rat ventricular myocytes. J. Mol. Cell. Cardiol. 2005;39:804–812. doi: 10.1016/j.yjmcc.2005.08.005. [DOI] [PubMed] [Google Scholar]
- 37.Weber C.R., Piacentino V., 3rd, Bers D.M. Na+-Ca2+ exchange current and submembrane [Ca2+] during the cardiac action potential. Circ. Res. 2002;90:182–189. doi: 10.1161/hh0202.103940. [DOI] [PubMed] [Google Scholar]
- 38.Brandes R., Bers D.M. Simultaneous measurements of mitochondrial NADH and Ca2+ during increased work in intact rat heart trabeculae. Biophys. J. 2002;83:587–604. doi: 10.1016/S0006-3495(02)75194-1. [DOI] [PMC free article] [PubMed] [Google Scholar]
- 39.Selivanov V.A., Krause S., Cascante M. Modeling of spatial metabolite distributions in the cardiac sarcomere. Biophys. J. 2007;92:3492–3500. doi: 10.1529/biophysj.106.101352. [DOI] [PMC free article] [PubMed] [Google Scholar]
- 40.Langer G.A., Peskoff A. Calcium concentration and movement in the diadic cleft space of the cardiac ventricular cell. Biophys. J. 1996;70:1169–1182. doi: 10.1016/S0006-3495(96)79677-7. [DOI] [PMC free article] [PubMed] [Google Scholar]
- 41.Soeller C., Cannell M.B. Numerical simulation of local calcium movements during L-type calcium channel gating in the cardiac diad. Biophys. J. 1997;73:97–111. doi: 10.1016/S0006-3495(97)78051-2. [DOI] [PMC free article] [PubMed] [Google Scholar]
- 42.White E., Boyett M.R., Orchard C.H. The effects of mechanical loading and changes of length on single guinea-pig ventricular myocytes. J. Physiol. 1995;482:93–107. doi: 10.1113/jphysiol.1995.sp020502. [DOI] [PMC free article] [PubMed] [Google Scholar]
- 43.Yasuda S., Sugiura S., Sugi H. Unloaded shortening increases peak of Ca2+ transients but accelerates their decay in rat single cardiac myocytes. Am. J. Physiol. Heart Circ. Physiol. 2003;285:H470–H475. doi: 10.1152/ajpheart.00012.2003. [DOI] [PubMed] [Google Scholar]
- 44.Illing B., Horn M., Neubauer S. Changes of myocardial high-energy phosphates with the cardiac cycle during acute or chronic myocardial stress. Magn. Reson. Med. 1998;40:727–732. doi: 10.1002/mrm.1910400513. [DOI] [PubMed] [Google Scholar]
- 45.Honda H., Tanaka K., Haneda T. Cyclical changes in high-energy phosphates during the cardiac cycle by pacing-Gated 31P nuclear magnetic resonance. Circ. J. 2002;66:80–86. doi: 10.1253/circj.66.80. [DOI] [PubMed] [Google Scholar]
- 46.Balaban R.S., Heineman F.W. Control of mitochondrial respiration in the heart in vivo. Mol. Cell. Biochem. 1989;89:191–197. doi: 10.1007/BF00220775. [DOI] [PubMed] [Google Scholar]
- 47.Kantor H.L., Briggs R.W., Balaban R.S. Gated in vivo examination of cardiac metabolites with 31P nuclear magnetic resonance. Am. J. Physiol. 1986;251:H171–H175. doi: 10.1152/ajpheart.1986.251.1.H171. [DOI] [PubMed] [Google Scholar]
- 48.Michailova A., McCulloch A. Model study of ATP and ADP buffering, transport of Ca2+ and Mg2+, and regulation of ion pumps in ventricular myocyte. Biophys. J. 2001;81:614–629. doi: 10.1016/S0006-3495(01)75727-X. [DOI] [PMC free article] [PubMed] [Google Scholar]
- 49.Hüser J., Blatter L.A., Sheu S.-S. Mitochondrial calcium in heart cells: beat-to-beat oscillations or slow integration of cytosolic transients? J. Bioenerg. Biomembr. 2000;32:27–33. doi: 10.1023/a:1005556227425. [DOI] [PubMed] [Google Scholar]
- 50.Paucek P., Jaburek M. Kinetics and ion specificity of Na+/Ca2+ exchange mediated by the reconstituted beef heart mitochondrial Na+/Ca2+ antiporter. Biochim. Biophys. Acta. 2004;1659:83–91. doi: 10.1016/j.bbabio.2004.03.019. [DOI] [PubMed] [Google Scholar]
- 51.Sata M., Sugiura S., Serizawa T. Coupling between myosin ATPase cycle and creatinine kinase cycle facilitates cardiac actomyosin sliding in vitro. A clue to mechanical dysfunction during myocardial ischemia. Circulation. 1996;93:310–317. doi: 10.1161/01.cir.93.2.310. [DOI] [PubMed] [Google Scholar]
- 52.Kaasik A., Veksler V., Ventura-Clapier R. Energetic crosstalk between organelles: architectural integration of energy production and utilization. Circ. Res. 2001;89:153–159. doi: 10.1161/hh1401.093440. [DOI] [PubMed] [Google Scholar]
- 53.Partikian A., Ölveczky B., Verkman A.S. Rapid diffusion of green fluorescent protein in the mitochondrial matrix. J. Cell Biol. 1998;140:821–829. doi: 10.1083/jcb.140.4.821. [DOI] [PMC free article] [PubMed] [Google Scholar]
- 54.Scalettar B.A., Abney J.R., Hackenbrock C.R. Dynamics, structure, and function are coupled in the mitochondrial matrix. Proc. Natl. Acad. Sci. USA. 1991;88:8057–8061. doi: 10.1073/pnas.88.18.8057. [DOI] [PMC free article] [PubMed] [Google Scholar]
- 55.Olveczky B.P., Verkman A.S. Monte Carlo analysis of obstructed diffusion in three dimensions: application to molecular diffusion in organelles. Biophys. J. 1998;74:2722–2730. doi: 10.1016/S0006-3495(98)77978-0. [DOI] [PMC free article] [PubMed] [Google Scholar]
- 56.Cheng Y., Yu Z., Michailova A.P. Numerical analysis of Ca2+ signaling in rat ventricular myocytes with realistic transverse-axial tubular geometry and inhibited sarcoplasmic reticulum. PLOS Comput. Biol. 2010;6:e1000972. doi: 10.1371/journal.pcbi.1000972. [DOI] [PMC free article] [PubMed] [Google Scholar]
- 57.Cheng H., Lederer W.J., Cannell M.B. Calcium sparks: elementary events underlying excitation-contraction coupling in heart muscle. Science. 1993;262:740–744. doi: 10.1126/science.8235594. [DOI] [PubMed] [Google Scholar]
Associated Data
This section collects any data citations, data availability statements, or supplementary materials included in this article.