

Abstract
Even though superresolution microscopy indicates that size of plasma membrane rafts is <20 nm, those structures have never been observed. Förster resonance energy transfer (FRET) is therefore still the most powerful optical method for characterization of such domains. In this letter we investigate relation between nanodomain affinity of a donor-acceptor (D/A) pair and the detectable nanodomain size/area. We show that probes with high affinity to the liquid-ordered (Lo) phase are required for detecting domain sizes of a few nanometers, and/or domains that occupy a few percent of the bilayer area. A combination of donors and acceptors that prefer different phases is the more favorable approach. For instance, a D/A pair with the distribution constant of donors KD = 5 and acceptors KA = 0.01 can resolve a broad spectrum of nanodomain sizes. On the other hand, currently available donors and acceptors that prefer the same phase, either the liquid-disordered (Ld) or Lo phase, are not so convenient for determining domain sizes <20 nm. Here the detection limits of FRET experiments employing several commonly used D/A pairs have been investigated.
Introduction
Despite the advances in far-field optical microscopy, subwavelength lipid domains have never been directly visualized, but their size was predicted to be <20 nm (1). Förster resonance energy transfer (FRET) is therefore often employed in characterization of these domains (2,3), also due to the fact that FRET can report on nanodomains even if they are formed transiently. The size determination of these nanodomains by FRET requires knowledge about partitioning of donors (D) and acceptors (A) between nanodomains and the remaining liquid-disordered (Ld) bilayer. Unfortunately, there is a lack of probes exhibiting substantial affinity to the liquid-ordered (Lo) phase, which would be ideal for studies on the nanometer scale. Hitherto, labeled cholera toxin shows the highest affinity (4). Yet, cholera toxin is a less favorable reporter, because it triggers the phase separation (2). The presence of other Lo preferring probes, such as perylene or NBD-DPPC, is assumed to have less impact on the phase composition, although K is considerably lower. Assuming realistic distribution coefficients, this work explores the theoretical limits for the FRET nanodomain size determination. Apart from that, the validity of FRET experiments using common D/A pairs (2,3,5) is discussed.
Monte Carlo Setup
For the Monte Carlo setup ((6) and see the Supporting Material), the distribution of donors and acceptors between the domains and the remaining bilayer is described by the distribution constant Ki (= [i]Lo/[i]Ld, i = A or D). The donors were uniformly distributed in the interior of the lipid bilayer, whereas the acceptors resided at the lipid-water interface. As shown in the Supporting Material, the z position of the donors has a minor influence on the generated curves. The D/A to lipid ratio was 1:200. The outcome of the simulation is a fluorescence decay of donors quenched by acceptors in bilayers containing circular nanodomains. This decay was compared with the decay that corresponds to a uniform distribution of donors and acceptors in the bilayer, i.e., to the case when the bilayer did not contain any domains but had composition similar to that when domains were present. The FRET experiments can also be carried out in the steady-state mode, whereby one compares the steady-state intensities obtained for nonuniform (F) and uniform (Funi) distributions of D/A. This intensity is obtained from the simulations by integrating the decay.
Theoretical Limits of Fret for Nanodomain Detection
Intrinsically, the resolution of FRET experiments in the determination of domain size depends on the affinity of D/A pairs to the Lo and Ld phases. Three distinct cases have been considered: I), D/A pairs reside inside Lo nanodomains. II), D/A pairs are excluded from said nanodomains. III), donors and acceptors exhibit an increased affinity to the different phases. Cases I and II provide faster decays as compared to uniform D/A distributions, whereas the FRET efficiency is decreased in Case III. According to our experience, any changes in the steady-state intensity ratio F/Funi < 1.15 can hardly be interpreted as a reproducible change. Colors used in Figs. 1–3 have the following meaning (compare to Fig. 1): red, domains are clearly beyond the resolution of time-resolved (TR) FRET, i.e., decays for the uniform (UD) and nonuniform (ND) distribution of probes coincide with each other and F/Funi < 1.05; orange, domains are close to the detection limit for TR FRET, i.e., decays for the UD and ND are poorly separated (by eye) and 1.05 < F/Funi < 1.1; yellow, domains are detectable by FRET and are close to the detection limit by the steady-state intensity of donors, i.e., decays for the UD and ND are well separated and 1.1 < F/Funi < 1.2; green, domains are resolved by both approaches, i.e., F/Funi > 1.2.
Figure 1.
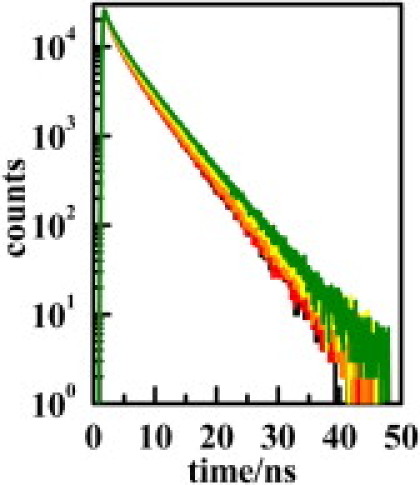
Decays generated for the uniform distribution of D/A (black), and those corresponding to the red, orange, yellow, and green regions. R = 10 nm, area varied between 4 and 34%.
Figure 2.
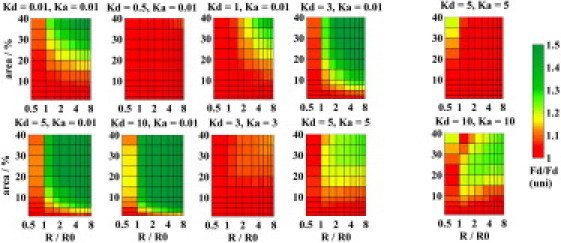
Resolution of FRET represented by the ratio of the intensity of donors (FD) to the intensity of donors when D/A pairs are distributed uniformly in the bilayer (FD(uni)) as a function of the domain area and the relative domain radius. The donor lifetime was 6 ns in the Lo and Ld phase (left) or it was 6 ns in the Ld and 8 ns Lo phase (right). For [KD = 0.01, KA = 0.01], [KD = 3, KA = 3], [KD = 5, KA = 5], and [KD = 10, KA = 10], the ratio FD(uni)/FD is displayed instead. Values >1.5 are displayed with the same color as the limiting value.
Figure 3.
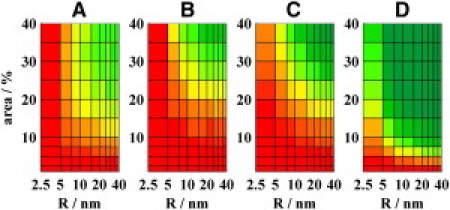
Resolution of FRET represented by the ratio FD/FD(uni) as a function of the domain area and the radius for (A) NBD-PE/Rhodamine-PE, (B) BODIPY-PC/fast-DiI, (C) Perylene/DiI with KD = 1 and KA = 0.01, and (D) Perylene/DiI with KD = 3 and KA = 0.01. See Fig. 2 for more details.
Case I considers probes that show an increased affinity to the Lo phase. The favorable green region is reached if both KD and KA > 10 (compare to Fig. 2 and see the Supporting Material). Unfortunately, such probes are not yet available. For more realistic values of KD and KA = 3 (compare to Fig. 2), domains with an area exceeding 20% and radii > 1.6 R0 (R0 denotes the Förster radius) might be resolved by TR FRET (green region), whereas for KD = 5 and KA = 5 (i.e., comparable to labeled cholera toxin), domains with an area >15% and radii >1 R0 can be detected by TR FRET (yellow-green region). The fluorescence lifetime of probes might depend on the lipid phase composition. Suppose that the donor lifetime is longer in the Lo phase (8 ns) and shorter in the Ld phase (6 ns), which has been obtained for perylene (compare to the Supporting Material). Then the decay rate of donors becomes longer due to longer lifetime of donors emitting from the domains, and simultaneously shorter due to increased FRET in the same phase. This contraproductive behavior implies that KD = 5 and KA = 5 would not still be high enough to visualize the domains (compare to Fig. 2, right). Even for KD = KA = 10, domains with an area <10% and radii <1 R0 still belong in the red-orange region. Thus, even when using the data from Hammond et al. (2) and Chiantia et al. (4) with the favorable combination of perylene as donor and labeled cholera toxin as acceptor, Case I is not a realistic approach for determining domain sizes <20 nm.
Case II appears to be most common, as is evident from the K values of membrane labels used. The design of experiments in which donors and acceptors prefer the Ld phase, i.e., outside the domains, is less useful for radii ≈ R0. This fact is illustrated in Fig. 2. Even for D/A pairs with high affinity to Ld phase (KD = KA = 0.01), domains must occupy >20% to resolve radii >1.5 R0. The FRET approach fails completely if donors are inefficiently excluded from the domains. Though such probes are available, they are not useful.
Case III means that donors preferentially reside in domains and acceptors are excluded from them, respectively. Here KA = 0.01 was used, because probes with such high affinity to Ld phase are available. The value of KD = 5 is high enough for observing domains over a broad range of sizes. However, domains that occupy <2.5% of the overall area and domains with radii <1 R0 and occupying ≤10% of the area are beyond the experimental resolution. To be able to monitor the initial states of domain formation (R < R0 and area of a few %), the values of KD ≥ 40 are needed to reach the orange region even for a radius of 0.5 R0 and area of 1% (compare to the Supporting Material). The resolution rapidly decreases for KD < 5. At KD = 3, domain fractions between 7.5 and 40% and radii ranging between 1.5 and 8 R0 still belong in the yellow-green region. At KD = 1, domains that cover 20–40% with radii from 2 to 8 R0 are clearly resolvable. The role of donors and acceptors may be exchanged, but that does not have an impact on the conclusions. Although membrane labels with a preferred affinity to the Lo phases are practically limited to labeled cholera toxins, this circumstance can be utilized to determine domains down to 5 nm by TR FRET. Thus, the design of new domain markers improves simple steady-state experiments.
Validity of Fret Experiments Using Various D/A Pairs
NBD-PE/Rhodamine-PE FRET (R0 ≈ 5 nm)
For NBD-PE/Rhodamine-PE FRET (R0 ≈ 5 nm) (5), NBD-PE has, in POPC/Sph/Chol bilayer, a modest affinity to the Lo domains with KD = 4.3, whereas Rhodamine-PE with KA = 0.37 tends to stay in the Ld phase. Nanodomains with R > 10 nm and area >15% can be characterized (compare to Fig. 3 A). On the other hand, nanodomains with R < 5 nm or area <5% are beyond the resolution.
BODIPY-PC/fast-DiI FRET (R0 = 6.5 nm)
This pair with KD and KA at ∼0.1 was used to characterize domains in the DOPC/DSPC/Chol system by steady-state measurements (3). The authors speculated that the domains had sizes in the range of 2–8 nm. According to our study, the domains that have radii >5 nm and occupy >25% of the entire surface can be detected. Another possibility would be domains constituting a lower amount of the bilayer (down to 15%) and having R > 10 nm (compare to Fig. 3 B).
Alexa Fluor 647 cholera toxin/DiD FRET (R0 = 5.4 nm)
Concerning the K values for this pair, KD = 11 ± 5 (4) or 6 ± 3 as determined by us (compare to the Supporting Material) and KA = 0.004, it is the best pair available so far, which could determine radii down to 5 nm and areas of only few % (compare to Fig. 2, KD = 3–10, KA = 0.01; concerning the limits, there is no difference between KA = 0.01 or KA = 0.004). Disadvantage of cholera toxins is that they affect the phase composition. (Note that Alexa Fluor 647 cholera toxin is a product of Molecular Probes, Eugene, OR.)
Perylene/fast-DiI FRET (R0 = 5.1 nm)
Perylene/fast-Dil FRET (R0 = 5.1 nm) (2) seems to be a useful D/A pair, with acceptors participating in the Ld phase. However, there is a complicated picture concerning 1), photophysics of perylene and 2), the correct value of KD: a), The lifetime of perylene changes with the lipid phase (i.e., 6 ns and 8 ns in Ld and Lo phase, respectively; compare to the Supporting Material). This property improves the resolution for the case III moderately (compare to Fig. 3, C and D). The improved detection is ascribed to an additive mechanism (i.e., slower FRET, with respect to the UD of D/A pairs plus emission of donors from the domains on a longer timescale). However, due to 1/6 power dependence of FRET efficiency on the lifetime, the FRET rate remains nearly constant as compared to the case when the donor-lifetime does not depend on the phase (compare to the Supporting Material). b), Limitations are apparent for KD ≤ 5 and gradually grow with KD → 1. In this study, a value KD = 0.8 is obtained for perylene in the DOPC/DOPG/Chol/Sph bilayer. Hammond et al. (2) claim that perylene exhibits a pronounced affinity to the Lo phase. Based on the simulations and even by using an ∼4× higher KD value as determined by us (KD = 3, compare to Fig. 3) and a low value of KA for fast-DiI (KA = 0.01), the formation of nanodomains <20 nm cannot be excluded due to the absence of changes in perylene steady-state intensities for the DOPC/DOPG/Sph/Chol/GM1 system (2). Determining the resolution limits of perylene/DiI FRET experiments is difficult because of the above-mentioned uncertainties. A reasonable guess is that KD = 1, i.e., domains <20 nm are only visible for areas ≥20%.
Conclusions
TR FRET, and currently available probes, enable resolution of nanodomains <20 nm. The best approach appears to be D/A preferring a different phase when a D/A pair with KD = 5 and KA = 0.01 already resolves a broad range of domain sizes. However, only probes with high affinity to the Lo phase will enable detection of very small domains or domains occupying only a few percent of the bilayer area. A situation when D/A prefer the same phase, either the Ld or Lo phase, is not yet a realistic approach for determining domain sizes <20 nm.
acknowledgments
This work was financially supported by the Grant Agency of the Czech Republic via P208/10/1090 (J.H. and R.S.) and P208/10/0376 (M.H.), by the Grant Agency of Charles University via 3130/2011 (M.S.), and the Swedish Research Council (L.B.-Å.J.).
Supporting Material
References and Footnotes
- 1.Eggeling C., Ringemann C., Hell S.W. Direct observation of the nanoscale dynamics of membrane lipids in a living cell. Nature. 2009;457:1159–1162. doi: 10.1038/nature07596. [DOI] [PubMed] [Google Scholar]
- 2.Hammond A.T., Heberle F.A., Feigenson G.W. Crosslinking a lipid raft component triggers liquid ordered-liquid disordered phase separation in model plasma membranes. Proc. Natl. Acad. Sci. USA. 2005;102:6320–6325. doi: 10.1073/pnas.0405654102. [DOI] [PMC free article] [PubMed] [Google Scholar]
- 3.Heberle F.A., Wu J., Feigenson G.W. Comparison of three ternary lipid bilayer mixtures: FRET and ESR reveal nanodomains. Biophys. J. 2010;99:3309–3318. doi: 10.1016/j.bpj.2010.09.064. [DOI] [PMC free article] [PubMed] [Google Scholar]
- 4.Chiantia S., Ries J., Schwille P. Combined AFM and two-focus SFCS study of raft-exhibiting model membranes. ChemPhysChem. 2006;7:2409–2418. doi: 10.1002/cphc.200600464. [DOI] [PubMed] [Google Scholar]
- 5.de Almeida R.F.M., Loura L.M.S., Prieto M. Lipid rafts have different sizes depending on membrane composition: a time-resolved fluorescence resonance energy transfer study. J. Mol. Biol. 2005;346:1109–1120. doi: 10.1016/j.jmb.2004.12.026. [DOI] [PubMed] [Google Scholar]
- 6.Johansson L.B.A., Engstrom S., Lindberg M. Electronic energy transfer in anisotropic systems. 3. Monte Carlo simulations of energy migration in membranes. J. Chem. Phys. 1992;96:3844–3856. [Google Scholar]
Associated Data
This section collects any data citations, data availability statements, or supplementary materials included in this article.