

Abstract
The extracellular signal-regulated kinase (ERK) controls cellular processes by phosphorylating multiple substrates. The ERK protein can use the same domains to interact with phosphatases, which dephosphorylate and deactivate ERK, and with substrates, which connect ERK to its downstream effects. As a consequence, substrates can compete with phosphatases and control the level of ERK phosphorylation. We propose that this effect can qualitatively change the dynamics of a network that controls ERK activation. On its own, this network can be bistable, but in a larger system, where ERK accelerates the degradation of a substrate competing with a phosphatase, this network can oscillate. Previous studies proposed that oscillatory ERK signaling requires a negative feedback in which active ERK reduces the rate at which it is phosphorylated by upstream kinase. We argue that oscillations can also emerge even when this rate is constant, due to substrate-dependent control of ERK phosphorylation.
Introduction
The extracellular signal-regulated kinase (ERK)/ mitogen activated protein kinase (MAPK) pathway is organized around a cascade of three kinases: Raf, the topmost kinase in the cascade, phosphorylates and activates MAPK/extracellular signal-regulated kinase (MEK), which goes on to phosphorylate and activate ERK (1). In contrast to MEK, which phosphorylates only ERK, ERK has multiple substrates, which enables it to regulate multiple cellular processes, such as expression of genes and remodeling of cytoskeleton (2). ERK signaling has been associated with countless developmental events across species (3–7). In adulthood, ERK regulates tissue homeostasis and repair (8,9), and has also been implicated in longevity, memory, and metabolism (10–12).
Depending on cellular context, the ERK pathway can function as a rheostat, a switch, or an oscillator (13–19). Here, we focus on the mechanisms underlying oscillations of ERK activity, which have been observed in two different experimental systems (20). The emergence of oscillatory ERK activity is most commonly associated with negative feedback control (21). For instance, ERK is known to phosphorylate Sos, a protein essential for Raf activation, reducing the rate of ERK pathway activation. In combination with time delay, which accounts for multiple steps of signal transduction from Raf to ERK, such negative feedback can lead to oscillations. In another system, such delayed negative feedback can be realized by transcriptional induction of negative feedback regulators, such as Sprouty (22). In both of these cases, oscillations emerge as a consequence of ERK-dependent inhibition of positive input to the core pathway.
Here, we propose that ERK oscillations can also arise through a different mechanism that relies on substrate-dependent control of ERK phosphorylation. In this mechanism, ERK substrates compete with ERK phosphatases, due to the fact that substrates and phosphatase can bind to the same docking site on the ERK molecule (23). Recently, substrate-dependent control of ERK phosphorylation has been documented both in vitro and in vivo (24,25). Based on the presented computational analysis, we suggest that this effect can lead to oscillations.
Our reasoning was based on a model network where ERK is regulated by opposing activities of ERK kinase and phosphatase and where, in addition, active ERK phosphorylates a substrate, thereby inducing its degradation (Fig. 1 A)—a scenario that has been identified in several experimental systems (26,27). In this mechanism, substrate is synthesized at a constant rate and degraded via two pathways: constitutive (slow) and ERK-dependent (fast). In such a network, high levels of ERK activity, realized at high levels of ERK phosphorylation, would degrade most of the substrate, making active ERK more available to phosphatases. This would bring about reduction of the total level of active, double-phosphorylated ERK, reducing the ERK-dependent substrate degradation and therefore enabling the substrate levels to build up. As a consequence of substrate-dependent control of ERK phosphorylation, the increased substrate will compete with phosphatases and reduce the dephosphorylation rate of the double-phosphorylated ERK. This would, in turn, reduce the level of substrate expression, and so on, repeating the cycle of oscillations.
Figure 1.

(A) Model biochemical network: an enzyme (M) is regulated by kinase (E1) and phosphatase (E2). Enzymatic activity requires dual phosphorylation. The mechanisms of enzyme phosphorylation and dephosphorylation are distributive. Active enzyme (M2) phosphorylates a substrate (S), thereby increasing the rate of its degradation. The substrate is synthesized at a constant rate and, in the absence of enzyme activity, is degraded via a constitutive degradation pathway. The full model consists of two subsystems: the enzyme regulation module (inside the green dashed box) and the substrate degradation module (inside the red dashed box). (B) One-parameter bifurcation diagram for the isolated dual phosphorylation module. (Black solid curves) Stable steady-state branches. (Red dashed curve) Unstable steady-state branch. As the input level is changed this module can be bistable. (C) One-parameter bifurcation diagram for the isolated substrate module (the part of the network in the red box). The nondimensional concentration of the double-phosphorylated enzyme (m2) is used as the active parameter. This module is always monostable. Parameter values for panels B and C are shown in Table 1, with p1–p13 being used for the dual phosphorylation module and p14–p18 being used for the substrate module.
We use a mathematical model to demonstrate that this mechanism can generate robust periodic oscillations of ERK phosphorylation. Our model neglects several important aspects of ERK regulation in cells, including compartmentalization and feedback control (28). At the same time, this model emphasizes the functional significance of competing docking interactions, which have been largely ignored in mathematical models of cell signaling. In the context of ERK signaling, computational studies and chemical reaction network theory approaches revealed that competing docking interactions can lead to bistability (29–32). In the case of bistability, different phosphostates of ERK compete for the enzymes regulating ERK. We demonstrate that competing docking interactions can also lead to oscillations. In this case, competition is among the binding partners of ERK. In our model, the emergence of oscillations depends on bistability, similar to the canonical van der Pol oscillator (33). Thus, competing docking interactions provide a rich source of dynamic regimes in biochemical networks.
Materials and Methods
Mathematical model
The model is based on the following network of reactions (Fig. 1 A):
M0, M1, and M2 denote the unphosphorylated, monophosphorylated, and double-phosphorylated forms of the enzyme (ERK); E1 and E2 denote the kinase and phosphatase, which regulate this enzyme. C1–4 denote the complexes comprising this enzyme and its binding partners. S is the substrate, synthesized at a constant rate and degraded by two pathways, one constitutive, and one dependent on M2. C5 denotes the complex of M2 and S.
We assume that phosphorylated substrate, S∗, does not interact with the enzyme and the rest of the species in the mechanism. As shown in Fig. 1 A, reactions R1–R4 comprise the enzyme regulation module. Reactions R5–R7 constitute the substrate degradation module.
Based on mass action kinetics, we obtain the following system of equations:
The total amounts of the enzyme (M), kinase (E1), and phosphatase (E2) are conserved:
Nondimensionalization
The system is rendered dimensionless by the following set of transformations:
Thus, time is rescaled by the timescale of binding to the phosphatase. Variables related to the free enzyme, either phosphorylated or unphosphorylated, are rescaled by the total amount of the enzyme. Complexes in the phosphorylation/dephosphorylation reactions are rescaled by total concentrations of kinase and phosphatase. Free substrate is rescaled by the steady concentration in the absence of the enzyme. Finally, the enzyme-substrate complex is rescaled by the total amount of the enzyme. Using the conservation equations, we obtain the following system (all parameters are defined in Table 1):
| (1) |
The system in Eq. 1 corresponds to the full model, as we will refer to it in our subsequent discussions. For this model, we performed extensive parametric analysis and identified an oscillatory regime.
Table 1.
Definition of the dimensionless parameters and a representative parameter set for oscillations
| Dimensionless parameter | Definition | Sample value for oscillatory solution | Dimensionless parameter | Definition | Sample value for oscillatory solution |
|---|---|---|---|---|---|
| p1 | 1.4 | p10 | 4.0e-3 | ||
| p2 | 5.0e-2 | p11 | 1.0e-1 | ||
| p3 | 4.0e-3 | p12 | 8.0e-3 | ||
| p4 | 3.2e-4 | p13 | 4.0e-2 | ||
| p5 | 4.0e-2 | p14 | 1.5e1 | ||
| p6 | 3.2e-1 | p15 | 5.6e-5 | ||
| p7 | 1.6e-4 | p16 | 1.571e2 | ||
| p8 | 8.0 | p17 | 1.571e1 | ||
| p9 | 6.4e-1 | p18 | 1.429 |
Quasi-steady-state approximation and the reduced model
In the parameter regime where oscillatory behavior was discovered, it is useful to consider a related simplified model, which we will refer to as the reduced model. Specifically, when p2→0 (that is, when the total amount of phosphatase compared to the total amount of enzyme is very small), the quasi-steady-state assumption can be applied to the fast variables (C1–4) in the full system, and the full system then reduces to the following reduced model:
| (2) |
The auxiliary model
The oscillations present in the full model are well approximated by the oscillations in the reduced model above. To rationalize the origin of the identified oscillatory behavior, and to visualize it in three dimensions, we constructed a three-variable auxiliary model. In this model, one of the variables in Eqs. 1 and 2—the substrate level s—is treated as a parameter. Later on, the one-parameter bifurcation diagram of this auxiliary model with respect to the parameter s will be used as a skeleton that helps us to understand the emergence of oscillations:
| (3) |
Numerical methods
Parametric analysis of steady states and limit cycles in the full and reduced models was done using continuation algorithms, implemented in AUTO (34–36) and MATCONT (37–39).
Results and Discussion
Overview of reaction network
The starting point for our analysis was provided by a mathematical model of a multisite phosphorylation cycle that controls ERK activity (31,32). In this model, ERK activation by MEK follows a distributive mechanism, where MEK dissociates from monophosphorylated ERK after the first phosphorylation. ERK activation requires a second phosphorylation, which depends on an independent binding to MEK. The distributive nature of the mechanism of ERK phosphorylation by MEK is supported by kinetic experiments with purified components (40,41). In another set of biochemical studies, it was demonstrated that ERK deactivation by phosphatases, such as MKP3, also follows a distributive mechanism (42).
Mathematical analyses of a network comprising distributive phosphorylation and dephosphorylation mechanisms revealed that they can exhibit bistability, an effect where, for the same set of operating conditions, the network can be found in two different, stable steady states (31,43,44), (Fig. 1 B). Which of the two steady states is realized depends on the starting composition of the mixture of ERK and its regulators.
In our study, the enzyme regulation system (the part of the network encircled by the green box in Fig. 1 A) provides an input to a second module, the substrate module (the part of the network inside the red box in Fig. 1 A) that describes substrate synthesis and degradation. Several substrates are known to be degraded in response to their phosphorylation by ERK. Note that this type of effect of ERK on its substrate is certainly not the only one possible. In fact, the lifetime of several substrates, such as Fos, is increased when they are phosphorylated by ERK (45,46).
Some of the most extensively characterized examples of ERK-dependent substrate degradation were provided by genetic and biochemical studies of gene regulation during Drosophila embryogenesis, where gene activation by ERK signaling depends on phosphorylation and degradation of transcriptional repressors (27,47). Recent experiments in the early Drosophila embryo revealed that several of these ERK substrates positively regulate ERK phosphorylation (25,48,49). These motivate our analysis of a two-module network shown in Fig. 1 A.
The isolated substrate module (treating the level of the double-phosphorylated enzyme as a parameter) is monostable (Fig. 1 C). Below, we demonstrate that oscillations can occur when this substrate-dependent control of ERK phosphorylation is linked to the bistability of the enzyme regulation module: the network comprising distributive phosphorylation and dephosphorylation mechanisms.
Identification of an oscillatory regime
Our identification of an oscillatory regime was guided by the van der Pol oscillator, which is based on a combination of a fast bistable system and a slow variable that switches the system between branches of two alternative stable steady states. This design has been identified in multiple biological oscillators, including cell cycle and calcium signaling networks (50,51). In our model, the role of the slow variable can be played by an ERK substrate. At high concentration (low level of its conversion by ERK), this substrate could stabilize the state with a high level of ERK phosphorylation. High ERK activity associated with this state increases substrate conversion, eventually leading to a switch to a state with low ERK phosphorylation.
To test whether this type of oscillation is indeed possible, we analyzed long-term dynamics in a model where an enzyme, which is controlled by two opposing distributive mechanisms, increases the degradation rate of a substrate, which is synthesized at a constant rate. A mass action kinetics description of this mechanism leads to a system of eight differential equations that describe the joint dynamics of chemical species in the model. After nondimensionalization, the model contains 18 dimensionless groups, each of which reflects ratios of characteristic concentrations and timescales in the underlying chemical mechanism (see Materials and Methods and Table 1).
To determine whether this model can support oscillations, we need to determine whether there exist values of the model parameters for which the long-term dynamics of the model has stable periodic solutions. Identification of parameter sets that support limit cycles is greatly simplified by the conceptual analogy with the van der Pol oscillator, where a subset of the full model exhibits bistability. In our case, this subset of the full model corresponds to the enzyme regulation module (Fig. 1 A). Upon disconnecting this module from the downstream substrate degradation module, this subsystem has a smaller number of parameters (p1–p13 in Table 1), which depend only on the concentrations of ERK and its regulators, and on the rates of binding and catalytic reactions within the ERK phosphorylation cycle (see Materials and Methods).
Based on the results of the previous studies, we could readily select parameter sets that support bistability in this module. These parameters are characterized by saturation of kinase/phosphatase regulating the enzyme and by asymmetry of the rate constants of catalytic reactions comprising the dual phosphorylation/dephosphorylation cycle (31,32).
At the next step, we explored the space of the remaining five components of the parameter vector (p14–p18), to identify values that support oscillations. Using a combination of numerical solution of the model and its steady-state bifurcation analysis, we identified a domain that supports large amplitude limit cycles. These periodic solutions indeed correspond to the antiphase oscillations of the double-phosphorylated enzyme and substrate levels (Fig. 2). The period of the identified periodic solution is determined by the timescale of constitutive substrate degradation, underscoring the fact that oscillations emerge due to substrate dynamics.
figure 2.
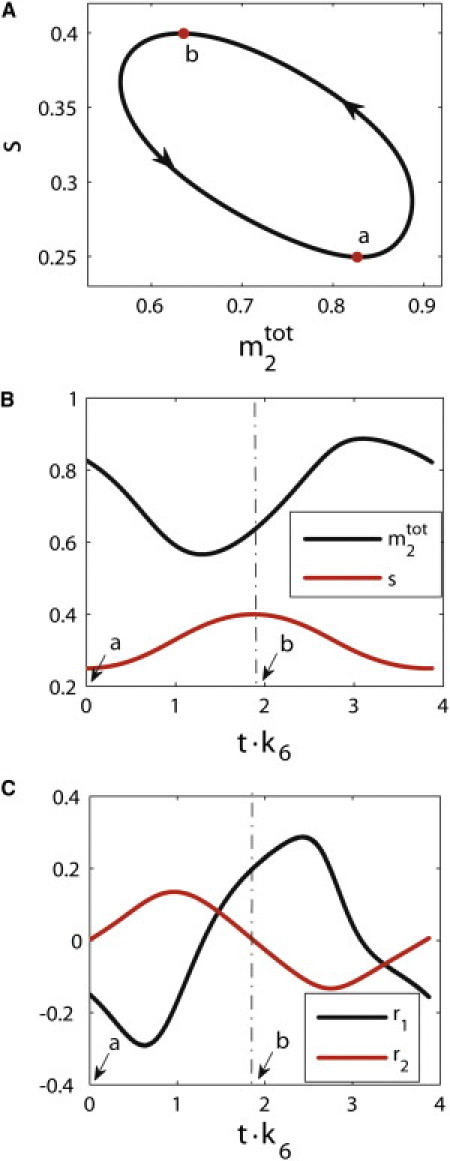
(A) Sample limit cycle in the full model. The rescaled total concentration for the double-phosphorylated ERK (m2tot) is equal to [M2] + [C3] + [C5]/[Mtot]. The rescaled substrate concentration is denoted by s. (B) Dynamics of m2tot and s along the periodic trajectory. (C) Dynamics of the rate of the change of m2tot (r1) and the rate of the change of s (r2) along the periodic trajectory. The labels a and b correspond to two different phases of the periodic trajectory.
Separation of timescales in the full model
The parameter regime for which we found oscillations displays a clear separation of timescales between different model subsystems. In fact, according to Table 1, there are two successive gaps between three characteristic timescales, namely, the timescale corresponding to the change of the kinase/phosphatase in the enzyme regulation subsystem, TE = 1/(k+3Mtot); the timescale corresponding to the change of the enzyme, TM = 1/(k+3E2tot); and the timescale corresponding to the constitutive degradation of the substrate, TS = 1/k6 in the substrate degradation module.
When p2 = E2tot/Mtot = TE/TM is small, there is a separation of timescales within the enzyme regulation subsystem, whose model equations correspond to the first six expressions in Eq. 1. This subsystem consists of two slow equations (the two equations for unphosphorylated and double-phosphorylated enzyme) and four fast equations (the four equations for the complexes of the enzyme with its kinase and phosphatase). In this regime, the unphosphorylated and double-phosphorylated enzyme evolve on a timescale that is slower than the respective complexes. In the limit p2→0, the pseudo-steady-state assumption can be applied to the complexes C1–4, so that the full system (Eq. 1) reduces to the reduced system (Eq. 2).
Furthermore, when p15 = k6/k+3E2tot = TM/Ts is small, there is an additional gap between the previous two timescales and the timescale corresponding to the constitutive degradation of the downstream substrate (S). In this regime, the free substrate and its complex with the double-phosphorylated enzyme evolve on a timescale that is slower than the upstream enzyme regulation subsystem.
Although we cannot guarantee that the existence of oscillations requires such a clear separation of timescales, such a hierarchy allows us to rationalize model behavior in terms of dynamic regimes of isolated subsystems. A similar separation of timescales is characteristic of relaxation oscillations, which are organized around a fast bistable subsystem and a slow subsystem that mediates transitions between branches of two alternative steady states.
Parametric analysis of steady-state and oscillatory solutions
In analyzing the parametric dependence and stability of the identified periodic solutions, we focused on two dimensionless parameters. The first of them, p1, which is proportional to the concentration of the activating kinase (E1), can be viewed as an input to the network. The second parameter, p14, is the ratio of the maximal concentration of the substrate to the total concentration of the various forms of the enzyme.
When p14 is small, the influence from the downstream substrate degradation module to the upstream enzyme regulation module is small. Therefore, dynamics of the full model can be understood in terms of the behavior of isolated modules. For instance, when the enzyme regulation module is bistable, there are three possible steady-state values for the substrate level in the full system (Fig. 3 A). The steady state with high substrate modification rate (low substrate level) corresponds to the state where most of the enzyme is in the active, double-phosphorylated form. A second stable steady state, with low substrate modification rate (high substrate level), corresponds to the state where most of the enzyme is in the unphosphorylated form.
Figure 3.

Representative one-parameter bifurcation diagrams. (A) One-parameter bifurcation diagram showing the steady-state substrate level as a function of the input to the network, p1. The loading level is fixed at a low value (p14 = 3). (Solid black and red dashed curves) Stable and unstable steady states, respectively. (B) One-parameter bifurcation diagram showing the evolution of the steady states as a function of the loading level p14, calculated at fixed input to the network (p1 = 1.6). (Blue dots and open red circles) Stable and unstable periodic solutions, respectively. (C) The period of oscillations as a function of the loading level for the cross section shown in panel B; the period is rescaled by the timescale of constitutive substrate degradation.
The retroactive effect of the substrate on the enzyme regulation module can be explored using one-parameter continuation diagrams of steady states of the full model as a function of the parameter p14, which represents the loading level of the downstream substrate. Results of a representative one-parameter continuation are shown in Fig. 3, B and C, where we started in a bistable regime of the enzyme regulation module. As expected, at small values of the loading parameter the system is still bistable. At a critical value of p14, bistability is destroyed as the unstable steady-state branch (red dashed curve in the lower left of Fig. 3 B) collides with its adjacent stable steady-state branch and disappears in a saddle-node bifurcation, leaving the state with low substrate conversion as the unique steady state of the model. Upon subsequent increase of the loading parameter, this steady state undergoes a subcritical Hopf bifurcation, and is surrounded by a large amplitude limit cycle, where the system oscillates between high and low levels of enzyme phosphorylation.
Using continuation algorithms to follow the instabilities of steady states and oscillatory solutions, we constructed a two-parameter map for the long-term dynamics of the model. This map is partitioned into domains of oscillations, bistability, and unique steady states (Fig. 4). Stable oscillations are realized at intermediate loading level (quantified by p14) of the substrate. When the loading level is relatively low (compared to the magnitude corresponding to oscillations) the dynamics of the full model is close to the dynamics of the enzyme regulation subsystem, which functions as a bistable switch characterized by previous studies. At intermediate loading levels, substrate-dependent control of the enzyme phosphorylation leads to oscillations, where the enzyme phosphorylation is toggled between two, high and low, levels. In this diagram, beyond the critical substrate loading level, bistability is eliminated and the full model becomes monostable for all values of the model input (quantified by p1).
Figure 4.

(A) Partition of input/load parameter space into single-valued (light blue), bistable (gray), and oscillatory (red) regions (top left). (B–D) Two-dimensional phase portraits of the model corresponding to the single-valued, bistable, and oscillatory regions. They correspond to (p1 = 1.0, p14 = 15), (p1 = 1.9, p14 = 6), and (p1 = 1.4, p14 = 15), respectively, with the remaining parameter values shown in Table 1. The two observables in the phase diagram are the rescaled substrate concentration s and the nondimensional total concentration for the double-phosphorylated ERK (m2tot, which is equal to [M2] + [C3] + [C5]/[Mtot]), respectively. (Red solid dots and red asterisks) Associated stable and unstable steady states, respectively.
The computed input/load diagram can be used to systematically explore how different dynamic regimes in the model depend on the values of original, dimensional problem parameters. As an example, let us discuss how the existence of oscillations depends on the timescale of substrate degradation TS = 1/k6. According to the definitions of dimensionless parameters given in Table 1, large values of TS correspond to high loading levels, a regime where oscillations disappear. For small values TS, the steady-state load is negligible and oscillations are again impossible. Thus, oscillations are realized for intermediate values of TS.
Connection between bistability and oscillations
Most of the inputs (p1) that lead to oscillations correspond to bistability in the isolated enzyme regulation module. In fact, the emergence of oscillations can be rationalized by analyzing bistability of an auxiliary problem (see Eq. 3), where the substrate concentration is not a variable, but a parameter. Because the substrate acts as a competitive inhibitor of the phosphatase, high levels of the substrate would stabilize the state with high levels of enzyme phosphorylation. Upon slowly varying the substrate level, we observed a hysteresis in the level of enzyme phosphorylation (black curve in Fig. 5 A).
Figure 5.

(A) Limit cycle in the reduced system and its connection to the bistability in the auxiliary model, at fixed substrate concentration. The hysteresis curve (black) is the input/output map of the auxiliary model, computed using the nondimensional substrate concentration s as a bifurcation parameter. Substrate concentration becomes a dependent variable for the reduced model. (Red curve) Sample trajectory of the reduced model. The parameter values are the same as the ones shown in Table 1 with p1 = 1.45. (B) Time traces of the four variables in the reduced system. For each variable. one oscillation period is shown.
For a chosen set of parameters, at low substrate concentrations, only a state with low enzyme activation (and high rates of dephosphorylation reactions) is stable. On the other hand, at high substrate concentrations, the only steady state corresponds to high enzyme phosphorylation. This bistability provides a skeleton for the oscillations in the reduced model (see Eq. 2) when substrate concentration is allowed to vary as a new, coupled, dependent variable. Indeed, a limit cycle of the reduced model spends a significant fraction of its time close to the steady-state hysteresis loop of the auxiliary problem (Fig. 5, A and B).
To summarize, the identified oscillations are found in a regime where the isolated enzyme regulation module is bistable and there is a clear separation of timescales between substrate degradation and enzyme regulation. This conclusion is based on parametric analysis of periodic solutions. In the future, it will be interesting to test whether this is a necessary condition for the emergence of oscillations. This can be accomplished using a combination of analytical and computational singular perturbation approaches (43,52–54).
Conclusions
ERK can use the same binding domains to interact with its substrates and regulators. This provides a basis for a number of competitive effects (23,24,55,56). As a consequence, ERK substrates can compete with ERK phosphatases and control the level of ERK phosphorylation (24). Experiments in cultured cells and in vivo demonstrate that such effects indeed exist and are of appreciable magnitude (24,25,57). Here we use a mathematical model to suggest that substrate-dependent control of ERK phosphorylation can qualitatively change the dynamics of a biochemical network that controls ERK activation. On its own, this network can be either monostable or bistable (31,32). However, in a larger system, where active ERK accelerates the degradation rate of a substrate that competes with the ERK phosphatase, this network can give rise to self-sustained oscillations. During the time course of these oscillations, the system switches between states with low and high levels of substrate conversion.
The proposed mechanism of oscillatory ERK signaling is different from the previously described mechanisms whereby active ERK reduces the positive input to the ERK cascade (14,20). In contrast to the mechanism where active ERK reduces the rate at which ERK is phosphorylated by its upstream kinase, in our mechanism active ERK downregulates a substrate, which protects active ERK from dephosphorylation by phosphatase. Importantly, these oscillations are realized at a constant activity of the ERK kinase. In addition to this biochemical difference, the two mechanisms differ from the systems-level perspective: In all previous models, oscillations emerge due to a time delay between ERK activation and negative feedback at the level of the ERK activation cascade (13,20,21). In our case, oscillations result from the retroactive interaction between ERK substrate and bistability of the ERK phosphorylation network.
Retroactivity is a term used to describe an effect whereby the downstream target of an upstream module changes the internal state of this module (54,58,59). In our case, an ERK substrate, which is commonly viewed as a downstream target of active ERK, changes the level of ERK phosphorylation, which is commonly believed to be controlled independently of ERK substrates. In our model, the ERK phosphorylation subsystem can be at most bistable, whereas the substrate synthesis/degradation subsystem has a unique steady state. Coupling of the two modules, realized by the reaction of ERK binding to its substrate, can generate a retroactive effect that leads to oscillations. From the nonlinear dynamics perspective, this effect is not surprising and fits the oscillatory mechanisms in other systems (60). It is based on a bistable system coupled to a slow variable that switches the bistable system between the two stable branches of steady states.
Recent experiments in the early Drosophila embryo suggest that retroactive effects contribute to the spatial regulation of gene expression induced by ERK signaling (48). Based on the computational studies in this article, we propose that retroactive effects can also regulate the dynamics of ERK signaling. We hope that our work will motivate future studies of retroactive effects in pathways where substrates of a signaling enzyme compete with its regulators.
Acknowledgments
S.Y.S. thanks Boris Kholodenko and Mikhail Tsyganov for helpful discussions.
S.Y.S. was supported by R01GM086537 from the National Institute of General Medical Sciences. The work of P.L. and I.G.K. was partially supported by the United States Department of Energy (grant DE-SC0002097).
References
- 1.Chen Z., Gibson T.B., Cobb M.H. MAP kinases. Chem. Rev. 2001;101:2449–2476. doi: 10.1021/cr000241p. [DOI] [PubMed] [Google Scholar]
- 2.Shaul Y.D., Seger R. The MEK/ERK cascade: from signaling specificity to diverse functions. Biochim. Biophys. Acta. 2007;1773:1213–1226. doi: 10.1016/j.bbamcr.2006.10.005. [DOI] [PubMed] [Google Scholar]
- 3.Gabay L., Seger R., Shilo B.Z. MAP kinase in situ activation atlas during Drosophila embryogenesis. Development. 1997;124:3535–3541. doi: 10.1242/dev.124.18.3535. [DOI] [PubMed] [Google Scholar]
- 4.Corson L.B., Yamanaka Y., Rossant J. Spatial and temporal patterns of ERK signaling during mouse embryogenesis. Development. 2003;130:4527–4537. doi: 10.1242/dev.00669. [DOI] [PubMed] [Google Scholar]
- 5.Lunn J.S., Fishwick K.J., Storey K.G. A spatial and temporal map of FGF/Erk1/2 activity and response repertoires in the early chick embryo. Dev. Biol. 2007;302:536–552. doi: 10.1016/j.ydbio.2006.10.014. [DOI] [PubMed] [Google Scholar]
- 6.Röttinger E., Besnardeau L., Lepage T. A Raf/MEK/ERK signaling pathway is required for development of the sea urchin embryo micromere lineage through phosphorylation of the transcription factor Ets. Development. 2004;131:1075–1087. doi: 10.1242/dev.01000. [DOI] [PubMed] [Google Scholar]
- 7.Maekawa M., Yamamoto T., Nishida E. Requirement for ERK MAP kinase in mouse preimplantation development. Development. 2007;134:2751–2759. doi: 10.1242/dev.003756. [DOI] [PubMed] [Google Scholar]
- 8.Kim M., McGinnis W. Phosphorylation of Grainy head by ERK is essential for wound-dependent regeneration but not for development of an epidermal barrier. Proc. Natl. Acad. Sci. USA. 2011;108:650–655. doi: 10.1073/pnas.1016386108. [DOI] [PMC free article] [PubMed] [Google Scholar]
- 9.Suzuki M., Satoh A., Tamura K. Transgenic Xenopus with prx1 limb enhancer reveals crucial contribution of MEK/ERK and PI3K/AKT pathways in blastema formation during limb regeneration. Dev. Biol. 2007;304:675–686. doi: 10.1016/j.ydbio.2007.01.019. [DOI] [PubMed] [Google Scholar]
- 10.Okuyama T., Inoue H., Nishida E. The ERK-MAPK pathway regulates longevity through SKN-1 and insulin-like signaling in Caenorhabditis elegans. J. Biol. Chem. 2010;285:30274–30281. doi: 10.1074/jbc.M110.146274. [DOI] [PMC free article] [PubMed] [Google Scholar]
- 11.Avruch J. Insulin signal transduction through protein kinase cascades. Mol. Cell. Biochem. 1998;182:31–48. [PubMed] [Google Scholar]
- 12.Moorman S., Mello C.V., Bolhuis J.J. From songs to synapses: molecular mechanisms of birdsong memory. Molecular mechanisms of auditory learning in songbirds involve immediate early genes, including zenk and arc, the ERK/MAPK pathway and synapsins. Bioessays. 2011;33:377–385. doi: 10.1002/bies.201000150. [DOI] [PubMed] [Google Scholar]
- 13.Shankaran H., Ippolito D.L., Wiley H.S. Rapid and sustained nuclear-cytoplasmic ERK oscillations induced by epidermal growth factor. Mol. Syst. Biol. 2009;5:332. doi: 10.1038/msb.2009.90. [DOI] [PMC free article] [PubMed] [Google Scholar]
- 14.Nakayama K., Satoh T., Nishida E. FGF induces oscillations of Hes1 expression and Ras/ERK activation. Curr. Biol. 2008;18:R332–R334. doi: 10.1016/j.cub.2008.03.013. [DOI] [PubMed] [Google Scholar]
- 15.Whitehurst A., Cobb M.H., White M.A. Stimulus-coupled spatial restriction of extracellular signal-regulated kinase 1/2 activity contributes to the specificity of signal-response pathways. Mol. Cell. Biol. 2004;24:10145–10150. doi: 10.1128/MCB.24.23.10145-10150.2004. [DOI] [PMC free article] [PubMed] [Google Scholar]
- 16.Ferrell J.E., Jr., Machleder E.M. The biochemical basis of an all-or-none cell fate switch in Xenopus oocytes. Science. 1998;280:895–898. doi: 10.1126/science.280.5365.895. [DOI] [PubMed] [Google Scholar]
- 17.Mackeigan J.P., Murphy L.O., Blenis J. Graded mitogen-activated protein kinase activity precedes switch-like c-Fos induction in mammalian cells. Mol. Cell. Biol. 2005;25:4676–4682. doi: 10.1128/MCB.25.11.4676-4682.2005. [DOI] [PMC free article] [PubMed] [Google Scholar]
- 18.Reference deleted in proof.
- 19.Sturm O.E., Orton R., Kolch W. The mammalian MAPK/ERK pathway exhibits properties of a negative feedback amplifier. Sci. Signal. 2010;3:ra90. doi: 10.1126/scisignal.2001212. [DOI] [PubMed] [Google Scholar]
- 20.Shankaran H., Wiley H.S. Oscillatory dynamics of the extracellular signal-regulated kinase pathway. Curr. Opin. Genet. Dev. 2010;20:650–655. doi: 10.1016/j.gde.2010.08.002. [DOI] [PubMed] [Google Scholar]
- 21.Kholodenko B.N. Negative feedback and ultrasensitivity can bring about oscillations in the mitogen-activated protein kinase cascades. Eur. J. Biochem. 2000;267:1583–1588. doi: 10.1046/j.1432-1327.2000.01197.x. [DOI] [PubMed] [Google Scholar]
- 22.Avraham R., Yarden Y. Feedback regulation of EGFR signaling: decision making by early and delayed loops. Nat. Rev. Mol. Cell Biol. 2011;12:104–117. doi: 10.1038/nrm3048. [DOI] [PubMed] [Google Scholar]
- 23.Tanoue T., Adachi M., Nishida E. A conserved docking motif in MAP kinases common to substrates, activators and regulators. Nat. Cell Biol. 2000;2:110–116. doi: 10.1038/35000065. [DOI] [PubMed] [Google Scholar]
- 24.Bardwell A.J., Abdollahi M., Bardwell L. Docking sites on mitogen-activated protein kinase (MAPK) kinases, MAPK phosphatases and the Elk-1 transcription factor compete for MAPK binding and are crucial for enzymic activity. Biochem. J. 2003;370:1077–1085. doi: 10.1042/BJ20021806. [DOI] [PMC free article] [PubMed] [Google Scholar]
- 25.Kim Y., Paroush Z., Shvartsman S.Y. Substrate-dependent control of MAPK phosphorylation in vivo. Mol. Syst. Biol. 2011;7:467. doi: 10.1038/msb.2010.121. [DOI] [PMC free article] [PubMed] [Google Scholar]
- 26.Astigarraga S., Grossman R., Jiménez G. A MAPK docking site is critical for downregulation of Capicua by Torso and EGFR RTK signaling. EMBO J. 2007;26:668–677. doi: 10.1038/sj.emboj.7601532. [DOI] [PMC free article] [PubMed] [Google Scholar]
- 27.Rebay I., Rubin G.M. Yan functions as a general inhibitor of differentiation and is negatively regulated by activation of the Ras1/MAPK pathway. Cell. 1995;81:857–866. doi: 10.1016/0092-8674(95)90006-3. [DOI] [PubMed] [Google Scholar]
- 28.Zehorai E., Yao Z., Seger R. The subcellular localization of MEK and ERK—a novel nuclear translocation signal (NTS) paves a way to the nucleus. Mol. Cell. Endocrinol. 2010;314:213–220. doi: 10.1016/j.mce.2009.04.008. [DOI] [PubMed] [Google Scholar]
- 29.Legewie S., Schoeberl B., Herzel H. Competing docking interactions can bring about bistability in the MAPK cascade. Biophys. J. 2007;93:2279–2288. doi: 10.1529/biophysj.107.109132. [DOI] [PMC free article] [PubMed] [Google Scholar]
- 30.Craciun G., Tang Y.Z., Feinberg M. Understanding bistability in complex enzyme-driven reaction networks. Proc. Natl. Acad. Sci. USA. 2006;103:8697–8702. doi: 10.1073/pnas.0602767103. [DOI] [PMC free article] [PubMed] [Google Scholar]
- 31.Markevich N.I., Hoek J.B., Kholodenko B.N. Signaling switches and bistability arising from multisite phosphorylation in protein kinase cascades. J. Cell Biol. 2004;164:353–359. doi: 10.1083/jcb.200308060. [DOI] [PMC free article] [PubMed] [Google Scholar]
- 32.Ortega F., Garcés J.L., Cascante M. Bistability from double phosphorylation in signal transduction. Kinetic and structural requirements. FEBS J. 2006;273:3915–3926. doi: 10.1111/j.1742-4658.2006.05394.x. [DOI] [PubMed] [Google Scholar]
- 33.Strogatz S. Westview Press; Boulder, CO: 2001. Nonlinear Dynamics and Chaos: with Applications to Physics, Biology, Chemistry, and Engineering. [Google Scholar]
- 34.Doedel E.J. AUTO, a program for the automatic bifurcation analysis of autonomous systems. Cong. Numer. 1981;30:265–384. [Google Scholar]
- 35.Doedel E.J., Keller H.B., Kernévez J.P. Numerical analysis and control of bifurcation problems: (I) Bifurcation in finite dimensions. Int. J. Bifurcat. Chaos. 1991;1:493–520. [Google Scholar]
- 36.Doedel E.J., Paffenroth R.C., Wang X. California Institute of Technology; Pasadena, CA: 2001. AUTO 2000: Continuation and bifurcation software for ordinary differential equations (with HomCont) (Technical Report). [Google Scholar]
- 37.Dhooge A., Govaerts W., Kuznetsov Y.A. MATCONT: a MATLAB package for numerical bifurcation analysis of ODEs. ACM Trans. Math. Softw. 2003;29:141–164. [Google Scholar]
- 38.Govaerts W., Kuznetsov Y.A., Dhooge A. Numerical continuation of bifurcations of limit cycles in MATLAB. SIAM J. Sci. Comput. 2003;27:231–252. [Google Scholar]
- 39.Kuznetsov Y.A., Govaerts W., Dhooge A. Numerical periodic normalization for codim 1 bifurcations of limit cycles. SIAM J. Numer. Anal. 2005;43:1407–1435. [Google Scholar]
- 40.Ferrell J.E., Jr., Bhatt R.R. Mechanistic studies of the dual phosphorylation of mitogen-activated protein kinase. J. Biol. Chem. 1997;272:19008–19016. doi: 10.1074/jbc.272.30.19008. [DOI] [PubMed] [Google Scholar]
- 41.Burack W.R., Sturgill T.W. The activating dual phosphorylation of MAPK by MEK is nonprocessive. Biochemistry. 1997;36:5929–5933. doi: 10.1021/bi970535d. [DOI] [PubMed] [Google Scholar]
- 42.Zhao Y., Zhang Z.Y. The mechanism of dephosphorylation of extracellular signal-regulated kinase 2 by mitogen-activated protein kinase phosphatase 3. J. Biol. Chem. 2001;276:32382–32391. doi: 10.1074/jbc.M103369200. [DOI] [PubMed] [Google Scholar]
- 43.Wang L., Sontag E.D. On the number of steady states in a multiple futile cycle. J. Math. Biol. 2008;57:29–52. doi: 10.1007/s00285-007-0145-z. [DOI] [PubMed] [Google Scholar]
- 44.Ferrell J.E., Jr. Self-perpetuating states in signal transduction: positive feedback, double-negative feedback and bistability. Curr. Opin. Cell Biol. 2002;14:140–148. doi: 10.1016/s0955-0674(02)00314-9. [DOI] [PubMed] [Google Scholar]
- 45.Nakakuki T., Birtwistle M.R., Kholodenko B.N. Ligand-specific c-Fos expression emerges from the spatiotemporal control of ErbB network dynamics. Cell. 2010;141:884–896. doi: 10.1016/j.cell.2010.03.054. [DOI] [PMC free article] [PubMed] [Google Scholar]
- 46.Murphy L.O., Smith S., Blenis J. Molecular interpretation of ERK signal duration by immediate early gene products. Nat. Cell Biol. 2002;4:556–564. doi: 10.1038/ncb822. [DOI] [PubMed] [Google Scholar]
- 47.Jiménez G., Guichet A., Casanova J. Relief of gene repression by torso RTK signaling: role of capicua in Drosophila terminal and dorsoventral patterning. Genes Dev. 2000;14:224–231. [PMC free article] [PubMed] [Google Scholar]
- 48.Kim Y., Andreu M.J., Shvartsman S.Y. Gene regulation by MAPK substrate competition. Dev. Cell. 2011;20:880–887. doi: 10.1016/j.devcel.2011.05.009. [DOI] [PMC free article] [PubMed] [Google Scholar]
- 49.Kim Y., Coppey M., Shvartsman S.Y. MAPK substrate competition integrates patterning signals in the Drosophila embryo. Curr. Biol. 2010;20:446–451. doi: 10.1016/j.cub.2010.01.019. [DOI] [PMC free article] [PubMed] [Google Scholar]
- 50.Fall C., Marland E., Tyson J.J. Springer-Verlag; New York: 2002. Computational Cell Biology. [Google Scholar]
- 51.Tyson J.J., Chen K., Novak B. Network dynamics and cell physiology. Nat. Rev. Mol. Cell Biol. 2001;2:908–916. doi: 10.1038/35103078. [DOI] [PubMed] [Google Scholar]
- 52.Kourdis P.D., Steuer R., Goussis D.A. Physical understanding of complex multiscale biochemical models via algorithmic simplification: glycolysis in Saccharomyces cerevisiae. Phys. D. 2010;239:1798–1817. [Google Scholar]
- 53.Del Vecchio D., Jayanthi S. Retroactivity attenuation in biomolecular systems based on time-scale separation. IEEE Trans. Automat. Contr. 2011;56:748–761. [Google Scholar]
- 54.Del Vecchio D., Ninfa A.J., Sontag E.D. Modular cell biology: retroactivity and insulation. Mol. Syst. Biol. 2008;4:161–177. doi: 10.1038/msb4100204. [DOI] [PMC free article] [PubMed] [Google Scholar]
- 55.Tanoue T., Nishida E. Docking interactions in the mitogen-activated protein kinase cascades. Pharmacol. Ther. 2002;93:193–202. doi: 10.1016/s0163-7258(02)00188-2. [DOI] [PubMed] [Google Scholar]
- 56.Zhang J.L., Zhou B., Zhang Z.Y. A bipartite mechanism for ERK2 recognition by its cognate regulators and substrates. J. Biol. Chem. 2003;278:29901–29912. doi: 10.1074/jbc.M303909200. [DOI] [PubMed] [Google Scholar]
- 57.Kim S.Y., Ferrell J.E., Jr. Substrate competition as a source of ultrasensitivity in the inactivation of Wee1. Cell. 2007;128:1133–1145. doi: 10.1016/j.cell.2007.01.039. [DOI] [PubMed] [Google Scholar]
- 58.Ventura A.C., Jiang P., Ninfa A.J. Signaling properties of a covalent modification cycle are altered by a downstream target. Proc. Natl. Acad. Sci. USA. 2010;107:10032–10037. doi: 10.1073/pnas.0913815107. [DOI] [PMC free article] [PubMed] [Google Scholar]
- 59.Saez-Rodriguez J., Gayer S., Gilles E.D. Automatic decomposition of kinetic models of signaling networks minimizing the retroactivity among modules. Bioinformatics. 2008;24:i213–i219. doi: 10.1093/bioinformatics/btn289. [DOI] [PubMed] [Google Scholar]
- 60.Novák B., Tyson J.J. Design principles of biochemical oscillators. Nat. Rev. Mol. Cell Biol. 2008;9:981–991. doi: 10.1038/nrm2530. [DOI] [PMC free article] [PubMed] [Google Scholar]