

Abstract
The conduction properties of the voltage-gated potassium channel Kv1.3 and its modes of interaction with several polypeptide venoms are examined using Brownian dynamics simulations and molecular dynamics calculations. Employing an open-state homology model of Kv1.3, we first determine current-voltage and current-concentration curves and ascertain that simulated results accord with experimental measurements. We then investigate, using a molecular docking method and molecular dynamics simulations, the complexes formed between the Kv1.3 channel and several Kv-specific polypeptide toxins that are known to interfere with the conducting mechanisms of several classes of voltage-gated K+ channels. The depths of potential of mean force encountered by charybdotoxin, α-KTx3.7 (also known as OSK1) and ShK are, respectively, −19, −27, and −25 kT. The dissociation constants calculated from the profiles of potential of mean force correspond closely to the experimentally determined values. We pinpoint the residues in the toxins and the channel that are critical for the formation of the stable venom-channel complexes.
Introduction
Of all the members of the voltage-gated potassium channel (Kv) family, the Kv1.3 channel is of special interest and has thus far attracted intense experimental and theoretical studies. Expressed predominantly in human lymphocytes, the Kv1.3 channel has been recognized as an important target for immunosuppression therapy (1,2). When stimulated repeatedly by antigens, naive T cells differentiate into effector memory T lymphocytes, which after entering inflamed tissues produce and release copious amounts of cytokines (3). By blocking the Kv1.3 channel in T cells, their activation in vitro can be inhibited, and experimentally induced autoimmune encephalomyelitis in rats can be ameliorated (4).
In the past three decades, a large number of peptide venoms acting on K+ channels have been extracted from marine cone snails, scorpions, sea anemones, and snakes. These toxins, which are usually 23–64 amino acid residues in length, are tightly packed by three or four disulfide bridges. Some of these polypeptide toxins block or modify potassium permeability in excitable and nonexcitable cells at nanomolar (nM) concentrations or below. Several subtypes of the voltage-gated K+ channels, including the Kv1.3 channel, have particularly high binding affinities to a number of these polypeptide toxins. Kv1.3 and similar channels have a number of acidic residues lining the wall of the extracellular vestibule. The venoms, which carry charges of between +5 and +8 e, are drawn toward the negatively charged receptor site, near the entrance of the selectivity filter, where they physically occlude the conducting pathway of K+ ions. Some among the toxins that effectively block the Kv1.3 channels are the scorpion toxins, such as charybdotoxin (ChTX), Pandinus toxin, margatoxin and α-kaliotoxin, and Stichodactyla toxin (ShK), which is isolated from the sea anemone Stichodactyla helianthus.
In their pioneering work, Park and Miller (5,6), using mutagenesis analysis, examined the role of charged residues in the binding of ChTX to the calcium-activated K+ channel. The key charged residues, the mutation of which to neutral residues (Asn or Gln) has a drastic reduction in the binding affinity of the toxin, are located on one side of the ChTX molecule. The lysine residue at position 27 (or position 22, 28 in certain other toxins) is one of these basic residues, which is conserved across all scorpion toxins. Substitution of this residue to a neutral residue causes the binding affinity of the toxin to decrease by 500-fold or above. Since then, numerous experimental and theoretical studies (7–10) have confirmed the initial findings of Park and Miller (5,6). The general picture emerging from these studies is that the toxin with its net positive charge is attracted by the negatively charged residues on the vestibular wall and approaches the selectivity filter with one lysine residue pointing toward the channel entrance. The side chain of the key lysine residue then wedges into the narrow selectivity filter, whereas the side chains of other basic residues form electrostatic complexes with some of the acidic residues on the channel. Selectivity of a given toxin for a specific Kv channel over another appears to arise predominantly from the locations of the basic residues on the polypeptide molecule relative to the locations of the acidic residues on the vestibular wall of the channel.
Using a molecular docking method and molecular dynamics (MD), we investigate the modes of interactions between three different toxins of distinct binding affinity to Kv1.3, namely, ChTX, α-kaliotoxin (α-KTx3.7 or OSK1), and ShK, and a homology model of the voltage-gated K+ channel, Kv1.3. With Brownian dynamics (BD) (11), we first characterize the conductance properties of the homology model constructed using the Kv1.2 channel as a template. We then determine the profile of potential of mean force (PMF) encountered by each of the polypeptide toxins as it approaches from the reservoir to the entrance of the channel. We show that the binding affinities of the three toxins to the Kv1.3 channel, deduced from our computational studies, accurately mirror those deduced experimentally. Thus, we show here that it should be possible to make accurate predictions of binding affinity for any arbitrary compound using computational methods. From the three-dimensional toxin-channel complexes obtained from MD simulations, we identify the key residue pairs for the binding, and pinpoint the reasons for a higher binding affinity of one toxin compared to the other. Finally, the PMF profiles we calculated for the toxin may serve as the benchmark for devising a new computational tool, less computationally expensive than MD, for rapidly screening novel pharmaceutical compounds for combating human diseases.
Methods
Homology model of Kv1.3
The 575 amino acid sequence of a Kv1.3 ion channel was obtained from the National Center for Biotechnology Information (NCBI) protein database (NCBI entry NP_002223.3). Sequence analysis using the NCBI Conserved Domain Search tool showed it contained the S5 and S6 transmembrane domains as well as the selectivity filter of the ion channel. The crystal structure for Kv1.3 has not yet been solved. A search for similar sequences using the BLAST program (12) revealed >70% identity with the sequence of the voltage-gated ion channel Kv1.2 from Rattus norvegicus (NCBI entry NP_037102.1) whose crystal structure has been solved (13) and refined to a resolution of 2.9 Å (14). In particular, Kv1.2 and Kv1.3 share 93% sequence identity in the pore domain (see Fig. S1 in the Supporting Material). To generate a homology model of Kv1.3, the automated homology modeling server Swiss-Model was used (15–17). Residues 104–491 of the Kv1.3 sequence were modeled using the refined structure of the Kv1.2 channel (PDB ID 3LUT) (13,14) as template. The structure of one subunit of Kv1.3 was generated using First Approach Mode set at default parameters. The symmetry matrix of the 3LUT PDB coordinate file was applied to replicate Kv1.3 subunit coordinates, creating the fourfold symmetry required to construct the Kv1.3 channel homotetramer. The resulting structure was refined using MD simulations in vacuum.
Initial structure of Kv1.3
A truncated version of the Kv1.3 channel structure is used in all docking and MD simulations (see Fig. 1). In this truncated structure, only the residues 374–491 forming the selectivity filter and the surrounding transmembrane domains S5 and S6 are retained, whereas transmembrane helices S1–S4 and the periplasmic turret region (PTR, residues 261–290) connecting S1 and S2 domains are removed. By eliminating residues 104–373 including the ones forming the PTR, a considerable amount of computing time is saved without compromising accuracy significantly. The truncated channel has a net charge of zero. To test if the PTR affects the binding affinity of the toxins significantly, the PMF profile for the unbinding of ChTX from the Kv1.3 channel with the PTR (residues 201–491, net charge −12 e) is also calculated.
Figure 1.
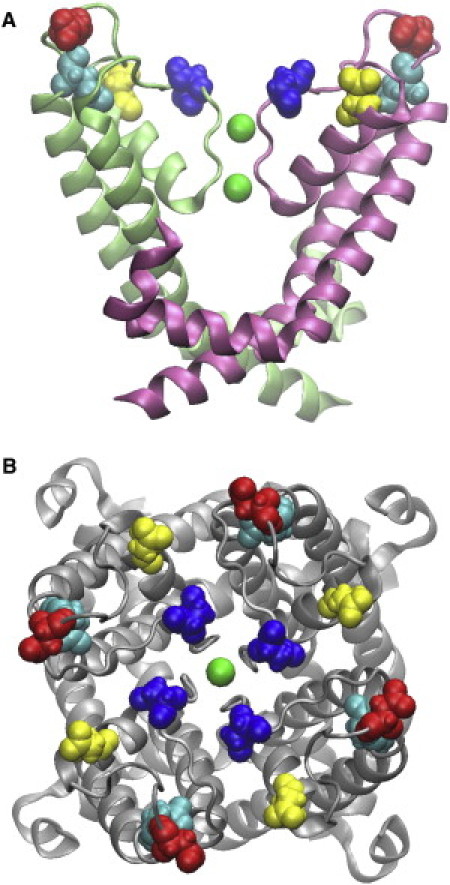
Structure of the truncated Kv1.3 channel viewed from perpendicular to the channel axis (A) and from the periplasmic side of the membrane along the channel axis (B). In A, only two of four channel subunits (light green and pink) are shown for clarity. The two K+ ions in the channel selectivity filter are shown in green. The Asp-423, Glu-420, Asp-433, and Asp-449 residues of the channel are shown in red, cyan, yellow, and blue, respectively.
A rectangular simulation box is constructed, in which the channel is embedded in a POPC (2-oleoyl-1-palmitoyl-sn-glycero-3-phosphocholine) bilayer solvated with TIP3P water and 0.2 M KCl. The overall charge of the final simulation box, 100 × 100 × 100 Å3 in size, is zero. Two bulk K+ ions are moved to the S2 and S4 binding sites in the channel selectivity filter, separated by a single water molecule in the S3 binding site. No K+ ion is moved to the S0 or S1 binding site because it has been shown that with the presence of a K+ ion in the S1 binding site the side chain of Lys-27 of ChTX is displaced from the selectivity filter of the KcsA channel (18). This configuration of ions and water in the selectivity filter is chosen because it is likely to represent the most probable state of the system, as evidenced by previous theoretical calculations (19,20), and would therefore largely account for the observed free energy. Ideally, one would sample all possible configurations of ions and water, but the single file nature of the filter would make such sampling computationally prohibitive. The system is energy minimized and further equilibrated for 1.5 ns with the backbone atoms of Kv1.3 and the two K+ ions in the selectivity filter restrained to the initial structure by a weak force constant of 0.25 kcal/mol/Å2, using MD simulations. After equilibration, the POPC lipids are in very good contact with the channel, and the system shrinks to 98 × 98 × 97 Å3. The equilibrated channel together with the lipid bilayer is shown in Fig. S2. The lipids, not in direct contact with the toxin in the bound state, are not expected to affect the toxin binding significantly because the channel backbone remains stable in all the simulations. For example, the maximum root mean-square deviation (RMSD) of the channel backbone with respect to the starting structure is always below 2 Å in all the umbrella sampling simulations.
Brownian dynamics
To measure the conductance of ions through the channel, we carry out three-dimensional BD simulations, using the procedures detailed in the Supporting Material. For further technical details of the simulation methods and the parameters used for the short-range ion-ion potential function, see Chung et al. (11,21).
Molecular docking
To predict the bound state orientation of the toxins relative to the channel, the rigid-body docking program ZDOCK version 3.0.1 is used (22). PDB structures 2A9H (10), 1SCO (23), and 1ROO (24) are used for ChTX, OSK1, and ShK, respectively. The structure from the equilibrated simulation box described previously is used for Kv1.3. Residues 374–399 and 461–491 forming the transmembrane domains or the cytoplasmic surface of the channel are not believed to bind the toxins, and therefore are blocked in the docking calculations. The presence of Lys-27 (ChTX and OSK1) and Lys-22 (ShK) within 6 Å of the residue Asp-449 of Kv1.3 at the periplasmic rim of the channel selectivity filter (Fig. 1) is used as a criterion for successful docking. This is because experimental studies have suggested that on binding to KCa, Kv, or KcsA channels residue Lys-27 of ChTX and kaliotoxin (82% sequence identity with OSK1) and residue Lys-22 of ShK protrudes into the channel selectivity filter (5,10,25,26).
For each toxin, a variety of channel-toxin structures are predicted by ZDOCK. In each case, the top-ranked 600 structures are considered as possible docking modes. The lysine residue at position 22 or 27 of the toxin is docked into the channel selectivity filter in one of the top-ranked structures, whereas in a majority of the structures the toxin is docked into other positions of the channel. The highest ranked structure satisfying the selection criterion described previously is selected. Because the flexibility of both toxins and channel is not taken into account by the docking calculations, it is unlikely that the predicted structures are the most appropriate representations of the bound states. Therefore, MD simulations are used to predict the bound state starting from the docked complex. A two-stage equilibration totaling 3.5 ns is performed for each toxin-channel complex in a POPC membrane environment as detailed below, allowing the systems to evolve to a thermodynamically stable state. During the equilibration, significant rearrangements between the toxin and channel are observed, allowing the salt bridges (see Fig. 5 A) to be formed. Also shown are the channel-toxin complexes after the equilibration (see Fig. 3).
Figure 5.
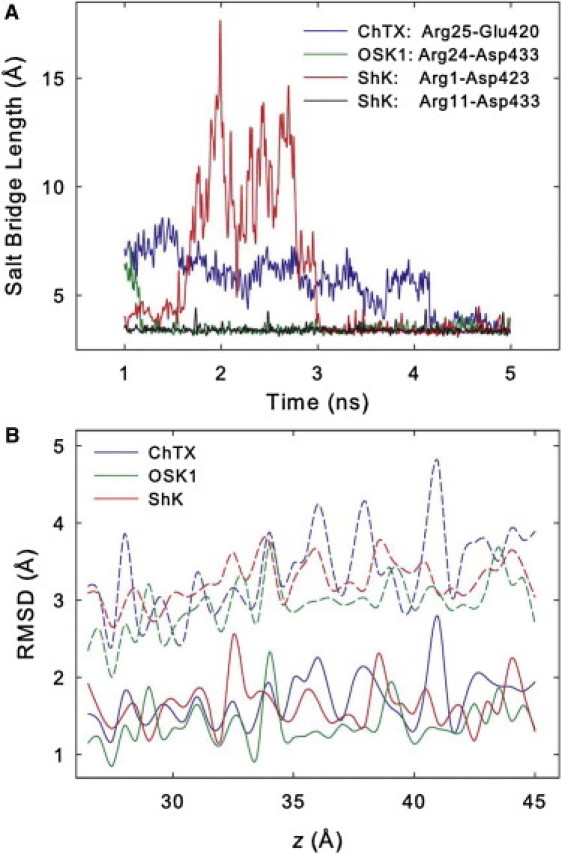
(A) Length of the salt bridges formed between the toxins and the Kv1.3 channel as a function of the simulation time (window z = 27.0 Å). (B) Average RMSD of the backbone (solid lines) and side chain (dashed lines) of the toxins with respect to the starting structure for each umbrella window.
Figure 3.
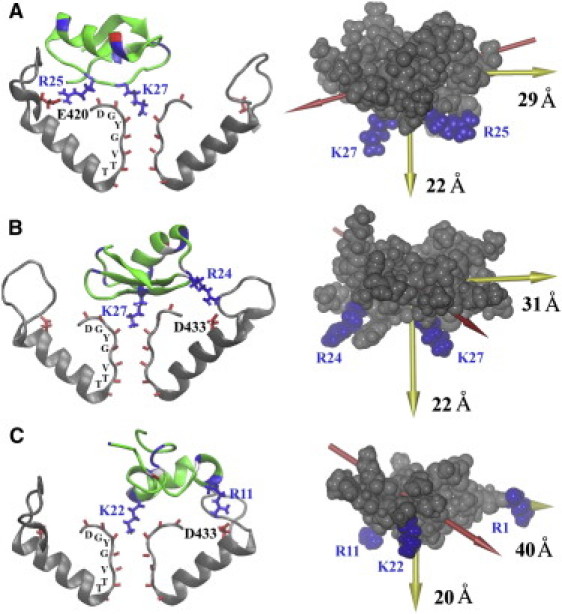
Bound state of the three toxins ChTX (A), OSK1 (B), and ShK (C) with the Kv1.3 channel after 3.5 ns of MD simulation, starting from the structure predicted by molecular docking. The backbones of the basic, acidic, and other residues of the toxin are shown in blue, red, and green, respectively. The side chains of the toxin residues that protrude into the channel selectivity filter or form salt bridges with channel acidic residues are highlighted in blue. Two channel subunits (residues 401–450) are shown in gray. The carbonyl groups of the channel residues 443–449 forming the selectivity filter are highlighted in red. The side chains of the channel acidic residues that form salt bridges with the toxin are highlighted in red. Toxin residues are labeled in blue, and channel residues in black. The principal axes (yellow arrows) and the dipole moment (red arrow) of the toxin are shown on the right. The sizes of the toxin along the longest and shortest axes are given.
MD simulations
All MD simulations are performed using NAMD 2.7 (27). The CHARMM27 force fields for proteins and lipids with CMAP correction terms to protein backbone dihedrals (28,29), and the TIP3P model for water (30) are used. The switch and cutoff distances for short-range interactions are set to 8.0 and 12.0 Å, respectively. The particle mesh Ewald method is used to describe long-range electrostatic interactions, with a maximum grid spacing of 1.0 Å. Rectangular periodic boundary conditions are applied. The SHAKE (31) and SETTLE (32) algorithms are used to keep the bond lengths in the system rigid. A time step of 2 fs is used, unless otherwise stated. The short-range nonbonded interactions are computed every step, whereas the long-range electrostatic forces are evaluated every 2 steps together with the pair list. In all simulations, the temperature is kept constant at an average value of 300 K by using the Langevin dynamics with a damping coefficient of 1 ps−1. The Nosé-Hoover Langevin Piston method (33) is used for maintaining the pressure in the system at an average value of 1 atm, in which the barostat oscillation and damping timescale are set to 200 and 100 ps, respectively. The pressure coupling is semiisotropic. Trajectories are saved every 10 ps for analysis.
Umbrella sampling
For each toxin, the top-rank successfully docked complex is used to replace the channel in the equilibrated box described previously. Water molecules and ions that overlap the toxin are removed. The systems are then neutralized by adjusting the numbers of K+ and Cl− ions. The new systems are then subjected to a two-stage equilibration, the first and second stages lasting 1.5 and 2.0 ns, respectively. In the first stage, the protein backbone atoms are harmonically restrained to the initial structure using a force constant of 0.25 kcal/mol/Å2. The time step is set to 1 fs. In the second stage, the harmonic restraint is released. For each toxin, the equilibrated system is subsequently used for generating umbrella windows. A force constant of 30 kcal/mol/Å2 is applied to pull the toxin out from the binding site in all cases. During the pulling, harmonic restraint (20 kcal/mol/Å2) is applied to maintain the RMSD of the backbone of the toxins with reference to the starting structure below 0.5 Å, so that no significant conformational changes in the toxins are induced. The channel backbone atoms are fixed during pulling. The channel central axis (z dimension), which provides a natural binding pathway for the toxins and has been used in previous umbrella sampling of ChTX and KcsA (18,34), is chosen as the reaction coordinate. The pulling generates a continuous distribution of each toxin along the channel permeation pathway, which is used to select the starting configuration for each umbrella window. No restraint to the backbone atoms of the toxin and channel is applied during umbrella sampling. Windows are spaced at 0.5 Å intervals. A good overlap between the windows is achieved.
For ChTX, a force constant of 20 kcal/mol/Å2 is applied to restrain the center of mass (COM) of the backbone atoms to the center of each umbrella window. For ShK and OSK1, a larger force constant of 30 kcal/mol/Å2 is used because of their stronger interactions with the channel. Each umbrella window is simulated for at least 5.0 ns, and the PMF profiles are observed to converge on this time scale. A convergence is assumed if the depth of the PMF profile changes by <0.5 kT by running the umbrella sampling 1 ns longer. Virtually the same depth of PMF is obtained regardless of whether the first 1 or 2 ns are removed from analysis. Therefore, the first 1 ns is considered as equilibration and removed from data analysis. The COM of the toxin is confined to be within a cylinder of 8 Å in radius centered on the channel axis, beyond which a potential of 20 kcal/mol/Å2 is applied. The COM coordinates of the backbone atoms of the toxins are saved every 1 ps for analysis.
Data analysis
The COM coordinates of the backbone atoms of the toxins along the z dimension are used to construct the PMF profile using the weighted histogram analysis method (35). The window at z = 45 Å is assumed to be similar to the bulk, the PMF value of which is set to zero. Note that the COM for the channel is z = 0 Å. The dissociation constant (Kd) in the unit of molar is estimated as
| (1) |
where R equals 8 × 10⁻¹⁰ m, NA is Avogadro's number (6.02 × 10²³), zmin and zmax are the boundaries of the binding site along the channel axis, W(z) is the PMF at the window z, and kT assumes the usual significance. The electrostatic interaction energy (Eie) between the toxin and the rest of the system is calculated as
| (2) |
where rij is the distance between atoms i and j, qi and qj are point partial charges of atoms i and j, respectively. The angular brackets denote ensemble average. The van der Waals (VDW) interaction energy is calculated using the Lennard-Jones potential and parameters given by the CHARMM27 force field. A hydrogen bond is considered to be formed if the donor and acceptor atoms (nitrogen or oxygen) are within 3.0 Å of each other and the donor-hydrogen-acceptor angle is ≥150° (36). A salt bridge between the channel and toxin is considered to be formed if the distance is <4 Å between a side chain oxygen atom from an acidic residue from the channel and a nitrogen atom from a basic residue from the toxin (37).
Results and Discussion
Ion conduction of the Kv1.3 channel
We first ascertain that the open-state homology model we use for the toxin binding studies correctly replicates the experimentally determined conduction properties of the Kv1.3 channel. The current-voltage-concentration profiles of the model channel determined from BD simulations are displayed in Fig. 2. The current-voltage relationship is approximately linear when the applied potential is < ∼100 mV, but deviates from Ohm's law at a higher applied potential. The outward conductance at 100 mV is 15 pS, increasing to ∼19 pS at 150 mV. The inward conductances at the corresponding applied potentials are, respectively, 10 and 13 pS. The current across the channel first increases with an increasing ionic concentration [K] and then saturates, leading to a current-concentration relationship of the Michaelis-Menten form, with the half-maximum concentration of 310 mM. The conductance value we obtain from our simulations (10–20 pS) is close to the value of 14 pS determined experimentally (38). Furthermore, a slow saturation of current with increasing concentration we see is similar to that observed for the Shaker channel (39).
Figure 2.
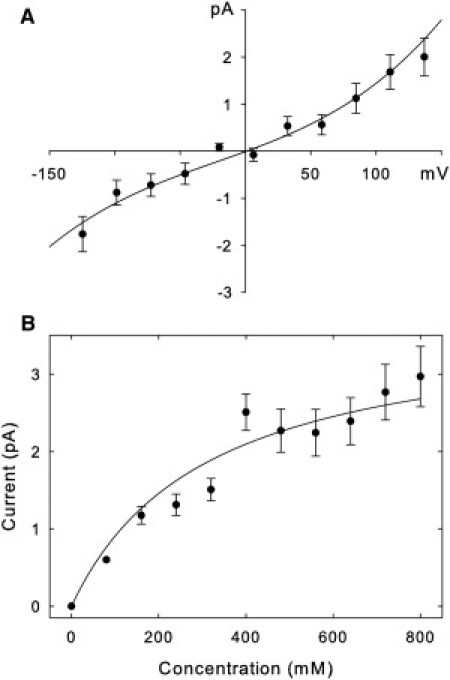
Current-voltage-concentration curves. The upper panel (A) is generated with symmetrical solutions of 320 mM KCl in both reservoirs, whereas the lower panel (B) is generated with an applied potential of 137 mV. The points in B are fitted by the solid line using the Michaelis-Menten equation. Error bars have a length of 1 mean ± SE and are not shown when they are smaller than the data points.
Binding of the toxins to Kv1.3
The bound states of the toxins after molecular docking and 3.5-ns MD simulations are shown in Fig. 3. All of the toxins are observed to lock into the channel selectivity filter through a lysine residue, interacting strongly with the channel selectivity filter, which is lined with 16 negatively charged oxygen atoms. In each case, one water molecule is interposed between the lysine residue and the K+ ion in the S2 binding site of the selectivity filter. Although all three toxins bind tightly to the channel pore through Lys-27 (ChTX and OSK1) or Lys-22 (ShK), they interact differently with the channel peripheral acidic residues Glu-420, Asp-423, and Asp-433. In the case of ChTX, residue Arg-25, separated with Lys-27 by only one residue, interacts strongly with the channel residue Glu-420. The distance between Arg-25 (guanidinium carbon) and Lys-27 (Cα atom) is ∼12 Å. However, the residue Arg-24 of OSK1, separated with Lys-27 by two residues, is observed to form strong electrostatic interactions with Asp-433 of the channel, which is ∼18 Å from the toxin residue Lys-27. The residue Arg-11 of ShK, the distance between which and the Lys-22 of the toxin (∼16 Å) is comparable with that between the residues Arg-24 and Lys-27 of OSK1 (∼15 Å), also interacts strongly with Asp-433 of the channel.
The lysine residue at position 27 (or position 22, 28 in certain other toxins) is conserved across all scorpion toxins. A number of experimental studies have suggested that this lysine residue protrudes into the channel selectivity filter on the toxin binding (5,10,25,26). Our molecular docking and MD simulations are in accord with these findings. All the molecular docking calculations predict that on binding to the Kv1.3 channel the side chain of the Lys-27 of ChTX and OSK1, and Lys-22 of ShK can penetrate into the channel selectivity filter. Subsequent MD simulations based on the bound states of the toxins from molecular docking successfully reproduce the dissociation constants of all three toxins derived experimentally (see below), suggesting that bound states refined by MD simulations are good representations for the toxin binding.
We notice from the bound states that the shortest principal axis of all three toxins is nearly parallel to the channel central axis. In fact, the angle formed by these two axes is 20–30° in all three cases. In this way, the toxins maximize their electrostatic interactions with the peripheral acidic residues of the channel. In contrast, the dipole moment of the toxins forms an angle of 50–70° with the channel central axis. Therefore, our calculations suggest that the principal axis is aligned with the channel permeation pathway on the toxin binding.
Profiles of PMF
To verify if the predicted models realistically represent the binding of the toxins to Kv1.3, the PMF profile for the toxin unbinding is calculated for the three toxins we consider. Fig. 4 A compares the PMF profiles for the unbinding of ChTX from the Kv1.3 channel with and without the PTR. It is evident that the PMF profiles are very similar for the two channel models. The depths of the PMF profiles, which largely determine the value of Kd predicted according to Eq. 1, are almost exactly the same (about −19.5 kT). However, the shapes of the two PMF profiles differ, especially in the region where the toxin is close to the channel, opening the possibility that some long-range interactions between the toxin and the channel PTR may have been ignored by the truncated channel. Nevertheless, given that the toxin does not interact directly with the PTR in the bound state, the similar depths of the PMF profiles we observe suggest that the truncated channel is likely to be a reasonable model of the whole channel for studying the binding of pore blockers.
Figure 4.
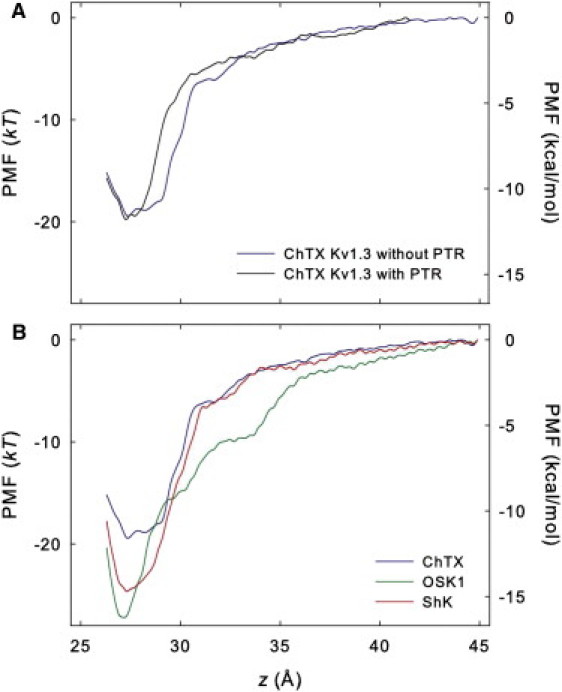
(A) PMF profiles for the unbinding of ChTX from the truncated Kv1.3 channel and the channel with the PTR. (B) PMF profiles for the unbinding of ChTX, OSK1, and ShK from the truncated Kv1.3 channel. The maximum statistical uncertainly is <0.25 kT for all PMF profiles.
Fig. 4 B shows that the PMF reaches a minimum value at z = 27.3 Å for all three toxins (the channel COM is at z = 0 Å). For ChTX, the PMF increases rapidly from −19.4 kT at z = 27 Å to −5.5 kT at z = 32 Å, and then increases more gradually to 0 kT at z = 45 Å. Similarly, the PMF for OSK1 increases rapidly from −27.2 kT at z = 27 Å to −10.0 kT at z = 32 Å, although with a higher magnitude than that of ChTX resulting in a deeper well in the PMF profile (Fig. 4), and then gradually rises to 0 kT at z = 45 Å, which is assumed to be the bulk. The overall shape of the PMF profile for OSK1 is quite different from that for ChTX and ShK. In fact, the interactions between OSK1 and the channel appear to be longer range compared to the other two toxins. At z = 32 Å, OSK1 has a PMF of −10.0 kT, 4.5 kT lower than that of ChTX (−5.5 kT) and ShK (−5.7 kT). We observe a strong attraction between the residues Lys-9 and Arg-12 of OSK1 and Asp-433 of the channel at z = 32 Å, with the distance between the toxin-channel residues decreased from ∼12 Å at the start to 6 Å after 5-ns umbrella sampling. However, the shape of the PMF profile for ShK, −24.7 kT in depth is slightly shallower than that of OSK1, and is very similar to that of ChTX for windows at z > 30 Å, suggesting that the toxin-channel interactions are similar for ChTX and ShK when the toxin is 3 Å or further away from the channel. When close to the channel, ShK interacts with the channel more strongly than ChTX by forming more hydrogen bonds (H-bond) and salt bridges (see below). Here, it is assumed that the properties for the window z = 45 Å are similar to that of the bulk, and therefore the PMF of this window is set to 0 kT. This appears to be a reasonable assumption because the PMF changes by <1 kT between windows z = 42 Å and z = 45 Å for all three toxins.
The dissociation constant Kd is derived from the PMF profile using Eq. 2. The calculated Kd values are 25.3 nM, 0.02 nM, and 0.17 nM for ChTX, OSK1, and ShK, respectively. We note that various factors can contribute to the uncertainty in the predicted Kd values. For example, the quality of the force field and molecular models used and the search of phase space during umbrella sampling largely determine the systematic error, whereas approximating a PMF profile from the umbrella windows can introduce random errors. The Kd values determined experimentally are 0.71–2.6 nM for ChTX (8,38), 0.014 nM for OSK1 (40), and 0.011–0.133 nM for ShK (41,42). Given the uncertainties in experiment, e.g., the experimental Kd values for ShK differ by ∼10-fold (41,42), the agreement between our predictions and experiment is reasonable. In the case of ChTX, the predicted Kd is about one order of magnitude higher than the one derived from experiment. One possible reason is that, it is difficult for MD simulations to sample the dynamics of the salt bridge formed between the residue Arg-25 of ChTX and the residue Glu-420 of the channel, which is observed to form and break during the 3.5-ns equilibration and is formed again after 4.0 ns of the umbrella sampling at z = 27 Å (Fig. 5 A). It appears that this salt bridge is rather unstable and therefore adequate sampling is challenging. Nevertheless, as both forming and breaking of the salt bridge is observed during the umbrella sampling, the predicted PMF is expected to be a reasonable representation for the unbinding of ChTX from Kv1.3.
Channel-toxin interactions
To characterize the interactions between the toxins and the Kv1.3 channel, the trajectories for the umbrella sampling window z = 27.0 Å, corresponding to the minimum of the PMF profile (Fig. 4 B), are analyzed in terms of nonbonded interaction energy, hydrogen bonding, and salt bridge formation. The first 1 ns of the trajectory is considered as equilibration and excluded from the analysis.
Table 1 shows the electrostatic and VDW interaction energies between each toxin and the rest of the system. For all three toxins, the electrostatic interaction energy is about 10times higher than the VDW interaction energy at the toxin bound state. In addition, the electrostatic interaction energies appear to be correlated with the predicted dissociation constants Kd. A lower Kd value corresponds to a lower electrostatic interaction energy. For example, OSK1 has a 10times lower predicted Kd value than that of ShK, and therefore its electrostatic interaction energy is lower by 62 kcal/mol (Table 1). However, we note that interaction energy only takes into account the enthalpic component of free energy, with the entropic component being ignored. The observed correlation between interaction energy and Kd may be due to the entropic contribution to the PMF being similar for the three toxins.
Table 1.
Electrostatic and VDW interaction energy between each toxin and the system at window z = 27 Å
| Toxin | Electrostatic (kcal/mol) | VDW (kcal/mol) | Kd (nM)∗ |
|---|---|---|---|
| ChTX | −1520 ± 64 | −155 ± 12 | 25.3 (18.3, 34.9) |
| OSK1 | −1743 ± 78 | −134 ± 13 | 0.02 (0.01, 0.03) |
| ShK | −1681 ± 73 | −151 ± 13 | 0.17 (0.10, 0.27) |
Standard deviations are given. Each average energy value denotes an ensemble average of 400 frames. Also shown is the dissociation constant Kd derived from the PMF profiles in Fig. 4B.
Numbers in brackets denote 95% coincidence interval.
The most important toxin-channel residue pairs that form H-bonds are shown in Table 2. The average number of hydrogen bonds (MH-bond) is calculated as the summation of the number of H-bonds formed by a residue pair over a trajectory divided by the total number of frames. For ChTX, the stable residue pair is Lys-27-Tyr-447. On average about one H-bond is formed between the residue pair Lys-27-Tyr-447. Another frequent residue pair observed is Arg-25-Asp-433, which forms 0.3 H-bonds on average. A fraction of an H-bond is obtained because the H-bond forms and breaks at times, consistent with previous observations of Yu et al. (9). Two significant residue pairs are also observed for OSK1. The two residue pairs are Lys-27-Tyr-447 and Arg-24-Asp-433. Although the same numbers of residues are identified for OSK1 and ChTX, the residues Lys-27 and Arg-24 of OSK1 are found to form more H-bonds with channel residues than the ones of ChTX. On average, 1.6 and 1.3 H-bonds are formed between residues Lys-27 and Arg-24 of OSK1 and residues Tyr-447 and Asp-433 of the channel, respectively. Here, more than one H-bond is formed by the residue pair Lys-27-Tyr-447 because the toxin lysine residue can form multiple H-bonds with the four tyrosine residues from the four channel subunits simultaneously. Apparently, the residue Lys-27 of OSK1 forms 40% more H-bonds with the channel than that of ChTX, likely due to a slightly shallower penetration of ChTX into the channel selectivity filter. In the case of ShK, the two most important toxin-channel residue pairs that form H-bonds are Arg-11-Asp-433 and Lys-22-Tyr-447. In particular, the residue pair Arg-11-Asp-433 forms 1.8 H-bonds on average, similar to the residue pair Lys-27-Tyr-447 of OSK1. In all cases, the toxin residues are found to act as hydrogen donor. These observations are reflected in the depth of the PMF profiles of the toxins, see Fig. 4 B.
Table 2.
Average number of hydrogen bonds (MH-bond) formed by the key toxin-channel (Kv1.3) residue pairs (window z = 27 Å) and the electrostatic interaction energy (Eie) between the residue pairs
| Toxin | Residue pair | MH-bond | Eie (kcal/mol) |
|---|---|---|---|
| ChTX | K27-Y447 | 1.1 ± 0.7 | −66.1 ± 7 |
| R25-D433 | 0.3 ± 0.5 | −37.4 ± 23 | |
| OSK1 | K27-Y447 | 1.6 ± 0.6 | −73.3 ± 4 |
| R24-D433 | 1.3 ± 0.8 | −78.2 ± 29 | |
| ShK | R11-D433 | 1.8 ± 0.5 | −93.3 ± 6 |
| K22-Y447 | 1.4 ± 0.7 | −70.7 ± 4 |
Standard deviations are given. Each average energy value denotes an ensemble average of 400 frames.
Fig. 5 A shows the length of the salt bridges formed between each of the three toxins and the channel as a function of the simulation time. For ChTX, one salt bridge is formed between Arg-25 of the toxin and Glu-420 of the channel. However, this salt bridge is observed to form and break during the 3.5-ns equilibration, and remains unstable during the umbrella sampling as reflected in its length. Note, no significant H-bond is observed between the residue pair Arg-25-Glu-420 due to the short life time of the salt bridge. For OSK1, one salt bridge is also formed between Arg-24 of the toxin and Asp-433 of the channel. In contrast to Arg-25 of ChTX, which only forms a salt bridge with the channel residue Glu-420, Arg-24 of OSK1 also forms strong H-bonds with the channel residue Asp-433 as described previously (Table 2). In addition, the salt bridge formed by OSK1 is significantly more stable than that of ChTX, as the length of the salt bridge fluctuates minimally with the simulation time (Fig. 5 A). Similar to OSK1, the residue Arg-11 of ShK that forms H-bonds with the Asp-433 of the channel also forms a stable salt bridge with this channel residue. In addition, residue Arg-1 of ShK forms a second salt bridge with the channel residue Asp-423, whose length fluctuates greatly with time.
Analysis of the toxin-channel interactions shown above reveals that the toxins bind to the channel primarily via two basic residues, one lysine and one arginine. The lysine residue is Lys-27 (or Lys-22 for ShK), which interacts strongly with the channel selectivity filter, in particular, forms H-bonds with the channel residue Tyr-447. In the case of ChTX, Lys-27 forms only about one H-bond with Tyr-447, while the Lys-27 of OSK1 and Lys-22 of ShK form ∼1.5 H-bonds (Table 2). The arginine residue is Arg-25 for ChTX, Arg-24 for OSK1, and Arg-11 for ShK. All of these three arginine residues form salt bridges and H-bonds with glutamate or aspartate residues of the channel (Fig. 5). However, the arginine residues of OSK1 (Arg-24) and ShK (Arg-11) form significantly more H-bonds with the channel residue Asp-433 than the Arg-25 of ChTX (Table 2). Therefore, our calculations suggest that ChTX has a lower binding affinity to Kv1.3 because it forms fewer H-bonds and weaker salt bridges with the channel. In the case of ShK, the predicted binding affinity is slightly lower than that of OSK1. This could be due to the weaker long-range electrostatic interactions between the toxin and channel by ShK, as reflected in the PMF profiles (Fig. 4 B). For example, the PMF of OSK1 at z = 32 Å (−10.0 kT), where the channel and toxin are separated by 5 Å, is 4.3 kT lower than that of ShK (−5.7 kT). In addition, the overall charge of OSK1 is +8 e, whereas ShK has a net charge of +7 e. Of course, the slightly shallower PMF profile of ShK than that of OSK1 observed could as well be due to the statistical errors in the PMF profiles.
Structural flexibility of the toxins
To measure the flexibility of the toxins, the average RMSD value of the toxin backbone as well as side-chain atoms with respect to the starting structure is calculated for each umbrella window. Fig. 5 B shows that the average RMSD values for the backbone atoms are in the range of 1.0–2.0 Å for a majority of the windows, suggesting that the backbones of the toxins are stable in our umbrella sampling simulations. This is expected because all three toxins have three disulfide bonds that stabilize their overall structure. In fact, we find that without the disulfide bonds the RMSD values for the backbone atoms of ShK can be as large as 3.5 Å. The backbone RMSD values for the three toxins are comparable with the values for ChTX reported by Chen and Kuyucak (34), who investigated the unbinding of ChTX from the KcsA channel with restraints on the toxin.
The RMSD values of the side chains are significantly higher than that of the backbone atoms. In a majority of the windows, the side-chain RMSD values are in the range of 2.0–4.0 Å (Fig. 5 B). In addition, the RMSD values increase with the toxin-channel distance, suggesting that the degrees of freedom for the toxin side chains are reduced on toxin binding. No significant difference in the RMSD values for the three toxins is evident.
Conclusions
The current-voltage-concentration profiles of the homology model of the Kv1.3 channel we constructed, when tested with stochastic dynamics simulations, closely mirror those determined experimentally. The close match between the experimental and simulated results suggests that the homology model used here is likely to be a good approximation of the Kv1.3 channel. We then consider three potent blockers of the voltage-gated Kv channels and examine how they interact with the channel protein. The dissociation constants Kd calculated from the PMF profiles are broadly in accord with those measured experimentally. The largest discrepancy we found is with charybdotoxin, for which the measured and computed Kd values differ by an order of magnitude (25 nM vs. 0.7–2.6 nM). For the other two toxins we studied, the experimentally determined dissociation constants are reliably replicated with the computed PMF profiles. We note here that various interaction energies such as the one between the toxin and the channel protein taken from snapshots of bound complexes are poor indicators of the binding affinities, although they are broadly correlated with the relative potencies of various toxins.
We show here that the use of a molecular docking method followed by MD calculations of PMF can in theory predict the dissociation constants of a toxin with a fair degree of accuracy. However, these approaches cannot be routinely employed to search for lead candidates of channel blockers from large numbers of available compounds, because of prohibitively high computational costs. Typically, it takes between 50,000 and 75,000 CPU hours of a modern supercomputer to construct a PMF of one toxin. It will be thus desirable to construct efficient and fast molecular docking methods or stochastic dynamics algorithms that can accurately predict binding affinities of any potential pharmaceutical compounds. Although none of the currently available semimicroscopic computational tools are at a stage to replace MD simulations, the advent of such a technique will be needed to render computational and theoretical approaches useful for the design of modern drugs targeting biological ion channels. The degree of accuracy with which we predicted the Kd values of the three toxins we studied may serve as a benchmark in devising a new, rapid, efficient computational methodology.
Acknowledgments
Molecular graphics are generated using VMD (43). The calculations upon which this work is based were carried out using a SGI Altix 3700 system of the Australian National University Supercomputer Facility.
This work is supported by grants from the National Health and Medical Research Council and the Medical Advances Without Animals Trust.
Supporting Material
References
- 1.Chandy K.G., Wulff H., Cahalan M.D. K+ channels as targets for specific immunomodulation. Trends Pharmacol. Sci. 2004;25:280–289. doi: 10.1016/j.tips.2004.03.010. [DOI] [PMC free article] [PubMed] [Google Scholar]
- 2.Wulff H., Pennington M. Targeting effector memory T-cells with Kv1.3 blockers. Curr. Opin. Drug Discov. Devel. 2007;10:438–445. [PubMed] [Google Scholar]
- 3.Wulff H., Calabresi P.A., Chandy K.G. The voltage-gated Kv1.3 K+ channel in effector memory T cells as new target for MS. J. Clin. Invest. 2003;111:1703–1713. doi: 10.1172/JCI16921. [DOI] [PMC free article] [PubMed] [Google Scholar]
- 4.Beeton C., Wulff H., Béraud E. Selective blockade of T lymphocyte K+ channels ameliorates experimental autoimmune encephalomyelitis, a model for multiple sclerosis. Proc. Natl. Acad. Sci. USA. 2001;98:13942–13947. doi: 10.1073/pnas.241497298. [DOI] [PMC free article] [PubMed] [Google Scholar]
- 5.Park C.S., Miller C. Interaction of charybdotoxin with permeant ions inside the pore of a K+ channel. Neuron. 1992;9:307–313. doi: 10.1016/0896-6273(92)90169-e. [DOI] [PubMed] [Google Scholar]
- 6.Park C.S., Miller C. Mapping function to structure in a channel-blocking peptide: electrostatic mutants of charybdotoxin. Biochemistry. 1992;31:7749–7755. doi: 10.1021/bi00149a002. [DOI] [PubMed] [Google Scholar]
- 7.Goldstein S.A., Miller C. Mechanism of charybdotoxin block of a voltage-gated K+ channel. Biophys. J. 1993;65:1613–1619. doi: 10.1016/S0006-3495(93)81200-1. [DOI] [PMC free article] [PubMed] [Google Scholar]
- 8.Aiyar J., Withka J.M., Chandy K.G. Topology of the pore-region of a K+ channel revealed by the NMR-derived structures of scorpion toxins. Neuron. 1995;15:1169–1181. doi: 10.1016/0896-6273(95)90104-3. [DOI] [PubMed] [Google Scholar]
- 9.Yu K., Fu W., Jiang H. Computational simulations of interactions of scorpion toxins with the voltage-gated potassium ion channel. Biophys. J. 2004;86:3542–3555. doi: 10.1529/biophysj.103.039461. [DOI] [PMC free article] [PubMed] [Google Scholar]
- 10.Yu L., Sun C., Olejniczak E.T. Nuclear magnetic resonance structural studies of a potassium channel-charybdotoxin complex. Biochemistry. 2005;44:15834–15841. doi: 10.1021/bi051656d. [DOI] [PubMed] [Google Scholar]
- 11.Chung S.H., Allen T.W., Kuyucak S. Conducting-state properties of the KcsA potassium channel from molecular and Brownian dynamics simulations. Biophys. J. 2002;82:628–645. doi: 10.1016/S0006-3495(02)75427-1. [DOI] [PMC free article] [PubMed] [Google Scholar]
- 12.Altschul S.F., Madden T.L., Lipman D.J. Gapped BLAST and PSI-BLAST: a new generation of protein database search programs. Nucleic Acids Res. 1997;25:3389–3402. doi: 10.1093/nar/25.17.3389. [DOI] [PMC free article] [PubMed] [Google Scholar]
- 13.Long S.B., Campbell E.B., Mackinnon R. Crystal structure of a mammalian voltage-dependent Shaker family K+ channel. Science. 2005;309:897–903. doi: 10.1126/science.1116269. [DOI] [PubMed] [Google Scholar]
- 14.Chen X., Wang Q., Ma J. Structure of the full-length Shaker potassium channel Kv1.2 by normal-mode-based x-ray crystallographic refinement. Proc. Natl. Acad. Sci. USA. 2010;107:11352–11357. doi: 10.1073/pnas.1000142107. [DOI] [PMC free article] [PubMed] [Google Scholar]
- 15.Guex N., Peitsch M.C. SWISS-MODEL and the Swiss-PdbViewer: an environment for comparative protein modeling. Electrophoresis. 1997;18:2714–2723. doi: 10.1002/elps.1150181505. [DOI] [PubMed] [Google Scholar]
- 16.Schwede T., Kopp J., Peitsch M.C. SWISS-MODEL: an automated protein homology-modeling server. Nucleic Acids Res. 2003;31:3381–3385. doi: 10.1093/nar/gkg520. [DOI] [PMC free article] [PubMed] [Google Scholar]
- 17.Arnold K., Bordoli L., Schwede T. The SWISS-MODEL workspace: a web-based environment for protein structure homology modelling. Bioinformatics. 2006;22:195–201. doi: 10.1093/bioinformatics/bti770. [DOI] [PubMed] [Google Scholar]
- 18.Chen P.C., Kuyucak S. Mechanism and energetics of charybdotoxin unbinding from a potassium channel from molecular dynamics simulations. Biophys. J. 2009;96:2577–2588. doi: 10.1016/j.bpj.2008.12.3952. [DOI] [PMC free article] [PubMed] [Google Scholar]
- 19.Baştuğ T., Kuyucak S. Comparative study of the energetics of ion permeation in Kv1.2 and KcsA potassium channels. Biophys. J. 2011;100:629–636. doi: 10.1016/j.bpj.2010.12.3718. [DOI] [PMC free article] [PubMed] [Google Scholar]
- 20.Khalili-Araghi F., Tajkhorshid E., Schulten K. Dynamics of K+ ion conduction through Kv1.2. Biophys. J. 2006;91:L72–L74. doi: 10.1529/biophysj.106.091926. [DOI] [PMC free article] [PubMed] [Google Scholar]
- 21.Chung S.H., Allen T.W., Kuyucak S. Modeling diverse range of potassium channels with Brownian dynamics. Biophys. J. 2002;83:263–277. doi: 10.1016/S0006-3495(02)75167-9. [DOI] [PMC free article] [PubMed] [Google Scholar]
- 22.Mintseris J., Pierce B., Weng Z. Integrating statistical pair potentials into protein complex prediction. Proteins. 2007;69:511–520. doi: 10.1002/prot.21502. [DOI] [PubMed] [Google Scholar]
- 23.Jaravine V.A., Nolde D.E., Arseniev A.S. Three-dimensional structure of toxin OSK1 from Orthochirus scrobiculosus scorpion venom. Biochemistry. 1997;36:1223–1232. doi: 10.1021/bi9614390. [DOI] [PubMed] [Google Scholar]
- 24.Tudor J.E., Pallaghy P.K., Norton R.S. Solution structure of ShK toxin, a novel potassium channel inhibitor from a sea anemone. Nat. Struct. Biol. 1996;3:317–320. doi: 10.1038/nsb0496-317. [DOI] [PubMed] [Google Scholar]
- 25.Lange A., Giller K., Baldus M. Toxin-induced conformational changes in a potassium channel revealed by solid-state NMR. Nature. 2006;440:959–962. doi: 10.1038/nature04649. [DOI] [PubMed] [Google Scholar]
- 26.Lanigan M.D., Kalman K., Norton R.S. Mutating a critical lysine in ShK toxin alters its binding configuration in the pore-vestibule region of the voltage-gated potassium channel, Kv1.3. Biochemistry. 2002;41:11963–11971. doi: 10.1021/bi026400b. [DOI] [PubMed] [Google Scholar]
- 27.Phillips J.C., Braun R., Schulten K. Scalable molecular dynamics with NAMD. J. Comput. Chem. 2005;26:1781–1802. doi: 10.1002/jcc.20289. [DOI] [PMC free article] [PubMed] [Google Scholar]
- 28.Feller S.E., MacKerell A.D. An improved empirical potential energy function for molecular simulations of phospholipids. J. Phys. Chem. B. 2000;104:7510–7515. [Google Scholar]
- 29.MacKerell A.D., Bashford D., Karplus M. All-atom empirical potential for molecular modeling and dynamics studies of proteins. J. Phys. Chem. B. 1998;102:3586–3616. doi: 10.1021/jp973084f. [DOI] [PubMed] [Google Scholar]
- 30.Jorgensen W.L., Chandrasekhar J., Klein M.L. Comparison of simple potential functions for simulating liquid water. J. Chem. Phys. 1982;79:926–935. [Google Scholar]
- 31.Ryckaert J.P., Ciccotti G., Berendsen H.J.C. Numerical integration of the cartesian equations of motion of a system with constraints: molecular dynamics of n-alkanes. J. Comput. Phys. 1977;23:327–341. [Google Scholar]
- 32.Miyamoto S., Kollman P.A. SETTLE: An analytical version of the SHAKE and RATTLE algorithm for rigid water models. J. Comput. Chem. 1992;13:952–962. [Google Scholar]
- 33.Martyna G.J., Tobias D.J., Klein M.L. Constant pressure molecular dynamics algorithms. J. Chem. Phys. 1994;101:4177–4189. [Google Scholar]
- 34.Chen P.C., Kuyucak S. Accurate determination of the binding free energy for KcsA-charybdotoxin complex from the potential of mean force calculations with restraints. Biophys. J. 2011;100:2466–2474. doi: 10.1016/j.bpj.2011.03.052. [DOI] [PMC free article] [PubMed] [Google Scholar]
- 35.Kumar S., Bouzida D., Rosenberg J.M. The weighted histogram analysis method for free-energy calculations on biomolecules. I. The method. J. Comput. Chem. 1992;13:1011–1021. [Google Scholar]
- 36.Mills J.E., Dean P.M. Three-dimensional hydrogen-bond geometry and probability information from a crystal survey. J. Comput. Aided Mol. Des. 1996;10:607–622. doi: 10.1007/BF00134183. [DOI] [PubMed] [Google Scholar]
- 37.Kumar S., Nussinov R. Close-range electrostatic interactions in proteins. ChemBioChem. 2002;3:604–617. doi: 10.1002/1439-7633(20020703)3:7<604::AID-CBIC604>3.0.CO;2-X. [DOI] [PubMed] [Google Scholar]
- 38.Grissmer S., Nguyen A.N., Chandy K.G. Pharmacological characterization of five cloned voltage-gated K+ channels, types Kv1.1, 1.2, 1.3, 1.5, and 3.1, stably expressed in mammalian cell lines. Mol. Pharmacol. 1994;45:1227–1234. [PubMed] [Google Scholar]
- 39.Heginbotham L., MacKinnon R. Conduction properties of the cloned Shaker K+ channel. Biophys. J. 1993;65:2089–2096. doi: 10.1016/S0006-3495(93)81244-X. [DOI] [PMC free article] [PubMed] [Google Scholar]
- 40.Mouhat S., Teodorescu G., Sabatier J.M. Pharmacological profiling of Orthochirus scrobiculosus toxin 1 analogs with a trimmed N-terminal domain. Mol. Pharmacol. 2006;69:354–362. doi: 10.1124/mol.105.017210. [DOI] [PubMed] [Google Scholar]
- 41.Kalman K., Pennington M.W., Chandy K.G. ShK-Dap22, a potent Kv1.3-specific immunosuppressive polypeptide. J. Biol. Chem. 1998;273:32697–32707. doi: 10.1074/jbc.273.49.32697. [DOI] [PubMed] [Google Scholar]
- 42.Pennington M.W., Byrnes M.E., Zaydenberg I., Khaytin I., de Chastonay J., Krafte D.S., Hill R., Mahnir V.M., Volberg W.A., Gorczyca W. Chemical synthesis and characterization of ShK toxin: a potent potassium channel inhibitor from a sea anemone. Int. J. Pept. Protein Res. 1995;46:354–358. doi: 10.1111/j.1399-3011.1995.tb01068.x. [DOI] [PubMed] [Google Scholar]
- 43.Humphrey W., Dalke A., Schulten K. VMD: visual molecular dynamics. J. Mol. Graph. 1996;14:33–38. doi: 10.1016/0263-7855(96)00018-5. 27–28. [DOI] [PubMed] [Google Scholar]
Associated Data
This section collects any data citations, data availability statements, or supplementary materials included in this article.