

Abstract
The ability to form gigaseals is essential for patch-clamp electrophysiology; however, ion channels located in the seal can produce measureable currents. To explore the expected properties of channels in the seal (i.e., rim channels), we created a mathematical model. The seal was a two-dimensional cable filled with saline and bounded on one side by membrane (with resistance and capacitance) and on the other side by glass (nonconductive and noncapacitive). We included ion depletion/accumulation around the channels. The channels were ohmic with a conductance that increased with the concentration of permeant ions. The aqueous seal thickness was set nominally to 1 nm. Imaging with fluorescent dyes in the pipette showed that the hydrophilic dye Alexa 488 is impermeant, but lipophilic FM1-43 labels the seal. The model showed that to obtain high-resistance seals, the conductivity of the seal media has to be <10% that of the bath. Stimulus voltages decreased with distance down the seal. In agreement with results in the literature, channels in the seal can produce currents similar to those in the pipette-spanning dome. The transition times of currents are slower due to membrane capacitance. If channel densities are uniform, patch currents are dominated by channels in the dome.
Introduction
The ability to form gigohm (GΩ) seals led to the utility of the patch clamp (1,2). It remains to be determined why seals form, and their physical and chemical properties are not well known, but it is known that the seal properties can affect ion channel recordings. Ion channels in the seal are activatable but have altered conductance and kinetics (3), and these effects are not readily apparent from patch-clamp data. To better understand how the microenvironment of the seal affects recorded channel currents (4), we built a mathematical model of a seal containing channels, and computed single-channel and many-channel currents.
To clarify our use of the nomenclature, we first want to establish some definitions. We divide the patch into two regions: 1), the dome, representing the traditional pipette-spanning membrane; and 2), the seal, where the membrane adheres to the glass (Fig. 1). The seal is a distributed bond extending over a length of microns. To make our model correspond well to the experimental situation, we only examined models in which the seal resistance was >10 GΩ. Note that the term “seal resistance” as used in the literature refers to the resistance of a pipette with a patch in place. However, that resistance is actually the resistance of the dome in parallel with the seal. The only independent measure of the two components obtained to date (5) showed them to be comparable in magnitude.
Figure 1.
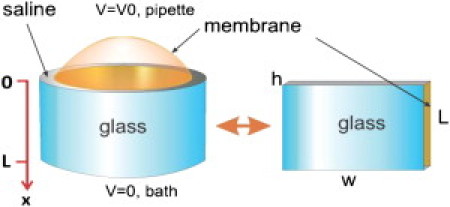
Physical model of the patch. At the left the patch is seen in a cylindrical glass pipette and consists of the dome that spans the pipette and the seal region where the membrane sticks to the glass. The seal region is modeled as a cylindrical annulus (radius = 1 μm, length L = 10 μm) where the central domain is a conducting media of thickness h = 1 nm (typically) that is bounded by glass on one side and plasma membrane on the other. This forms a 2D electrical cable. We simplified the geometry by unfolding it into a rectangle of width w = 2πrg as shown at the right, where rg is the radius of the glass pipette.
The seal resistance is sensitive to the ionic strength of the bathing solutions, which implies that mobile salts can penetrate the seal. Patches creep slowly along the glass driven by electroosmosis, and this creep rate is sensitive to the pipette potential and the cationic bathing ions (3). Thus, the seal contains mobile ions and is cation-selective, as expected for a negatively charged space (i.e., the glass and the membrane). The simplest physical model of the seal as a saline annulus predicts that we would need a seal thickness of atomic dimensions to obtain seals >10 GΩ (2). However, we know that we can form gigaseals from membranes containing large proteins, such as acetylcholine receptors, that protrude 5 nm above the bilayer (6). To fill in the spaces around protruding irregular proteins with high resistance material would seem to require some form of resistive “caulking”.
Given that we can readily make GΩ seals, what are the physical properties of the seal solution and the membrane that might affect the patch-clamp data? To learn more about these factors, we created a numerical model that incorporates many of the known properties of membranes, aqueous solutions, and ion channels. This continuum model is defined by partial differential equations for the diffusion of charge and mass, and for simplicity does not attempt to deal with molecular structures. The patch clamp records the sum of two currents: currents through the seal and currents through the dome. We treated the dome as an isopotential surface and defined the channel properties as they would appear in the dome. However, channels in the seal have a significant access impedance, which has multiple effects on the data. For example, it decreases the applied voltage amplitude and increases the rise time, and decreases the open-channel current and increases the transition times. For voltage-dependent channels in the seal, the gating curve will have a lower slope and a reduced midpoint. The effect of the seal on channel amplitude stems not only from the reduction in driving force but also from the supply of charge from two dimensions instead of one. The amplifier only sees the component of current parallel to the axis of the pipette.
Model
To be useful, models need to minimize the number of parameters. Our model focused on the properties of the seal as represented by a two-dimensional (2D) cable bounded on one side by membrane and on the other side by glass, and filled with an aqueous solution. The membrane had a specific conductivity and capacitance, whereas the glass had no conductance or capacitance (glass is much thicker than membrane and has a lower conductance). The model is that of an inside-out patch. We simplified the geometry by treating the pipette as a rectangular cylinder and then unfolded the annular seal into a plane (Fig. 1). We ignored gradients in the radial dimension h because the seal was so thin with respect to its linear dimensions. The partial differential equations describing the physics were the 2D cable equation and mass diffusion of the permeant ions in the seal. Ion channels were placed at different depths in the seal and were driven by the electrochemical potential (7) with a conductance that was proportional to the permeant ion concentration at the source side. Single-channel currents were modeled as steps of permeability, with the channels introduced as small circular sources. We solved the equations using finite element algorithms in COMSOL Multiphysics (v4.2). Table 1 shows parameters used for finite element analysis.
Table 1.
Dimensions and electrical and chemical parameters used for FEA
| L | Length of seal | Ad | Area of patch dome |
| rg | Pipette radius | rd | Radius of patch dome |
| w | Perimeter of seal | λ | Length constant |
| h | Thickness of seal | x | Channel depth |
| σs | Conductivity of saline in seal | V0 | Applied potential at top of seal |
| σm | Membrane conductivity | Vr | Reversal potential |
| Cm | Membrane capacitance | C0 | Saline concentration in seal |
| τ | Time constant of membrane | Icon | Single-channel currents without diffusion |
| Ip | Pipette current | Idiff | Single-channel currents with diffusion |
| Rs | Seal resistance | Iseal | Current arising from channels in the seal |
| g0 | Single-channel conductance | Idome | Current arising from channels in the dome |
Methods
To reduce the number of free parameters, we applied the following constraints: the seal resistance had to be 10GΩ (or some other number we specified). Second, we assumed the length of the seal to be L = 10 μm based on observations previously obtained by light and electron microscopy (3). The internal radius of the pipette was rg = 1 μm. The thickness of the aqueous portion of the seal, h, had to be larger than the mobile ions and small enough to exclude Alexa 488, and we arbitrarily set h = 1 nm for most calculations (unless otherwise noted). This model assumes that the seal space is of uniform thickness (unlikely) and homogeneous because we found that diffusion of FM1-43 was quite uniform (Fig. S1 in the Supporting Material), suggesting no discrete spatial changes in the physical properties of the membrane. We arbitrarily chose the salt solution to have the conductivity of a 100 mM KCl solution, which is commonly used as a conductivity reference and is similar in concentration to physiological salines. However, we did allow the conductivity in the seal to decrease, as might result from the binding of mobile charges or increases in local viscosity.
For an overview of the issues, we first present the analytical solution for the steady-state voltage gradients in the seal. We then introduce ion channels located at different distances x from the dome and use 2D finite element analysis (FEA) integration to calculate the current that would be seen by the patch amplifier. The observed current is calculated from the normal component of the voltage gradient at the top of the seal.
Analytical solution
As shown in Fig. 1, the core of the seal is a conducting layer of saline of thickness h with a volume conductivity of σs and length L. This domain is bounded on one side by the membrane with specific capacitance Cm and specific conductance σm. The dome has a radius of curvature of rd, and Ad is dome area. An electrical potential V0 is applied to the pipette (V(x = 0) = V0) and the lower end of the seal is grounded in the bath, V(L) = 0. The potential at position x in the seal is V(x) and radially symmetric. We now solve for V(x) and estimate the observed seal resistance (i.e., the resistance of the seal in parallel with the dome). The pipette current is
| (1) |
where is the length constant of the seal. To obtain numerical values, we need λ, which requires knowledge of the relationship between σs and σm. In patches, σm is unknown, but we will assume that the membrane capacitance is Cm = 1 μF/cm2 =10 fF/μm2 and that the intrinsic membrane time constant is in the range of 1–1000 ms.
Using Eq. 1 and the defined parameters of our model, we can write the seal resistance (Rs) as
| (2) |
From Eq. 2, we can estimate σs by using σm with the constraint Rs = 10 GΩ. Because τ = Cm/σm and , the seal resistance (Rs) can be rewritten as
| (3) |
This shows that the thinner the seal (smaller h) and the lower the membrane conductance (larger τ), the larger is the seal resistance. Representative plots are shown in Fig. 2.
Figure 2.
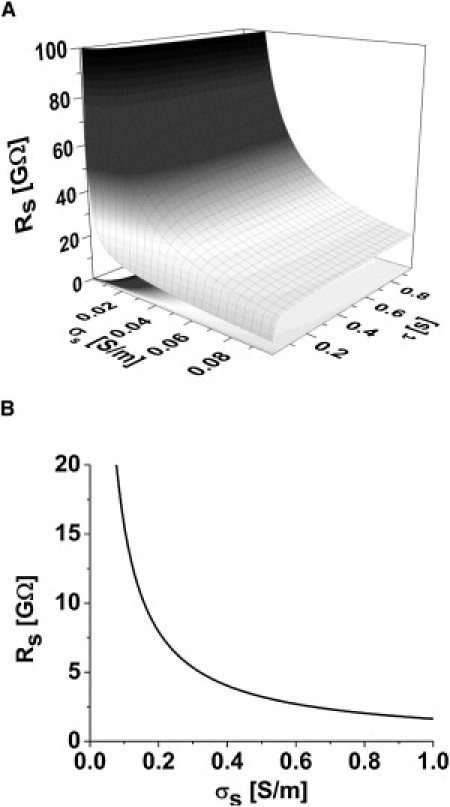
(A) Seal resistance Rs as a function of conductivity of the space σs and the membrane time constant τ; a long time constant corresponds to a high membrane resistance. (B) A typical relationship of seal resistance as a function of σs (τ = 0.5 s). Note that it is not possible to get high-resistance seals (>10 GΩ) unless the conductivity of media in the space is ≪ that of 100 mM KCl (1.12 S/m), implying the space viscosity is ≫ water or that the ion activity is ≪ 100 mM.
Numerical solutions for single channels
Channels can be located at any depth in the seal (3). To calculate the channel currents, we solved the cable equation in two dimensions with the channels as small circular sources. The single-channel current was given by
| (4) |
where the single-channel conductance g(C(x,y)) = g0 × C(x,y)/Co, is a function of the local concentration of permeant ions (for most simulations, we chose g0 to give channel currents of 1 or 10 pA at 100 mV), and P(V,t) is the probability of the channel being open at transmembrane potential V. For most single-channel simulations, P was a square pulse of permeability (the channel went from closed to open to closed). To model voltage-dependent channels, we used the Hodgkin and Huxley equations for P(V,t) (7). The electrical driving force is V(x,y) − Vr, and this implicitly includes effects of ion accumulation and depletion that change Vr. The reversal potential Vr is given by the Nernst equation for the permeant ion. The boundary values for voltage are zero at the top (x = 0, the amplifier) and V0 at the bottom (x = L, the bath). The ion concentration at the dome and the bath is Cbath (100 mM), and
| (5) |
We performed all of the simulations with the constraint that Rs = 10 GΩ at rest by adjusting σs.
We first examined the steady-state current in the absence of ion accumulation and depletion. This current is given by the integral of the normal component of current density J as it leaves the seal: J = σs∇V at x = 0. To examine transient effects on the single-channel currents, we made g into a step function. To determine the role of channel conductivity relative to access resistance on the observed currents, we modeled channels with a 10-fold variation of go (1 and 10 pA/channel at 100 mV). Mass diffusion at the channel was obtained from the current density via the Faraday constant. To examine the effects of ion accumulation and depletion, we included mass diffusion equations, and for that we needed a diffusion constant D. Allowing the viscosity of the space to be higher than the bath, we used the Nernst-Einstein equation to calculate D.
To simulate the effect of seal impedance on a voltage-dependent channel, we used a Hodgkin-Huxley potassium channel (7), where the channel conductance is given by
| (6) |
The gating variable n is dependent on the membrane voltage:
| (7) |
where α(V) and β(V) are given by (8):
| (8) |
| (9) |
To control channel gating, we set a holding potential of −77 mV and applied a ladder of 20 ms depolarizing pulses. We corrected for background current through the seal by subtracting currents observed with g = 0.
With a high density of channels (λ ≪ L), we used a 1D cable equation with a membrane conductivity σm emulating Hodgkin-Huxley potassium currents. To compare currents from the dome with those of the seal, we assumed that the channels were uniformly distributed in both the seal and the dome. However, we note that microscopy of patches shows that channel uniformity is not typical (3).
Results
Analytical solution
We first investigated how the seal resistance varies as a function of the seal dimensions, core media conductivity, and membrane conductance. Fig. 2 shows the seal resistance for h = 1 nm. As expected, Rs had a strong dependence on h but it showed a weak dependence on σs. The latter effect was noticeable only with small values of σsh. We found that it was not possible to obtain high-resistance seals unless the conductivity of the media in the space was ≪ that of 100 mM KCl (1.12 S/m). This could occur because mobile ions in the seal are bound to the extracellular surface of the membrane and the glass, or the viscosity of media in the seal is ≫ water, as might be expected from compression of the extracellular matrix against the glass.
As a check on the assumed geometry of the seal, we tested whether the seal could transport the dye Alexa 488 from the pipette to the bath. Alexa 488 is water-soluble and ∼0.9 nm in diameter (9). Images of patches showed that the dye was excluded from the seal (see Fig. S1 A). We also know that NMDA with a diameter of <0.5 nm is weakly permeable (3), so it is reasonable to have h = 0.5–0.9 nm. To test the continuity of the lipid portion of the seal, and check that we had the sensitivity to observe the dyes in the seal, we applied the lipid-soluble dye FM1-43 in the pipette as we did with Alexa 488. FM1-43 illuminated the whole seal with a linear gradient (Fig. S1 B), suggesting that the lipids remained liquid in the seal, allowing the dye to diffuse, and there were no abrupt changes in the physical properties of those lipids down the seal. If Alexa 488 were permeant in the seal, we should have seen it because the membrane thickness is comparable to h.
Single-channel currents from the seal
Fig. 3, A–C, show how single-channel currents decrease as the channels are moved farther down the seal. We modeled four scenarios (Fig. 3 A) to determine the dependence on seal conductance and thickness. For a 10 GΩ seal of 1 nm thickness, the amplitudes are large enough that they can be confused with dome channels and labeled subconductance states or even different channel species (3). A 1 pA channel in the dome will contribute 0.67 pA when it is 1 μm down the seal and obviously more when it is nearer the dome. Changing the seal thickness to 0.5 nm from 1.0 nm had only a minor effect on the channel current. However, changing the seal resistance to 100 GΩ decreased the channel current to only ∼25% at as little as 0.1 μm seal depth, showing that the model is very sensitive to conductivity of the seal. Again at 100 GΩ, the seal thickness change to 0.5 nm had little effect. Higher-conductance channels will contribute less current because the access resistance has a larger effect (Fig. 3 B). With a 10 pA dome channel, the same channel positioned 1 μm down from the dome generates 4.1 pA in the amplifier.
Figure 3.
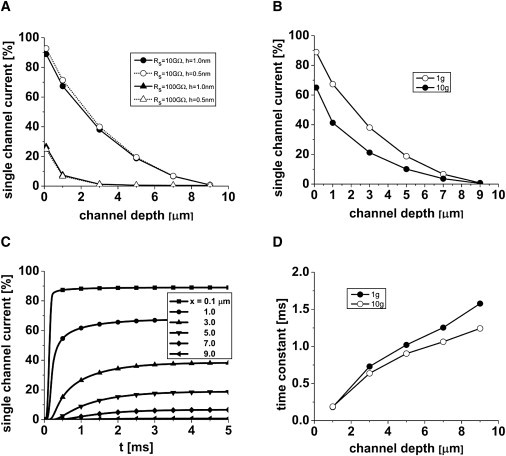
Single-channel currents in the seal as a function of channel depth. We calculated the percentage currents by dividing the observed current by that seen for a channel in the dome. (A) Effects of seal thickness (h = 0.5 or 1.0 nm) and seal resistance (Rs = 10 or 100 GΩ) on observed currents. (B) The dependence of observed current amplitudes with different intrinsic channel conductance. (C) Membrane capacitance slows the transition time of channels (the low-conductance 1g channel). (D) Transition times as a function of channel depth. (For simplicity, the response was fit to a single exponential; however, the actual response is more like an error function due to the cable properties.)
The previous calculations were for steady state; however, membrane capacitance will slow the time course of the channel currents in the seal. To examine the magnitude of these effects, we made g(t) a step function. Fig. 3 D plots the time course of the predicted amplifier current as a function of x for 1 and 10× go. The transition times of the channel current increased with depth, as expected from capacitive loading. The rise time varied inversely with the channel conductance due to the lower-voltage gradients. This result shows that rim-channel recordings will exhibit fewer short-lived states. However, the correlated reduction in amplitude and the increase in rise time could be exploited to estimate the channel position in the seal (8). If the channel density is uniform between the dome and the seal, as is generally assumed (but is known to not be true in general (3)), the currents from the dome will dominate and create a reliable recording. However, if there is a significant contribution from rim channels, the amplitude histograms will be broader and more asymmetric, and the lifetimes will be longer.
The above calculations were done with the mass diffusion equations turned off; below, we explore the effect of diffusion.
Accumulation and depletion in the seal
Because the seal space h is narrow, the flux of ions through a channel will cause changes in the local ion concentration with commensurate changes in the local conductivity and reversal potential. To explore the magnitude of this effect, we added the diffusion equation. Fig. 4, A and B, show a typical field plot of the membrane voltage and the permeant ion concentration, respectively. Fig. 4 C shows the observed current from a square pulse of channel conductance with no depletion (Icon, dashed line) superimposed on the current with diffusion (Idiff, solid line). At x = 1 μm, ion depletion has a small effect, reducing the current by only 6.4% so that accumulation/depletion in the seal is not significant (Fig. 4 D). Comparing these results with those of Fig. 4 C, we can see the dominant effect of the voltage gradient that caused a decrease of 89-fold in the current as the channel moved from 1 μm to 9 μm.
Figure 4.
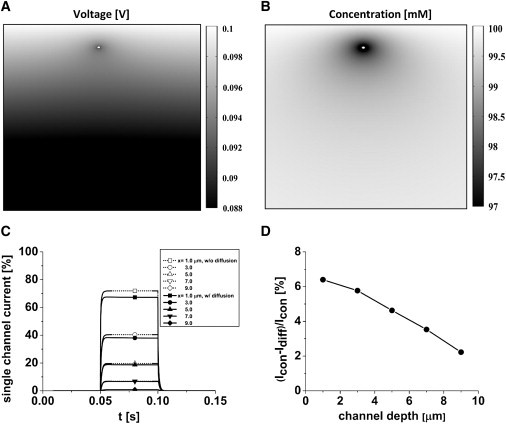
Diffusion effects on the single-channel current. Field plots of (A) voltage and (B) concentration (Co = 100 mM) near a channel 0.2 μm below the dome. (C) Accumulation/depletion in the seal is not a large effect. Single-channel currents with diffusion (Idiff, solid lines) and without diffusion (Icon, dashed line) at different depths. (D) Percentage reduction of current by including mass diffusion as a function of channel location in the seal.
Seal and dome currents in multichannel patches
When channels are in high density (λ ≪ L), we observe the current averaged over all channel locations, and we can use the 1D cable equation for the seal. Fig. 5 A shows the predicted mean current from K channels in the seal (Iseal) for a series of voltage steps, and Fig. 5 B shows the mean current for channels in the dome (Idome, assumed to be a planar disk). The dome currents are much larger than the seal currents because they do not have the access resistance of the seal. Thus, for uniformly distributed channels, the patch clamp provides a reliable recording of the mean channel current.
Figure 5.
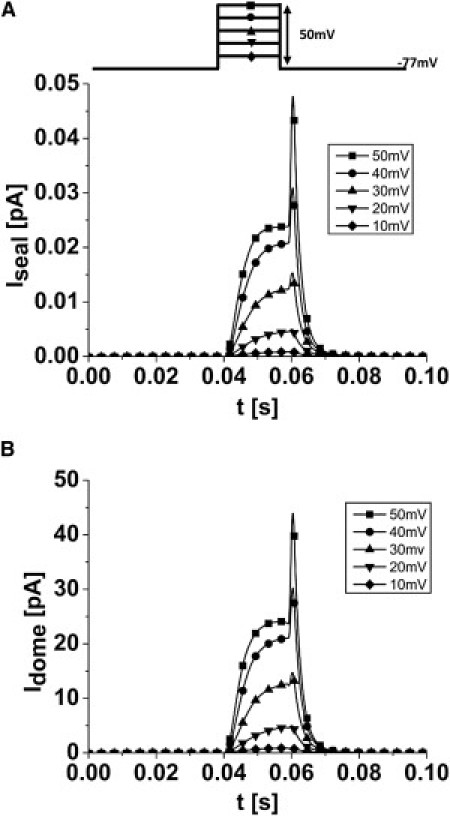
Predicted observed currents for Hodgkin-Huxley potassium channels uniformly distributed in the dome and the seal. (A) Current arising from channels in the seal (Iseal). (B) Current arising from channels in the dome (Idome). If the channel density is uniform, the dome contributes most of the current. A holding potential of −77 mV and a series of 20 ms depolarizing pulses were applied to −27 mV with steps of 10 mV.
Discussion
Our simulations show that significant currents can arise from ion channels in the seal, as reported in a previous study (3). That study showed a channel producing typical square current pulses with a good separation of real and imaginary components of the channel impedance. Several seconds later, the channel appeared to have moved into the seal, producing highly variable current amplitudes (because the durations are random and comparable to τ). The transitions exhibited slower rise and fall times, and mixing of the real and imaginary components of the impedance as the equivalent circuit moved from two to three or more components.
When there is a flux of ions, there is also a flux of water that accompanies the ions, as well as a water flux through the membrane driven by the osmotic pressure of accumulated ions. We postulate that for driving potentials that push ions into the seal, this water flux will expand the local seal spacing and modulate the channel current. These mechanical effects are complicated and highly dependent on the mechanical model of the seal and we did not include these effects. However, intuition suggests that as the seal space expands and relaxes, the channel currents will have varying amplitudes. We know that reannealing the membrane to the glass takes on the order of tens of milliseconds (3).
Although we modeled the seal with uniform dimensions and homogeneous transport properties, we know that membrane proteins can stick out from the bilayer, and thus the space will not have a uniform thickness. However, we also know from personal observations of various TRP channels, as well as from previous work (3), that the membrane proteins are not uniformly distributed between the seal and the dome, and in fact are usually excluded from the seal. The patch mechanics of cell membranes is more complicated than that of bilayers because the membrane in a patch is not a lipid bilayer; rather, it is a sample of the cell cortex that contains both cytoskeleton and extracellular matrix. If the extracellular matrix of proteoglycans is present in the seal, it will be compressed between the bilayer and the glass. This caulking would increase the local viscosity by behaving as a dense sugar solution and allow us to form GΩ seals from lumpy membranes. (Perhaps we could improve the gigaseal properties by attaching exogenous polymers to the membrane or the pipette before forming a seal.) The high resistivity we require of the core conductor could also be explained by a low mobility of ions caused by reversible binding to negative charges in the seal. Because the membrane and glass have a low dielectric constant, and they are both negatively charged and h < Debye length in the bath, anions would be excluded from the seal, thereby decreasing σs and making the seal cation-selective (3). The low dielectric of the core surroundings could also decrease the concentration of cations in the seal. Currently, we cannot attribute the low seal conductivity to a specific effect.
Currents originating from channels in the seal are smaller than the same channels in the dome, and they should also have longer rise times. This correlation was noted by Dudel et al. (10) in the early days of patch clamping. The conductance of channels in the seal are small for high-resistance seals (Fig. 3 A), and thus only channels within 0.1 μm of the dome have any significant conductance. This has important implications for the often-unstable conductance states observed for mechanosensitive channels exposed to repeated pressure steps. When a patch is stretched via a repetitive pressure-step protocol, the dome area becomes larger partially from peeling short stretches of membrane (usually <0.2 μm) from the seal region. During the application of pressure, channels in the dome could migrate into the peeled membrane. Because the membrane reseals after the pressure step ends, channels in this region would need to migrate back to the dome. However, if the migration back is slowed, or the peeled region does not reseal as tightly, the channels will get caught in this transition zone until the next pressure step, affecting their conductance.
The changes in rise time can be hard to see without carefully examining the data. It would be simpler to detect the amplitude changes if one had a reliable standard of comparison, but in general one cannot be sure that a given recording comes from channels in the dome or the seal, or both, or whether any variations are not the result of intrinsic channel heterogeneity. We do know that membrane proteins are not uniformly distributed between the dome and the seal, so in practice, the relative contributions of the two regions are unknown (3). Some of the low-conductance channels reported in the literature may actually represent high-conductance channels located in the seal. Voltage-dependent channels in the seal are particularly complicated to analyze because the time-dependent voltage gradients of the stimulus in the seal create channels of varying conductance with shifts in the activation properties. With the assumption of uniform channel density, the currents from the dome dominate the response and seal currents can be ignored.
To extract the physical properties of the seal from the model, we had to assume that the seal was of a uniform thickness. This is undoubtedly incorrect because membrane proteins, such as acetylcholine receptors, can protrude >5 nm above the lipids (6). This is one reason why we prefer to attribute the low conductance of the core to viscosity rather than to ion binding, because glycocalyx could serve as a sort of electrical caulking around such channels. We observed in some patches a phase-like exclusion of proteins in an annular band 2–3 μm below the dome (3). This could represent a localized seal where the bilayer directly touches the glass. In this case, the effective length of the seal would be shorter than the 10 μm we assumed and the core conductivity would need to be lower. However, FM1-43 (Fig. S1 B) formed a rather smooth gradient (Fig. S1 B), suggesting that there were no strong interactions between the lipids and the glass. If we calculate the diffusion constant for dye in the seal (Fig. S2), we obtain ∼10−8cm2/s, a value that is expected for liquid-phase lipids. The openness of the seal to diffusion of amphiphilic or hydrophobic drugs may affect data interpretation in sidedness experiments.
In conclusion, the modeling shows how the physical location of channels in a patch (dome plus seal) can alter the observed currents; however, the contributions from seal channels vary greatly with the some parameters of the model, particularly seal resistance. If we assume uniform distribution or confinement of channels to the dome, the dome currents will yield reliable data.
Acknowledgments
This work was supported by a National Institutes of Health grant to F.S.
Supporting Material
References
- 1.Sakmann B., Neher E. Patch clamp techniques for studying ionic channels in excitable membranes. Annu. Rev. Physiol. 1984;46:455–472. doi: 10.1146/annurev.ph.46.030184.002323. [DOI] [PubMed] [Google Scholar]
- 2.Hamill O.P., Marty A., Sigworth F.J. Improved patch-clamp techniques for high-resolution current recording from cells and cell-free membrane patches. Pflugers Arch. 1981;391:85–100. doi: 10.1007/BF00656997. [DOI] [PubMed] [Google Scholar]
- 3.Suchyna T.M., Markin V.S., Sachs F. Biophysics and structure of the patch and the gigaseal. Biophys. J. 2009;97:738–747. doi: 10.1016/j.bpj.2009.05.018. [DOI] [PMC free article] [PubMed] [Google Scholar]
- 4.Sachs F. Stretch-activated ion channels: what are they? Physiology (Bethesda) 2010;25:50–56. doi: 10.1152/physiol.00042.2009. [DOI] [PMC free article] [PubMed] [Google Scholar]
- 5.Fischmeister R., DeFelice L.J., DeHaan R.L. Channel currents during spontaneous action potentials in embryonic chick heart cells. The action potential patch clamp. Biophys. J. 1984;46:267–271. doi: 10.1016/S0006-3495(84)84020-5. [DOI] [PMC free article] [PubMed] [Google Scholar]
- 6.Unwin N. Nicotinic acetylcholine receptor at 9 A resolution. J. Mol. Biol. 1993;229:1101–1124. doi: 10.1006/jmbi.1993.1107. [DOI] [PubMed] [Google Scholar]
- 7.Hodgkin A.L., Huxley A.F. A quantitative description of membrane current and its application to conduction and excitation in nerve. J. Physiol. 1952;117:500–544. doi: 10.1113/jphysiol.1952.sp004764. [DOI] [PMC free article] [PubMed] [Google Scholar]
- 8.Suchyna T.M., Besch S.R., Sachs F. Dynamic regulation of mechanosensitive channels: capacitance used to monitor patch tension in real time. Phys. Biol. 2004;1:1–18. doi: 10.1088/1478-3967/1/1/001. [DOI] [PubMed] [Google Scholar]
- 9.Weber P.A., Chang H.C., Nicholson B.J. The permeability of gap junction channels to probes of different size is dependent on connexin composition and permeant-pore affinities. Biophys. J. 2004;87:958–973. doi: 10.1529/biophysj.103.036350. [DOI] [PMC free article] [PubMed] [Google Scholar]
- 10.Dudel J., Franke C., Usherwood P.N. Rapid activation and desensitization by glutamate of excitatory, cation-selective channels in locust muscle. Neurosci. Lett. 1988;88:33–38. doi: 10.1016/0304-3940(88)90311-4. [DOI] [PubMed] [Google Scholar]
Associated Data
This section collects any data citations, data availability statements, or supplementary materials included in this article.