

Abstract
The receptor tyrosine kinase EphA2 interacts with its glycosylphosphatidylinositol (GPI)-linked ephrin-A1 ligand in a juxtacrine configuration. The soluble ephrin-A1 protein, without its GPI membrane linker, fails to activate EphA2. However, preclustered ephrin-A1 protein is active in solution and has been frequently used to trigger the EphA2 receptor. Although this approach has yielded insights into EphA2 signaling, preclustered ligands bypass natural receptor clustering processes and thus mask any role of clustering as a signal regulatory mechanism. Here, we present EphA2-expressing cells with a fusion protein of monomeric ephrin-A1 (mEA1) and enhanced monomeric yellow fluorescent protein that is linked to a supported lipid bilayer via a nickel-decahistidine anchor. The mEA1 is homogeneously dispersed, laterally mobile, and monomeric as measured by fluorescence imaging, correlation spectroscopy, and photon counting histogram analysis, respectively. Ephrin-A1 presented in this manner activates EphA2 on the surface of MDA-MB-231 human breast cancer cells, as measured by EphA2 phosphorylation and degradation. Spatial mutation experiments in which nanopatterns on the underlying substrate restrict mEA1 movement in the supported lipid bilayer reveal spatio-mechanical regulation of this signaling pathway, consistent with recently reported observations using a synthetically cross-linked ephrin-A1 dimer.
Introduction
Eph receptor tyrosine kinases, through binding to either glycosylphosphatidylinositol (GPI)-linked or transmembrane ephrin ligands, are important regulators of cell adhesion, migration, and vascular development (1). Eph and ephrin interactions have been shown to both suppress and promote cancer formation by altering cell repulsion and migration (2). In particular, EphA2 and its GPI-linked ligand ephrin-A1 are important in maintaining many different tumor types (3). Overexpression of EphA2 in nontransformed mammary epithelial cells confers malignant transformation and tumorigenic potential (4,5). Decreasing expression of EphA2 can reverse metastatic behavior in immortal breast epithelial cell lines (6). In addition to these pro-oncogenic properties of overexpressed EphA2, this receptor has also been shown to suppress tumorigenesis. For example, EphA2 knockout mice are more susceptible to develop skin cancer upon exposure to known carcinogens (7). These findings, among others, have led EphA2 to become a target for cancer therapeutics.
EphA2 consists primarily of an intracellular kinase domain, an extracellular ligand-binding domain, and a transmembrane domain (8). Activation of EphA2 is marked by phosphorylation of the kinase domain (9) and can lead to receptor internalization and degradation through the recruitment of metalloproteases to the cell membrane (10). Ligand-induced receptor activation occurs upon the binding of EphA2 to its ephrin-A1 ligand presented on apposed cell membranes. Ligand binding is generally followed by dimerization of the receptor-ligand complex, oligomerization as a result of three distinct ligand binding sites on the receptor (11), and possibly larger scale cell surface reorganization (12). The clustering and subsequent endocytosis of EphA2 has been hypothesized as a method of regulating cell surface EphA2 levels (13). Ligand-induced receptor clustering has been proposed as a likely source of signal regulation that is independent of any conformational changes within the receptor and therefore a potential deregulatory mechanism in Eph-overexpressing tumors (14).
The hybrid live cell-supported lipid bilayer (SLB) junction, in which one cell surface in a juxtacrine signaling process is replaced by a SLB displaying ligands of interest, has proven to be an effective strategy to examine cell-cell signaling (12,15–18). SLBs can be formed by the spontaneous self-assembly of a phospholipid bilayer upon deposition of vesicles onto a silica support (19,20). The resulting membrane is continuous and fluid, with lipid lateral mobilities typically ranging from 1 to 3 μm2/s (21,22). GPI-linked proteins can be incorporated into SLBs without loss of mobility (23). In many cases, including the work presented here, protein linkage to the membrane by multivalent interactions between decahistidine tails on the protein and Ni-chelating lipids in the membrane is equally effective (24), and technically much simpler (25,26). We have recently used the live cell-SLB junction, functionalized with a preclustered EA1 ligand, to study properties of EphA2 signaling (12). This work revealed that the EphA2 signaling pathway is sensitive to the physical restriction of receptor-ligand movement over micron length scales within the plane of the cell-SLB interface. These results raise interesting hypotheses concerning the possibility of mechanosensing in relation to EphA2 signaling and they also underscore the importance of large-scale receptor assembly as a regulatory component of signaling. In this regard, however, the use of preclustered ligands is especially problematic because it essentially bypasses natural receptor assembly processes.
Eph receptors bind to ephrin ligands as a 1:1 complex (27) and can be activated by ephrin expressed on cell membranes or in a preclustered format (28). Soluble monomeric ephrin has generally been considered inactive. However, a recent report suggests that the media containing soluble and monomeric ephrin-A1, released from tumor cells, through possible cleavage processes, is capable of activating EphA2 in paracrine signaling (29). These contradictory findings underscore the complexity of Eph/ephrin interactions. Based on prior observations of inactive monomeric protein ligands becoming active in juxtacrine signaling from supported membranes, for example major histocompatibility complex in T cell receptor signaling (30) and neuroligin in neurexin signaling (31), we hypothesized that laterally mobile and monomeric ephrin-A1 presented on a supported membrane may activate the EphA2 receptor in the absence of synthetic cross-linking agents. Furthermore, this platform will provide a useful tool to study the signaling pathway and the effects of natural receptor clustering processes.
We constructed a fusion protein of monomeric ephrin-A1 (mEA1), enhanced yellow fluorescent protein (EYFP), and a 10-histidine (H10) tail. We have previously shown that H10 tails can form essentially irreversible multivalent linkage with Ni-chelating lipids in SLBs when assembled using kinetically controlled parameters (26). Fluorescence imaging of the mEA1-EYFP-H10 fusion protein in SLBs reveals that it is homogeneously distributed. Fluorescence correlation spectroscopy confirms that it is laterally mobile with a diffusion coefficient similar to that of the lipids, and photon counting histogram analysis reveals the protein to be predominantly monomeric on the membrane surface. The supported membrane-associated mEA1 activates the EphA2 receptor signaling pathway in live EphA2-expressing human breast cancer cells (MDA-MB-231), as measured by receptor phosphorylation and degradation. The soluble mEA1 is inactive in these experiments. Additionally, spatial mutation experiments in which nanopatterned structures on the underlying substrate are used to manipulate the movement and assembly of receptor-ligand complexes reveal spatio-mechanical influences over the EphA2 signaling pathway similar to recently reported observations using a synthetically cross-linked ephrin-A1 dimer, EA1-Fc (12). Large-scale EphA2/ephrin-A1 assembly occurs during activation even without any preclustering of the ligand and mechanical interference with this process leads to distinct alterations in cell behavior, as observed by cytoskeleton morphology and recruitment of the metalloprotease, ADAM10.
Materials and Methods
This section has been moved to the Supporting Material.
Results and Discussion
EA1 association with supported membranes is stable and properly oriented
The EA1 fusion protein is expressed by combining the human monomeric EA1 ectodomain sequence, along with the EYFP sequence (as a 1:1 construct between EA1 and EYFP), with an H10 tail on the C-terminus for linkage to Ni-chelating lipids, which are incorporated into the supported membrane at molar ratios ranging from 0.005 to 0.06 (Fig. 1 A and Fig. S1 in the Supporting Material). Multivalent Ni-histidine interactions are necessary to stably associate protein through this method (Fig. 1 A inset) (26). Typically, protein is incubated under carefully tuned kinetic control parameters to optimize for multivalent interactions. It is also generally necessary to allow a desorption period to remove weakly associated protein. Although equilibrium is never fully reached, stable multivalently bound His-tagged proteins can be achieved with reproducible results. A Ni-histidine dissociation curve is generated to show that the mutlivalent Ni-bound protein remains stably bound to the SLB for at least 16 h (Fig. 1 B). The protein linkage through histidine-chelated Ni interactions is confirmed by the addition of 100 mM EDTA, which strongly sequesters metal ions and leads to dissociation of protein bound in this manner (Fig. 1 B).
Figure 1.

Schematic diagram of the experimental setup. (A) EphA2-expressing breast cancer cells are cultured on a SLB consisting of a tunable surface density of EA1 fusion proteins. This fusion protein is designed by linking the soluble portion of monomeric human ephrin-A1 with enhanced YFP that has an A206K mutation to prevent dimer formation. The inset shows the anchoring strategy, which is stable when the decahistidine sequence at the C-terminus of the fusion protein is chelating multiple Ni ions that are chelated by a tunable subset of lipids within the bilayer. (B) Ni-histidine dissociation curve shows that protein binding reaches a kinetically trapped state (plateau in graph between 3 and 16 h) that is stable and therefore insensitive to rinsing steps well beyond the timescale of experiments. The bilayer is incubated at 25°C for the entirety of the measurements except for an hour at 37°C in warm cell media after the first 2 h. The high temperature incubation period is performed to mimic the period after cells are introduced and then incubated at 37°C for an hour.
EA1 is mobile and predominantly monomeric in supported membranes
Fluorescence correlation spectroscopy (FCS) along with its counterpart photon counting histogram (PCH) analysis offer a powerful means to quantify the lateral mobility and the cluster size distribution of EA1 on the SLB surface (32). A typical time autocorrelation function of fluorescence intensity fluctuations from membrane-bound EA1 is plotted in Fig. 2 A. The data is fitted to an analytical expression of normal two-dimensional diffusion in a two-dimensional Gaussian illumination spot,
| (1) |
where Nave represents the average number of independent molecules, τ is the time interval, and τD represents the characteristic residence time (33). Based on this model, the calculated diffusion coefficient for membrane EA1 is 2.3 ± 0.2 μm2/s. This value is typical for lipid diffusion in supported membranes (34) and also consistent with fluorescence recovery after photobleaching experiments (Fig. S2). Although tempting, one should not infer from this observation that the protein is monomeric. For FCS to resolve two different species by their diffusion coefficients, a significant and well-defined difference in mobility is necessary (35). Because the EA1 is anchored to the membrane, its mobility is dominated by the membrane (36). As such, there is no well-defined scaling of molecular mobility with size and furthermore, the effective size of dimers, trimers, etc., is not at all clear (37). In light of these complexities, molecular mobility is an unreliable indicator of molecular size or state of clustering.
Figure 2.

Characterization of mEA1-SLB surface heterogeneity and protein cluster size. (A) FCS is used to determine the heterogeneity of the surface. Values are fitted to a standard two-dimensional, single component curve. The diffusion constant calculated for the majority species is comparable to protein diffusion constants on cell membranes in vivo. A derivation of the autocorrelation function is used to relate the fraction of monomer to the average aggregation number (Q). From two independent FCS experiments, the derived function predicts that the fraction of monomeric species is 77 ± 7% for a Q value of three. (B) The PCH is best fit by a two species fit. The majority of the surface protein molecules (76 ± 5%) exhibit an average fluorescence intensity corresponding to a single EYFP flourophore, indicating that the majority of the species exists as monomer fusion proteins. This percentage is an average across three independent PCH experiments.
Direct analysis of the distribution of photon arrival times (PCH) emitted by the EYFP molecules (that are genetically fused to EA1) diffusing through the open confocal spot provides a significantly more sound method of determining the aggregation state of EA1 (Fig. 2 B). The fluorescence intensity fluctuations caused by the EYFP molecules yield a super-Poisson (Poi) distribution of photon counts arriving at the detector for a given time interval (38). By choosing a time interval that is short relative to the timescale for molecules to move through the laser spot, the PCH reflects the cluster size distribution and, importantly, is independent of mobility. The probability distribution of a single molecule, p(1), diffusing within a closed system, V0, is expressed as
| (2) |
where is the scaled point spread function for synchronizing the PCH volume with the FCS volume, represents the probability to find the molecule at position , k is the detected photon count, and ε is the molecular brightness of the molecule. For N independent and identical molecules, the joint probability distribution p(N) is calculated from consecutive convolutions of p(1). It is expressed as
| (3) |
It is numerically easier and equally accurate to select a reference volume (V1) that is smaller than the reservoir (V0) for deriving the PCH probability distribution so that the N value can remain small (38). The probability distribution for multiple molecules in an open system is the expectation value of p(N), which is weighted by the Poissonian probability, p#(N), of observing N particles,
| (4) |
where the change from to reflects the selection of a V1 that is smaller than V0. This change does not affect the photon count probability because this probability of an open system is independent of the volume V1 as long as this probability can be referenced to the concentration of the molecule (38). In the case of membrane EA1, an accurate independent measurement of the surface density of EA1 is required to determine the N. This is achieved using quantitative fluorescence (QF) microscopy, which calibrates fluorescence from the membrane-bound analyte with fluorescent lipid standards with known membrane surface densities (39). Once this value is determined through QF, it is inserted into Eq. 4 and the resulting probability distribution is used to fit the membrane EA1 PCH. Because the PCH analysis has been experimentally demonstrated to be capable of resolving the aggregation state of fluorescent proteins (40), given an accurate value of N, both the average aggregation state (Q) and fraction (F) of monomeric EA1 can be determined from the best fit probability distribution, which has a local χ2 value closest to one. Interestingly, the relationship between Q and F can be separately derived from the G(0) of the autocorrelation function for a two-component model as
| (5) |
where N is determined by QF measurements and G(0) is calculated from Eq.1 as (see the Supporting Material for derivation). Therefore, for a given integral value of Q, the F value can be predicted by Eq. 5.
The precision with which both FCS and PCH can determine the surface density is characterized using lipid bilayer standards (Fig. S3, A–B). FCS and PCH results are in precise agreement with each other as well as the known surface densities for boron-dipyrromethene (Bodipy) fluorescent dyes bound to the headgroups of phospholipid molecules incorporated into the bilayer at molar ratios of 0.0001, 0.0002, and 0.0004, (Fig. S3, C–D). For these standards, the fluorescent lipid molecules are expected to move as monomers, in which case N is simply the number of molecules. Using these three standard lipid membranes, QF is performed to determine the surface density of membrane EA1. Calibration of spectral properties between the YFP fluorophore on EA1 and the lipid standard is performed in solution to obtain a scaling factor (39) of 0.7 (Fig. S4 A). This relationship is linear at unsaturated fluorophore concentrations (39), enabling direct extrapolation to determine the EA1 surface density from measured fluorescence intensity (Fig. S4 B). When N determined from surface density measurements by QF is used to interpret the two species autocorrelation function (Eq. 5), 77 ± 7% of EA1 is found to be monomeric (mEA1) and the remaining 13% has a Q value of 3 (trimers). Similarly, the best probability distribution fit to the PCH data is a two species curve resulting in an average local χ2 of 1.0 ± 0.2, corresponding to 76 ± 5% mEA1 with Q also equal to 3. The EA1 domain itself appears to be responsible for this clustering based on comparison to a similar fusion protein containing the extracellular domain of intercellular adhesion molecule 1 (ICAM) fused to YFP-H10 (ICAM-YFP-H10) (26,41). Both FCS and PCH analyses indicate ICAM-YFP-H10 to remain ∼100% monomeric under similar conditions (Fig. S5 and Fig. S6).
To gauge the precision of this methodology to determine clustering state, probability distributions are also calculated for cases of several different aggregation states: solely monomeric, dimeric, or trimeric EA1. The respective residuals are plotted in Fig. S6. The resolution of PCH in distinguishing between aggregation states can be revealed in the poor χ2 values of these cases. We conclude from two independent methods that the membrane-associated EA1 is predominantly monomeric.
EphA2 activation by membrane-associated EA1
After careful characterization of the membrane-associated EA1 surface, MDA-MB-231 cells, a highly invasive breast epithelial cancer cell line that overexpresses EphA2 (42), are cultured on this surface under similar conditions used for the surface characterization, and its EphA2 activation is measured. EphA2 triggering by membrane-associated ephrin-A1 has been previously characterized through the phosphorylation and degradation of this receptor tyrosine kinase (12). These properties can be measured in two different manners: i), fluorescence microscopy to image immunostained signaling molecules colocalizing with EphA2, such as phosphotyrosine and the metalloprotease ADAM10, and ii), Western blot analysis to determine degradation and phosphorylation of EphA2. In this case, both methods are employed to determine EphA2 activation by membrane associated EA1.
First, to examine whether EphA2-expressing cells are responsive to changes in ligand concentration, MDA-MB-231 cells are incubated on different EA1 surfaces with different surface densities that are representative of typical cell surface concentrations of EA1. The EA1 surface density can be titrated by changing both the solution incubation concentration and the molar percent of Ni capturing lipids incorporated into the supported membrane (Fig. 3 A). The resulting mEA1 surface densities are measured using QF microscopy as previously described (39). After 10 min of incubation, the cells are fixed and permeabilized. Fluorescently labeled antibodies staining for EphA2 and phosphotyrosine are imaged using epifluorescence microscopy (Fig. 3 B). These representative images show the formation of EphA2 microclusters that colocalize with the microclusters of mEA1, imaged for the same cell. Similarly, phosphotyrosine immunofluorescence also colocalizes with mEA1 microclusters. The EphA2 receptor expressed on the membranes of MDA-MB-231 cells are interacting with membrane mEA1 proteins and there are high levels of phosphorylation, suggesting EphA2 activation. This colocalization is observed for mEA1 surface densities ranging from just a few molecules to hundreds of molecules/μm2. The membrane mEA1 fusion protein presented to MDA-MB-231 cells is capable of initiating receptor phosphorylation over a wide range of surface densities.
Figure 3.
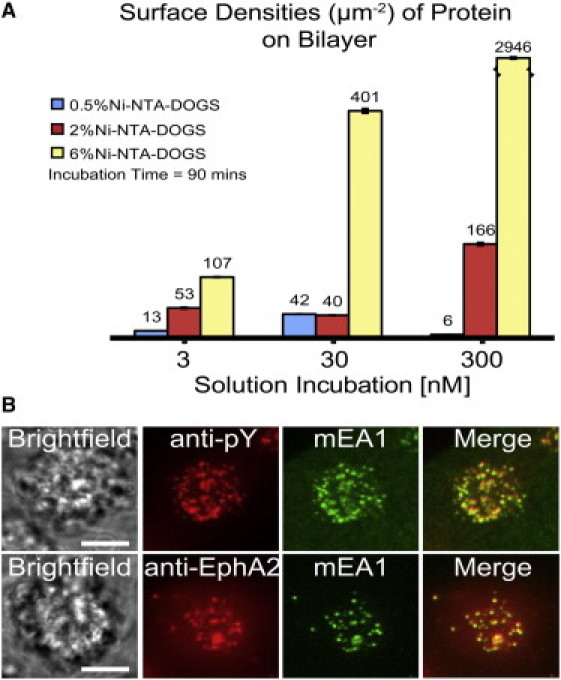
Surface density titration of mEA1 and immunofluorescence images of MDA-MB-231 cells. (A) The surface density of mEA1 is achieved by varying the solution incubation concentration above the bilayer and the molar ratio of Ni capturing lipids within the bilayer through kinetic control parameters. The surface density measurements are performed using quantitative fluorescence microscopy. (B) MDA-MB-231 cells are fixed and permeabilized after 15-min incubations on these surfaces. Antibodies against phosphorylated tyrosine residues (pY) and EphA2 are used to detect phosphorylation at the regions of mEA1 cluster formation and to stain for the presence of EphA2, respectively. For high mEA1 surface densities (thousands of molecules/μm2), phosphorylated proteins are recruited to the mEA1 microclusters. At low mEA1 surface densities (hundreds of molecules/μm2), EphA2 is also recruited. These results suggest that over a range of surface densities, phosphorylated proteins and EphA2 colocalize with mEA1 on the single cell level. A similar result is observed for EphA2 at high mEA1 surface densities and pY at low mEA1 surface densities; recruitment of both molecules occurs over a range of mEA1 surface densities (results not shown). Scale bars are 10 μm.
Next, the lateral reorganization and clustering of the mEA1 fusion protein is examined over the course of an hour. This incubation time is previously shown to be a useful observation time for the central transport of membrane EA1 by EphA2 expressing cells (12). The EphA2 density on the surface of MDA-MB-231 is approximately several hundreds of molecules/μm2; the surface density for mEA1 is fixed at a similar value for these experiments. Cells were fixed and permeabilized after incubations of 5, 10, 20, and 60 min for imaging (Fig. S7). At early time points (5 and 10 min), Eph-ephrin clusters are generally micron-sized or smaller and are randomly distributed across the cell-SLB interface. Within 1 h of cell engagement, these clusters coalesce into larger clusters that are transported to the center of the cell-SLB interface, resulting in a central contact zone several microns in diameter enriched in Eph-ephrin complexes. Temporal progression of ADAM10 recruitment to Eph-ephrin clusters is examined through staining cells with a fluorescently labeled anti-ADAM10 antibody. ADAM10 recruitment is a known step of the EphA2 degradation pathway, and is thought to enzymatically cleave the ephrin ligand from the ligand-presenting surface (10). At early time points (5 and 10 min), most of the ADAM10 is within the cell, well out of the focal plane of the objective, resulting in a blurred ADAM10 signal observed using epifluorescence microscopy. At later time points (20 and 60 min), we observe recruitment of ADAM10 to the EphA2-mEA1 clusters. A qualitative analysis of the fluorescence microscopy images suggest that mEA1 leads to EphA2 phosphorylation and degradation as mediated by ADAM10. Furthermore, these results suggest that ADAM10 recruitment to Eph-ephrin clusters is a dynamic process. Despite the presence of a small minority of oligomeric EA1, the majority mEA1 is clearly active because essentially all of the available EA1 on the supported membrane is sequestered into EphA2 signaling clusters.
Finally, to contextualize these findings within the framework of classical biochemical techniques, Western blotting is used to examine EphA2 phosphorylation and degradation across a wide range of mEA1 surface densities and preclustered states (Fig. 4 and Figs. S8–S10). MDA-MB-231 cells are incubated on surfaces displaying different surface densities and aggregation states of mEA1, including both membrane bound as well as in solution. After 2 h incubations, the cells are lysed and the protein supernatant is analyzed. On the basis of the Western blot analysis, we interpret the lack of increased EphA2 downregulation as no EphA2 downregulation. Exogenous dimerization is introduced using an anti-green fluorescent protein mouse monoclonal IgG2a antibody to cross-link mEA1-eYFP-H10. A further degree of clustering is introduced through the addition of a goat anti-mouse IgG2a antibody. At low surface densities of EA1 (∼100 molecules/μm2) on the SLB, no significant EphA2 degradation or phosphorylation is observed regardless of the degree of EA1 cross-linking. Notably, this contrasts sharply with microscopy data, which indicates strong activation at similar densities. We speculate that Western analysis is not sufficiently sensitive to monitor signaling at these lower EA1 levels.
Figure 4.
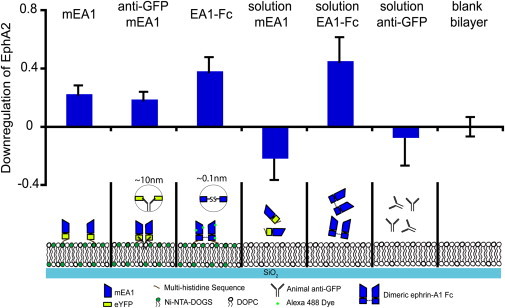
Western blots are analyzed from the lysate of MDA-MB-231 cells incubated on different surfaces and in different solutions. The blots are stained for the presence of EphA2. In this case, the degradation of EphA2 is represented by the intensity of an EphA2 band between 75 and 150 kDa. The lower the band intensity, the greater the receptor degradation. Intensity measurements of EphA2 bands are repeated for at least four unique Western blots and the results are averaged across the blots. Soluble mEA1, over a range of concentrations (results not shown), does not induce significant EphA2 degradation, whereas mEA1 on a SLB leads to EphA2 degradation. Antibody cross-linked mEA1 on a SLB leads to EphA2 degradation, although to a lesser degree than preclustered EA1-Fc. At low surface densities of mEA1, Western blot analysis is unable to detect significant EphA2 activation (Figs. S8–S10).
When the EA1 surface density is increased 10-fold (∼1000 molecules/μm2), EphA2 degradation and phosphorylation levels for mEA1 is measured at similar levels to those observed in response to soluble EA1-Fc, the synthetically cross-linked ephrin-A1 dimer. However, the membrane-bound antibody cross-linked mEA1, designed to mimic the EA1-Fc, is not as activating as the EA1-Fc presented on a supported membrane through a Ni-histidine linkage. To explain this discrepancy, the length scales of the two different cross-linking strategies need to be examined. For the antibody cross-linked mEA1, the distance between two antigen binding sites of an antibody is ∼10 nm (43), and this spacing might be unfavorable for EphA2 activation. On the other hand, the EA1-Fc dimer is linked by a disulfide bond, which is ∼0.1 nm in length. This observation is consistent with the small length scales required for the recruitment of proteins in Eph signaling that has been previously reported (44). Similar to previous reports of the inactivity of soluble monomeric ephrin-A1 (28), we also observed inactivity of the mEA1-eYFP-H10 in solution for both EphA2 degradation and phosphorylation Western blot analyses. Although fluorescence microscopy measurements suggest that EphA2 can be activated by membrane EA1 over a range of surface densities, Western blot analysis is only capable of detecting EphA2 activation at high densities of membrane EA1 because this analysis takes into account the fraction of total cell surface EphA2 that is downregulated. Our results suggest that activating a small fraction of EphA2 can initiate a full cellular response.
To extend observations beyond the MDA-MB-231 cell line, the central transport of membrane mEA1 by EphA2 expressing cells is also observed for other breast cancer cell lines (Fig. S11). After an hour incubation on supported membranes with EA1 surface densities of ∼100 molecules/μm2, a similar EA1-bound EphA2 transport leading to a central contact zone is observed. Immunofluorescence images of EphA2 show the receptor colocalizing with mEA1. The enchanced fluidity of the Ni-histidine anchoring strategy allows for a kinetically faster central transport as compared to the synthetically cross-linked ephrin-A1 dimer on supported membrane as demonstrated previously (12).
EphA2 signal regulation in MDA-MB-231 cells has spatio-mechanical dependency
Sensitivity of the EphA2 system to spatio-mechanical perturbation is tested using the spatial mutation strategy. Patterns of metal grids, prefabricated onto the underlying substrate, restrict the lateral mobility of membrane mEA1 as well as ligand-engaged EphA2 receptors on the live cell. Immunofluorescence images of phalloidin-labeled actin and ADAM10 detected with epifluorescence and total internal reflection fluorescence microscopies, respectively, show the altered downstream signals as a consequence of EphA2 spatial mutation. When Eph-ephrin clusters are laterally constrained within corrals larger than five microns in pitch, the actin cytoskeleton is concentrated in an annulus, immediately peripheral to the Eph-ephrin central assembly (Fig. 5 A), which is indicative of cell contraction from the ephrin-presenting surface. When grids with narrower pitches are prepatterned onto the underlying substrate, the cytoskeleton displays a spreading morphology, suggesting mesenchymal cell behavior (45). Using total internal reflection fluorescence, which excites fluorophores within 70–100 nm of the cell-SLB interface thereby eliminating a majority of the intracellular fluorescence signal (32), increasing ADAM10 recruitment is observed when Eph-ephrin transport is less hindered (Fig. 5, B and C). The density of EphA2 on the membrane surface is equal across the different pitched corrals, suggesting that EphA2 recruitment to the cell membrane is unaffected by the Cr grids (Fig. 5 C). These findings suggest that EphA2 signaling is sensitive to the lateral organization of membrane mEA1. Furthermore, this signaling pathway exhibits a dependency on the spatio-mechanical organization of the EphA2 receptor.
Figure 5.

EphA2 pathway activated by mEA1 shows a spatio-mechanical regulatory component. (A) Ligand-induced EphA2 clustering is restricted with chromium barriers. Epifluorescence images show cytoskeleton annulus formation when transport is unrestricted and cytoskeleton spreading morphology when transport is restricted. (B) Total internal reflection fluorescence microscopy and (C) subsequent quantitative colocalization analysis of EphA2 to ADAM10 reveals that ADAM10 recruitment occurs only when receptor transport is unhindered. An average of 200 cells was analyzed for each grid pitch. The surface density of mEA1 used for these experiments is approximately hundreds of molecules/μm2. Scale bars are 10 μm.
Conclusion
Monomeric ephrin-A1 displayed on a supported membrane successfully triggers EphA2 in living cells. Importantly, this system enables observations of natural receptor ligand clustering and assembly processes, as driven by the EphA2 receptor expressing cell. We affirm some fundamental observations concerning influences of mechanical constraints of ephrin-A1 ligand movement on EphA2 signaling, which had been originally reported using only chemically cross-linked ephrin-A1 ligands. The findings presented here confirm that the spatio-mechanical sensitivity we discovered in the EphA2 signaling pathway is not due to the chemical cross-linking of ephrin-A1 from using a streptavidin-biotin linkage. However, some differences in the kinetics of assembly are also noted between the two systems. Through the use of a monomeric fluorescent fusion protein of ephrin-A1, we are able to examine the initial steps of Eph-ephrin clustering and transport that have been shown to play vital roles in signal transduction and is functionally altered in cancerous cells.
Acknowledgments
The authors thank Pradeep M. Nair and Michael P. Coyle for critical reading of the manuscript. The authors also thank Joe W. Gray for providing the Western blotting equipment and Odyssey Infrared Imaging machine.
This work was supported by the Director, Office of Science, Office of Basic Energy Sciences, Chemical Sciences, Geosciences, and Biosciences Division (Q.X.; hybrid synthetic-live cell interfaces) and the Materials Sciences and Engineering Division (R.S.P.; supported membrane substrates) of the U.S. Department of Energy (DOE) under contract no. DE-AC02-05CH11231. Patterned substrate fabrication was performed, in part, at the Molecular Foundry (or National Center for Electron Microscopy), Lawrence Berkeley National Laboratory (LBNL), and was supported by the Office of Science, Office of Basic Energy Sciences, Scientific User Facilities Division, of the U.S. DOE under contract no. DE-AC02-05CH11231. This work was also supported by the Laboratory Directed Research and Development Program of LBNL under U.S. DOE contract no. DE-AC02-05CH11231. Seed support for biomedical aspects of this work was provided by the U.S. Department of Defense DA Congressionally Directed Medical Research Program Idea Award BC102681 under U.S. Army Medical Research Acquisition Activity no. W81XWH-11-1-0256, with follow-on support provided by Award U54 CA143836 from the National Cancer Institute (NCI) beginning in 2009. The content is solely the responsibility of the authors and does not necessarily represent the official views of the NCI or the National Institutes of Health.
Supporting Material
References
- 1.Lackmann M., Boyd A.W. Eph, a protein family coming of age: more confusion, insight, or complexity? Sci. Signal. 2008;1:re2. doi: 10.1126/stke.115re2. [DOI] [PubMed] [Google Scholar]
- 2.Mosch B., Reissenweber B., Neuber C., Pietzsch J. Eph receptors and ephrin ligands: important players in angiogenesis and tumor angiogenesis. J. Oncol. 2010;2010:135285. doi: 10.1155/2010/135285. [DOI] [PMC free article] [PubMed] [Google Scholar]
- 3.Wykosky J., Debinski W. The EphA2 receptor and ephrinA1 ligand in solid tumors: function and therapeutic targeting. Mol. Cancer Res. 2008;6:1795–1806. doi: 10.1158/1541-7786.MCR-08-0244. [DOI] [PMC free article] [PubMed] [Google Scholar]
- 4.Kinch M.S., Carles-Kinch K. Overexpression and functional alterations of the EphA2 tyrosine kinase in cancer. Clin. Exp. Metastasis. 2003;20:59–68. doi: 10.1023/a:1022546620495. [DOI] [PubMed] [Google Scholar]
- 5.Zelinski D.P., Zantek N.D., Kinch M.S. EphA2 overexpression causes tumorigenesis of mammary epithelial cells. Cancer Res. 2001;61:2301–2306. [PubMed] [Google Scholar]
- 6.Carles-Kinch K., Kilpatrick K.E., Kinch M.S. Antibody targeting of the EphA2 tyrosine kinase inhibits malignant cell behavior. Cancer Res. 2002;62:2840–2847. [PubMed] [Google Scholar]
- 7.Guo H., Miao H., Wang B. Disruption of EphA2 receptor tyrosine kinase leads to increased susceptibility to carcinogenesis in mouse skin. Cancer Res. 2006;66:7050–7058. doi: 10.1158/0008-5472.CAN-06-0004. [DOI] [PubMed] [Google Scholar]
- 8.Himanen J.P., Rajashankar K.R., Nikolov D.B. Crystal structure of an Eph receptor-ephrin complex. Nature. 2001;414:933–938. doi: 10.1038/414933a. [DOI] [PubMed] [Google Scholar]
- 9.Schlessinger J. Cell signaling by receptor tyrosine kinases. Cell. 2000;103:211–225. doi: 10.1016/s0092-8674(00)00114-8. [DOI] [PubMed] [Google Scholar]
- 10.Janes P.W., Saha N., Nikolov D.B. Adam meets Eph: an ADAM substrate recognition module acts as a molecular switch for ephrin cleavage in trans. Cell. 2005;123:291–304. doi: 10.1016/j.cell.2005.08.014. [DOI] [PubMed] [Google Scholar]
- 11.Smith F.M., Vearing C., Boyd A.W. Dissecting the EphA3/Ephrin-A5 interactions using a novel functional mutagenesis screen. J. Biol. Chem. 2004;279:9522–9531. doi: 10.1074/jbc.M309326200. [DOI] [PubMed] [Google Scholar]
- 12.Salaita K., Nair P.M., Groves J.T. Restriction of receptor movement alters cellular response: physical force sensing by EphA2. Science. 2010;327:1380–1385. doi: 10.1126/science.1181729. [DOI] [PMC free article] [PubMed] [Google Scholar]
- 13.Zhuang G., Hunter S., Chen J. Regulation of EphA2 receptor endocytosis by SHIP2 lipid phosphatase via phosphatidylinositol 3-Kinase-dependent Rac1 activation. J. Biol. Chem. 2007;282:2683–2694. doi: 10.1074/jbc.M608509200. [DOI] [PubMed] [Google Scholar]
- 14.Himanen J.P., Yermekbayeva L., Dhe-Paganon S. Architecture of Eph receptor clusters. Proc. Natl. Acad. Sci. USA. 2010;107:10860–10865. doi: 10.1073/pnas.1004148107. [DOI] [PMC free article] [PubMed] [Google Scholar]
- 15.Grakoui A., Bromley S.K., Dustin M.L. The immunological synapse: a molecular machine controlling T cell activation. Science. 1999;285:221–227. doi: 10.1126/science.285.5425.221. [DOI] [PubMed] [Google Scholar]
- 16.Mossman K.D., Campi G., Dustin M.L. Altered TCR signaling from geometrically repatterned immunological synapses. Science. 2005;310:1191–1193. doi: 10.1126/science.1119238. [DOI] [PubMed] [Google Scholar]
- 17.Manz B.N., Groves J.T. Spatial organization and signal transduction at intercellular junctions. Nat. Rev. Mol. Cell Biol. 2010;11:342–352. doi: 10.1038/nrm2883. [DOI] [PMC free article] [PubMed] [Google Scholar]
- 18.DeMond A.L., Mossman K.D., Groves J.T. T cell receptor microcluster transport through molecular mazes reveals mechanism of translocation. Biophys. J. 2008;94:3286–3292. doi: 10.1529/biophysj.107.119099. [DOI] [PMC free article] [PubMed] [Google Scholar]
- 19.Sackmann E. Supported membranes: scientific and practical applications. Science. 1996;271:43–48. doi: 10.1126/science.271.5245.43. [DOI] [PubMed] [Google Scholar]
- 20.Richter R.P., Bérat R., Brisson A.R. Formation of solid-supported lipid bilayers: an integrated view. Langmuir. 2006;22:3497–3505. doi: 10.1021/la052687c. [DOI] [PubMed] [Google Scholar]
- 21.Machán R., Hof M. Lipid diffusion in planar membranes investigated by fluorescence correlation spectroscopy. Biochim. Biophys. Acta. 2010;1798:1377–1391. doi: 10.1016/j.bbamem.2010.02.014. [DOI] [PubMed] [Google Scholar]
- 22.Groves J.T., Ulman N., Boxer S.G. Micropatterning fluid lipid bilayers on solid supports. Science. 1997;275:651–653. doi: 10.1126/science.275.5300.651. [DOI] [PubMed] [Google Scholar]
- 23.Groves J.T., Wülfing C., Boxer S.G. Electrical manipulation of glycan-phosphatidyl inositol-tethered proteins in planar supported bilayers. Biophys. J. 1996;71:2716–2723. doi: 10.1016/S0006-3495(96)79462-6. [DOI] [PMC free article] [PubMed] [Google Scholar]
- 24.Groves J.T., Dustin M.L. Supported planar bilayers in studies on immune cell adhesion and communication. J. Immunol. Methods. 2003;278:19–32. doi: 10.1016/s0022-1759(03)00193-5. [DOI] [PubMed] [Google Scholar]
- 25.Dorn I.T., Neumaier K.R., Tampé R. Molecular recognition of histidine-tagged molecules by metal-chelating lipids monitored by fluorescence energy transfer and correlation spectroscopy. J. Am. Chem. Soc. 1998;120:2753–2763. [Google Scholar]
- 26.Nye J.A., Groves J.T. Kinetic control of histidine-tagged protein surface density on supported lipid bilayers. Langmuir. 2008;24:4145–4149. doi: 10.1021/la703788h. [DOI] [PubMed] [Google Scholar]
- 27.Lackmann M., Mann R.J., Boyd A.W. Ligand for EPH-related kinase (LERK) 7 is the preferred high affinity ligand for the HEK receptor. J. Biol. Chem. 1997;272:16521–16530. doi: 10.1074/jbc.272.26.16521. [DOI] [PubMed] [Google Scholar]
- 28.Davis S., Gale N.W., Yancopoulos G.D. Ligands for EPH-related receptor tyrosine kinases that require membrane attachment or clustering for activity. Science. 1994;266:816–819. doi: 10.1126/science.7973638. [DOI] [PubMed] [Google Scholar]
- 29.Wykosky J., Palma E., Debinski W. Soluble monomeric EphrinA1 is released from tumor cells and is a functional ligand for the EphA2 receptor. Oncogene. 2008;27:7260–7273. doi: 10.1038/onc.2008.328. [DOI] [PMC free article] [PubMed] [Google Scholar]
- 30.Boniface J.J., Rabinowitz J.D., Davis M.M. Initiation of signal transduction through the T cell receptor requires the multivalent engagement of peptide/MHC ligands [corrected] Immunity. 1998;9:459–466. doi: 10.1016/s1074-7613(00)80629-9. [DOI] [PubMed] [Google Scholar]
- 31.Baksh M.M., Dean C., Groves J.T. Neuronal activation by GPI-linked neuroligin-1 displayed in synthetic lipid bilayer membranes. Langmuir. 2005;21:10693–10698. doi: 10.1021/la051243d. [DOI] [PMC free article] [PubMed] [Google Scholar]
- 32.Groves J.T., Parthasarathy R., Forstner M.B. Fluorescence imaging of membrane dynamics. Annu. Rev. Biomed. Eng. 2008;10:311–338. doi: 10.1146/annurev.bioeng.10.061807.160431. [DOI] [PubMed] [Google Scholar]
- 33.Lakowicz J.R. Plenum Press; New York: 1991. Topics in Fluorescence Spectroscopy. [Google Scholar]
- 34.Moran U., Phillips R., Milo R. SnapShot: key numbers in biology. Cell. 2010;141 doi: 10.1016/j.cell.2010.06.019. 1262–1262.e1. [DOI] [PubMed] [Google Scholar]
- 35.Meseth U., Wohland T., Vogel H. Resolution of fluorescence correlation measurements. Biophys. J. 1999;76:1619–1631. doi: 10.1016/S0006-3495(99)77321-2. [DOI] [PMC free article] [PubMed] [Google Scholar]
- 36.Saffman P.G., Delbrück M. Brownian motion in biological membranes. Proc. Natl. Acad. Sci. USA. 1975;72:3111–3113. doi: 10.1073/pnas.72.8.3111. [DOI] [PMC free article] [PubMed] [Google Scholar]
- 37.Naji A., Levine A.J., Pincus P.A. Corrections to the Saffman-Delbruck mobility for membrane bound proteins. Biophys. J. 2007;93:L49–L51. doi: 10.1529/biophysj.107.119222. [DOI] [PMC free article] [PubMed] [Google Scholar]
- 38.Chen Y., Müller J.D., Gratton E. The photon counting histogram in fluorescence fluctuation spectroscopy. Biophys. J. 1999;77:553–567. doi: 10.1016/S0006-3495(99)76912-2. [DOI] [PMC free article] [PubMed] [Google Scholar]
- 39.Galush W.J., Nye J.A., Groves J.T. Quantitative fluorescence microscopy using supported lipid bilayer standards. Biophys. J. 2008;95:2512–2519. doi: 10.1529/biophysj.108.131540. [DOI] [PMC free article] [PubMed] [Google Scholar]
- 40.Müller J.D., Chen Y., Gratton E. Resolving heterogeneity on the single molecular level with the photon-counting histogram. Biophys. J. 2000;78:474–486. doi: 10.1016/S0006-3495(00)76610-0. [DOI] [PMC free article] [PubMed] [Google Scholar]
- 41.Hartman N.C., Nye J.A., Groves J.T. Cluster size regulates protein sorting in the immunological synapse. Proc. Natl. Acad. Sci. USA. 2009;106:12729–12734. doi: 10.1073/pnas.0902621106. [DOI] [PMC free article] [PubMed] [Google Scholar]
- 42.Neve R.M., Chin K., Gray J.W. A collection of breast cancer cell lines for the study of functionally distinct cancer subtypes. Cancer Cell. 2006;10:515–527. doi: 10.1016/j.ccr.2006.10.008. [DOI] [PMC free article] [PubMed] [Google Scholar]
- 43.Murphy R.M., Slayter H., Yarmush M.L. Size and structure of antigen-antibody complexes. Electron microscopy and light scattering studies. Biophys. J. 1988;54:45–56. doi: 10.1016/S0006-3495(88)82929-1. [DOI] [PMC free article] [PubMed] [Google Scholar]
- 44.Nievergall E., Janes P.W., Lackmann M. PTP1B regulates Eph receptor function and trafficking. J. Cell Biol. 2010;191:1189–1203. doi: 10.1083/jcb.201005035. [DOI] [PMC free article] [PubMed] [Google Scholar]
- 45.Symons M., Segall J.E. Rac and Rho driving tumor invasion: who's at the wheel? Genome Biol. 2009;10:213. doi: 10.1186/gb-2009-10-3-213. [DOI] [PMC free article] [PubMed] [Google Scholar]
Associated Data
This section collects any data citations, data availability statements, or supplementary materials included in this article.