

Abstract
In vertebrate eyes, images are projected onto an inverted retina where light passes all retinal layers on its way to the photoreceptor cells. Light scattering within this tissue should impair vision. We show that radial glial (Müller) cells in the living retina minimize intraretinal light scatter and conserve the diameter of a beam that hits a single Müller cell endfoot. Thus, light arrives at individual photoreceptors with high intensity. This leads to an optimized signal/noise ratio, which increases visual sensitivity and contrast. Moreover, we show that the ratio between Müller cells and cones—responsible for acute vision—is roughly 1. This suggests that high spatiotemporal resolution may be achieved by each cone receiving its part of the image via its individual Müller cell-light guide.
Introduction
The vertebrate retina is inverted with respect to the incident light. This has caused many debates of putative advantages (1–3) and disadvantages. Most notably, along its way through the retinal tissue layers, light should be scattered (4). The expected loss of contrast, due to a background of scattered light, is in strong contradiction to the firm visual abilities of vertebrates. Both visual acuity at daylight and sensitivity threshold in darkness are sufficient to allow the reliable detection of environmental cues that ensures the survival of the species. This suggests that specific retinal tissue optics overcome light scattering, even in the typical nonfoveate vertebrate retina. It has recently been proposed that this might be achieved by Müller radial glial cells as light-guiding elements (5,6).
Mammalian Müller cells display an adequate refractive index (gradient) to allow light guidance by total reflection similar to glass fiber optics, thus, in the in vitro experiments act as light-guiding fibers that bridge the laser light path between two glass fibers (5). However, these observations were made on isolated cells, surrounded by homogenous fluids with refractive indices that differ from the complex optical landscape a glial cell experiences when embedded in the retinal tissue in vivo. The specific refractive indices of the various retinal tissue compartments are unknown and may vary among the different retinal layers (7). Thus, to prove the physiological relevance of Müller cell-provided light guidance, it must be shown that Müller cells act as light-guiding elements in the intact retina.
Here, we perform optical measurements in vital mammalian retinae and indeed show that Müller cells act as light guides in their physiological environment. Thereby they enhance the signal/noise ratio by minimizing scattering and conserve the spatial distribution of light patterns in the propagating image. We further show that the ratio between the numbers of cones and Müller cells is roughly 1, which indicates an optimal coupling between the light-guiding units and the functional light pattern-sensing units (the cones).
Methods
Animals and tissue preparation
All experiments conformed to the ARVO Statement for the Use of Animals in Ophthalmic and Vision Research and to the German laws of animal protection. The animals were killed with carbon dioxide. The enucleated eyes were immediately transferred into an extracellular solution consisting of NaCl, KCl, CaCl2, MgCl2, HEPES, and glucose (pH 7.4). The anterior part of the eye and the vitreous body were removed to dissect the retina from the eye cup.
Retina preparation
The freshly removed retina was inserted into extracellular solution containing one of the fluorescent dyes Mitotracker orange or Mitotracker green (C = 2 μM, t = 15 min; Molecular Probes, Eugene, OR) that predominantly stain Müller cells and photoreceptors. To obtain slice preparations, the retina was spread onto a nitrocellulose membrane (Whatman, Maidstone, Kent, UK) with the photoreceptor side down and was cut into thin slices (d = 1 mm). These retina-membrane slices were then mechanically fixed in a chamber to enable us to observe the retinal cross section. For whole-mount preparations, the retina was attached to the bottom of a chamber with the photoreceptor side up (Fig. 1 b) or down (Fig. 1 c).
Figure 1.
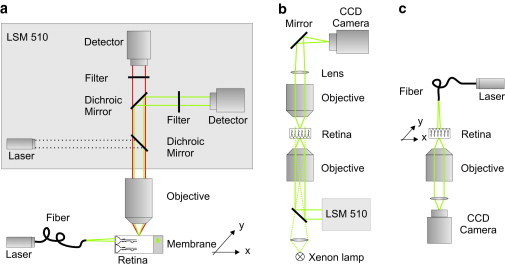
Setups to study the retinal light path. (a) Visualization of the beam path through a retinal cross section. The fluorescent sample, a retinal slice fixed on a nitrocellulose membrane stained with Mitotracker orange, was placed under a water-immersion objective (60×, NA 0.95) of an upright laser-scanning microscope (LSM 510; Zeiss). Confocal images of the evoked fluorescent light (red) were recorded using a confocal channel of the laser-scanning unit (laser 543 nm, green; dichroic mirrors, bandpass filter, detector). An external laser (laser 532 nm, green) was launched into a single mode fiber. The core of the fiber was placed in the focal plane of the objective in front of the vitread surface to illuminate a single Müller cell endfoot. The scattering of the laser light inside the sample (green) was detected by a second channel of the confocal imaging unit (dichroic mirrors, longpass filter, detector). A micropositioning stage (xy stage) moved the sample perpendicular to the light propagation. (b) Bidirectional imaging of retina whole-mount preparations combined with local light-transmission. The retina was spread (photoreceptor side up) onto the bottom of a chamber on the stage of an inverted laser-scanning microscope (LSM 510; Zeiss). The three-dimensional localization of dye-filled Müller cells that were pointed toward the objective (40×, N.A. 1.2) was recorded by confocal detection. Thereafter, the objective was replaced by one with lower numerical aperture (10×, NA 0.3) allowing the illumination of single Müller cell endfeet with laser light under a physiological angle (∼26°). An upright custom-built unit was used to image the opposite (outer) surface of the retina. The laser light transmitted from the photoreceptor outer segments was collected by an objective (63×, N.A. 0.95) and imaged by a convex lens and a plane mirror onto a charge-coupled device chip of a camera. Additionally, the same upright imaging unit allowed the recording of a transmission image of photoreceptor cells by wide-field illumination of the sample with parallel light (Xenon lamp) from below. (c) Spot-light illumination experiments on retinal whole-mount preparations. The retina was spread onto the bottom of a chamber with the photoreceptors pointing toward the objective (63×, NA 1.2) of an inverted microscope. Müller cell endfeet were illuminated by a laser through a single-mode fiber mounted vertically on top of the microscope stage. The glass fiber was moved by a piezo-actuator in steps of 1 μm over a distance of 100 μm. The transmitted laser light was detected by a camera (Zeiss). The fiber had a distance of ∼10 μm from the surface of the tissue.
Beam path visualization through retinal cross section
The light of a laser diode (λ = 532 nm, 20 mW; Laser2000, Munich, Germany) was coupled into a single mode fiber (460HP; Thorlabs, Sterling, VA) that was spliced to the input of a fiber coupler (Thorlabs). One output of the coupler was attached to a power meter (Coherent, Santa Clara, CA) while the second was again spliced to a single mode fiber that was placed in front of the retinal slice to illuminate individual Müller cells. The light intensity was adjusted to P = 90 nW—the light intensity that enters a single endfoot in daylight.
Müller cell endfeet of guinea pig have an average diameter of 10 μm. Thus, single endfeet were illuminated separately when the distance between fiber and endfoot surface was 50 μm or less (the beam divergence limits this distance). The laser wavelength fits to the absorption wavelength of the photopigments of guinea pigs (8). The sample chamber was placed on a micropositioning stage (Märzhäuser, Wetzlar, Germany) under a water-immersion objective (63× NA 0.9; Zeiss, Wetzlar, Germany) of an upright confocal microscope (LSM510; Zeiss). The stage moved the retina in steps of 2 μm along the fiber perpendicular to the light propagation.
A first channel of the laser-scanning microscope (LSM) was used to visualize the fluorescent Müller cells. Because the thick Müller cell endfeet form an almost confluent layer at the inner retinal surface (only interrupted by holes representing the location of retinal ganglion cells and nerve fiber bundles; compare to Fig. 2, c and f, and Fig. 4 a), the location of individual inner Müller cell processes could be safely assessed only in the IPL at position x0, which was located at some distance (∼25 μm) from the retinal surface.
Figure 2.
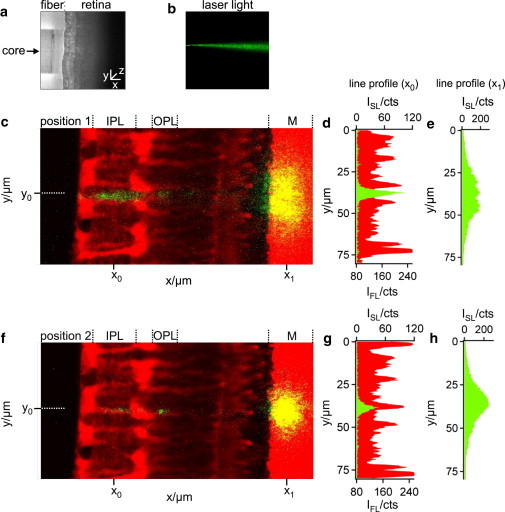
Pathway of light through the vital retina. (a) Position of a single mode fiber (left) in front of the retinal surface (right) recorded by transmission microscopy. (b) The divergent light beam emanating from the core of the glass fiber was visualized by inserting the fiber into an agarose gel that caused scattering of the light (λ = 532 nm, green) in all directions and thus allowed light detection orthogonal to the beam. (c) Slice preparation of a living retina, monitored by using a 63×/0.95 water-immersion objective of an upright confocal microscope. The vital dye, Mitotracker orange (red), predominantly stained the Müller cells, the photoreceptor segments, and the plastic membrane (M). The positioning of the fiber core (dotted line at position y0) between two Müller cell processes caused light scattering in both plexiform layers (IPL, inner plexiform layer; OPL, outer plexiform layer), as demonstrated by the x-line profiles (at position x0) of the cellular fluorescence (IFL, red) and the scattered light intensity (ISL, green) along the IPL (d). The scattered light spots on the membrane (c and f) visualize the light that was transmitted by the retina. Their yellow appearance results from a merge of strong red fluorescence (vital dye sucked up by the membrane) and the green laser light scattering. (e) The x-line profile of ISL along the membrane (at position x1 in panel c) showed a rather wide-spread intensity distribution with a low maximum intensity. (f) In a position where the fiber and the Müller cell process are aligned to each other (along the dotted line at position y0), the scattered beam pattern changed. The almost complete lack of light scattering in the Müller cell processes is represented by a reduced ISL in the IPL (g) and OPL. This was accompanied by a narrowing light spot on the membrane with an increased maximum intensity (h).
Figure 4.
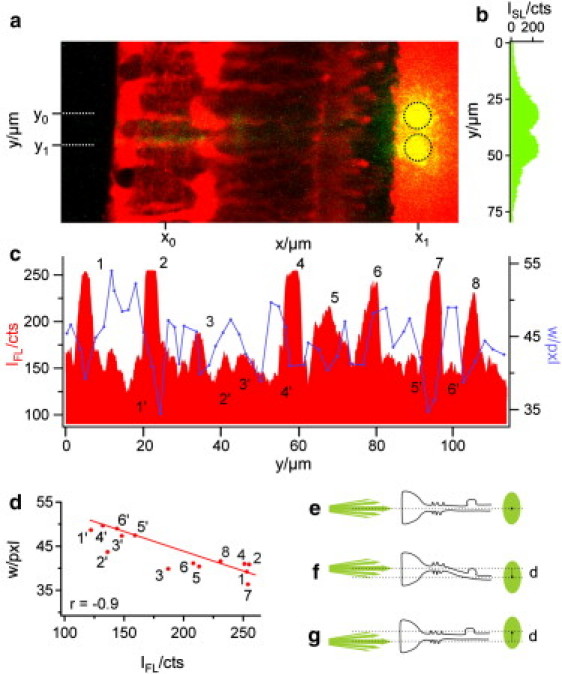
Correlation between intraretinal pathway and beam divergence. (a) Overlay of the cellular fluorescence (red) and the beam scattering (green) at two consecutive fiber positions, y0 and y1 (dotted lines). At both positions, the core of the fiber was placed in front of the cell axis of one of two adjacent Müller cells. The scattering light spot on the plastic membrane formed two distinct areas (indicated by the black circles) with minimal overlap. (b) The line profile of the scattered light intensity ISL at position x1 shows two peaks with nearly the same curve progression and maximum intensity. (c) A line profile of the cellular fluorescence intensity IFL along the IPL (at position x0) was used to localize the y position (and, indirectly, the z position) of the inner stem process of Müller cells in the retinal tissue (red). The intensity peaks 1–8 (red) each represent a distinct Müller cell process in the focal plane of the objective where the core of the fiber was also placed. In contrast, several fluorescence minima (1′–6′) represent interjacent retinal tissue compartments devoid of a Müller cell process. All other (intermediate) fluorescence intensities could not be clearly assigned to one of these two cases. The width w of the light spots at the plastic membrane (blue curve in panel c) indicates the beam divergence on its course through the retina; it was estimated as the y width of a two-dimensional Gauss fit of the transmitted light spot. Comparing the cellular fluorescence intensities (red) with the width values (blue) shows that w was low at the fluorescence peaks (1–8) and high at the fluorescence minima (1′–6′). (d) The width w of the well-defined data points (1–8, 1′–6′, red dots) was plotted against the corresponding fluorescence values of the line profile in panel c. The resulting correlation coefficient was r = −0.9. (e) Schemata of a straight Müller cell, the axis of which does not change in the y and z directions. The beam axis and the endfoot axis as well as the resulting spot center are at the same y position. (f) A “bended” Müller cell causes a displacement d between beam axis and spot center. (g) A displacement also occurs if the beam does not hit the Müller cell axis. Only oblique light rays pass the cell.
A second channel recorded the scattering of the fiber-provided laser light within the retinal tissue. An overlay of both channels was used to observe changes in light scattering and clearly assigned these changes to the beam position with respect to the Müller cell axis. For detailed analysis, we used the software IgorPro (WaveMetrics, Portland, OR). The peaks in the intensity profile along a line (compare to position x0 in Fig. 2, c and f, and Fig. 4 a) were used to localize Müller cells (compare to red curve in Fig. 2, d and g, and Fig. 4 c). For each step we analyzed the scattered spot at the membrane by a two-dimensional Gaussian fit and used its width w (defined as radius in y direction at which the amplitude is reduced to 67%) as a measure of the beam widening, and analyzed the changes of w as function of the beam position with respect to the location of Müller cells.
Transmission measurements
For both-way imaging of the retina, an upright imaging unit was mounted on top of an Axiovert 100M equipped with a laser-scanning unit (LSM 510; Zeiss). Thus, fluorescent confocal images could be acquired from below, while the sample could also be imaged from above in transmission mode using either the xenon lamp of the Axiovert for wide-field illumination, or the stationary-focused laser beam of the laser-scanning unit for localized illumination. The retina was placed with the Müller cell endfeet down. A low numerical aperture objective (10× NA 0.3; Zeiss) was used to project a laser beam at a semiangle of maximal 13°, which corresponds to the physiological angle of the Müller cells. The physiological angle describes the full acceptance angle of the endfoot (∼26°), which can be estimated from the refractive index difference between Müller cell and vitreous body (5).
Confocal images, also taken with the 10× objective, were used for precise positioning of the laser beam onto the retinal surface. Thus, one objective fulfilled two functions, whereby the angle is still below the critical range of the physiological angle. For high-resolution fluorescent imaging, the objective was changed without moving the sample (40× NA 1.2W; Zeiss). The custom-built upright imaging unit consisted of an objective holder with a Zeiss mount (Linos, Göttingen, Germany), a water-immersion objective (63×, NA 0.95; Zeiss), a convex lens (f = 100 mm; Linos), a plane mirror (Linos), and a charge-coupled device camera (Kappa Optronics, Gleichen, Niedersachsen, Germany). The camera was read out using a frame grabber (Georgia Technology, Chung Ho, Taiwan) and WinDVD Creator software (InterVideo, Fremont, CA).
In another series of experiments, a modified setup was used in which the light beam was applied by a glass fiber; for details, see Fig. 1 c and description.
Immunhistology
Retinae from freshly dissected guinea pig eyes were removed and fixed in 4% formaldehyde in phosphate-buffered saline (PBS; 0.1 M, pH 7.4) for 1 h. After rinsing in PBS and blocking with normal donkey serum, the retinal whole-mounts or vertical slices were incubated with primary antibody (whole-mounts: anti-Vimentin, clone V9; Sigma-Aldrich, Steinheim, Germany, and slices: anti-CRALBP; Santa Cruz Biotechnology, Santa Cruz, CA) and biotin-conjugated peanut agglutinin (PNA; Sigma Aldrich) overnight at 4°C. Thereafter, the secondary antibody (anti-mouse or anti-rabbit labeled with Cy3; Jackson ImmunoResearch Laboratories, West Grove, PA) and Streptavidin (Streptavidin labeled with Cy2; Sigma Aldrich) were applied overnight as well. For vertical slice preparations (80 μm), the retina was embedded in Agar (3% in PBS) and was cut with a vibratome.
Results
Visualizing the light passage through intact retinal tissue
To visualize the path of a laser beam through the retinal layers, retinal slices adhering to a strip of nitrocellulose membrane were analyzed on a custom-built confocal microscope-stage (Fig. 1 a). The Müller glial cells, the photoreceptor cells, and the membrane were loaded with the vital dye, Mitotracker orange, and thus easily identified by their red fluorescence (Fig. 2 c). To determine the light path through the retina, we used a single-mode fiber delivering a thin, green laser beam onto the vitread surface of the slices, perpendicular to the optical axis of the microscope. This enabled us to apply a small spot, illuminating individual Müller cell endfeet (Fig. 2, a and b). The green laser light when scattered into the objective was detected by one channel of the confocal microscope. The red fluorescence in the second channel showed the locations of the scattering elements in the retina. In addition to intraretinal scattering, this approach also revealed scattering from the membrane, which thereby served as an artificial screen indicating the spatial distribution of transmitted light.
Light passes through Müller cells without apparent scattering
When the retina was moved horizontally, perpendicular to the single-mode fiber, two different situations alternated. If the fiber positioned at y0 was not centered in front of a Müller cell endfoot, considerable light scattering occurred within the retinal tissue, particularly in the inner and outer plexiform layers (Fig. 2, c and d, y-line profile of red fluorescence and green laser light at position x0). Due to intraretinal light scattering, a comparatively large area of the membrane was illuminated with low maximum intensity (Fig. 2, c and e, y-line profile of the laser light at position x1). However, when the retina was moved into a position where the center of a Müller cell endfoot was directly placed in front of the fiber core (i.e., when the laser beam and a Müller cell were coaligned), transretinal light propagation changed (Fig. 2 f). There was a distinct decline in scattering in the inner plexiform layer when the light passed through the inner stem process of the Müller cell (Fig. 2, f and g). The transmitted light projected on the membrane displayed a smaller spot size, sharp boundaries, and a higher maximum intensity (Fig. 2, f and h).
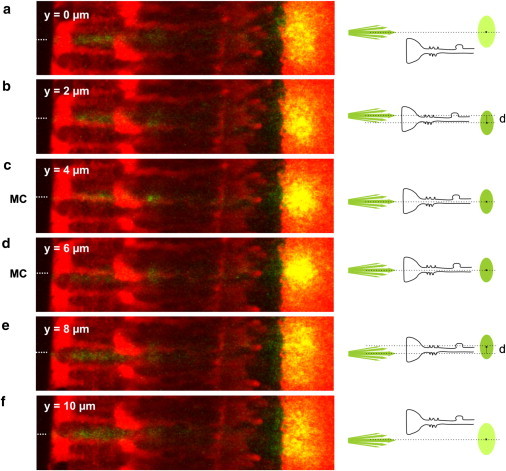
Thus, light was subject to significantly less scattering when passing through a Müller cell and the transmitted light was now confined to a small area of high local light density. This is illustrated in more detail in Fig. 3, which shows the effects of a stepwise motion of the retina along the fiber tip. Starting from a position where the fiber was not placed in front of a Müller cell center (Fig. 3 a), the prominent scattering in the inner plexiform layer decreased when the retina was moved to a position where fiber and Müller cell were coaligned. In this position, the transmitted light spot became smaller and more intense (Fig. 3 b). After a few further steps, no Müller cell was present in front of the fiber tip and the light transmitted to the membrane appeared as a diffusely distributed, wide spot. The green appearance of the inner plexiform layer returned, which confirms that considerable light scattering occurs in the inner plexiform layer if no Müller cell lies in the light path (Fig. 3, c–e). These effects were even more obvious in the case of a second Müller cell, which strong red fluorescence indicated that the cell was localized in the focal plane of the objective. Here the fiber core and the Müller cell were aligned at the same z level (Fig. 3 f). Some additional steps in the y direction abolished this alignment and the effect disappeared (Fig. 3, g and h).
Figure 3.
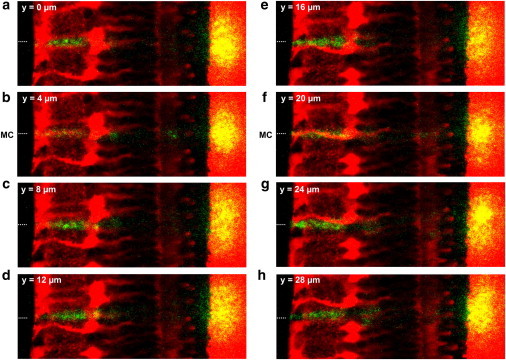
Müller cells bias the transretinal light path. (a–h) Overlay of a fluorescent retinal slice (red) and the scattering of the laser light (green, yellow) applied by a thin glass fiber in front of the retinal surface (position indicated by a dotted line). When the retina was moved in equal steps of 2 μm (every second position is shown) along the optic fiber, the laser scattering in the retina (green) and the scattering of the transmitted light at the membrane (yellow) changed in dependence upon the presence of a Müller cell in the light path. (b and f) If the center of a Müller cell was positioned in front of the fiber core (indicated by MC in front of the retinal surface), the intensity of light scattering in the IPL was reduced. In addition, the transmitted light was confined to a small area and became more intense. (f) These effects were most obvious if a Müller cell was in the focal plane of the objective (indicated by its strong red fluorescence), i.e., at the same z level where the fiber core was placed.
Light passage through Müller cells suppresses beam widening
These observations support the hypothesis that Müller cells also act as light-guiding fibers in vivo. We thus compared the projection areas resulting from the consecutive positioning of the fiber core in front of two adjacent Müller cells. When the resulting two images were overlayed, two distinct projection areas became visible at the image plane of the membrane, with only small overlap (Fig. 4, a and b). At the end of its transretinal path (i.e., at the plane of the membrane), the beam diameter was the same as the average diameter of a Müller cell endfoot (the structure where light enters the retina). Accordingly, the distance between the maxima of the two projection areas corresponded to the average distance between the axes of two neighboring Müller cells (Fig. 4 a, compare to Fig. 9 b). This required the conservation of the beam diameter, a defining feature of wave guides.
Figure 9.
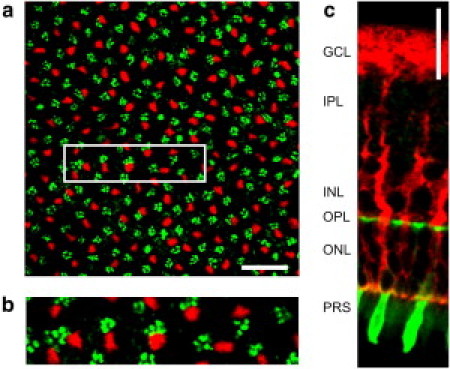
Quantitative (immuno-) histochemistry of Müller cells and cone photoreceptor cells. (a) Confocal image of a retinal whole-mount preparation at the level of the OPL. In this layer the outer processes of Müller cells (labeled by antibodies directed to the intermediate filament vimentin, red) and the cone pedicles (labeled by cone-specific fluorescent peanut agglutinin, PNA, green) are visible. Scale bar, 20 μm. The magnified inlet (b) demonstrates a spatial colocalization of both structures. (c) Slice preparation of a retina that shows the endfoot funneling into the Müller cell process that finally forms thin branches enveloping a soma of a cone cell. This cell was identified as a cone because of its PNA-labeled inner segment. Scale bar 20 μm. (Ganglion cell layer (GCL), inner plexiform layer (IPL), outer plexiform layer (OPL), outer nuclear layer (ONL), photoreceptor segment layer (PRS).)
In our setup the light beam emanating from the fiber was divergent; its y dimension—or width—increased with the distance in a fluid compartment (Fig. 2 b). The scattered spot on the membrane enabled us to estimate the beam divergence within the retina. We analyzed this spot by a two-dimensional Gaussian fit and used its width w as a measure of the beam waist, and analyzed the changes of w as a function of the beam position with respect to the location of Müller cells. The peaks in the fluorescence profile along a line at position x0 (Fig. 4 a), plotted in red in Fig. 4 c, represent the localization of the stem processes of Müller cells.
Six such peaks (1, 2, 4, 6, 7, and 8) are visible in Fig. 4 c, indicating the processes of six Müller cells. Two more Müller cell processes are slightly out of the z focus, but still cause (less dominant) fluorescence peaks (peaks 3 and 5). Additionally, six areas of low fluorescence were representative for retinal tissue between the Müller cells (1′–6′ in Fig. 4 c). For each y position of the fiber, the beam width w at the level of the membrane was plotted into the same diagram (blue line in Fig. 4 c). Indeed, areas of small width coincide with Müller cells whereas areas of large width are found between the Müller cells. A quantitative evaluation resulted in a correlation coefficient r of −0.9 (Fig. 4 d).
Only Müller cells that were perfectly aligned and centered along the laser axis projected the beam to the same y position from where it arose (compare to Fig. 4, e and c: cells numbered 1 and 7). In other cases, there was a slight y axis displacement between the axis of the glass fiber and the minimum of w (e.g., cells numbered 2, 6, and 8 in Fig. 4 c). If Müller cells are wave guides, these displacements can be explained by two effects: First, curved Müller cells will redirect the beam (Fig. 4 f). Second, if the beam fails to hit the Müller cell in its center, only divergent light rays (i.e., with an angle to the laser beam axis) are guided and the spot consequentially must be displaced by this angle with respect to the beam axis (Fig. 4 g).
This case was studied by a detailed analysis of the image sequence for individual Müller cells whose orientation varied neither in y nor in z direction, such as shown in Fig. 5. Starting from a retina position where the beam did not hit the center of a Müller cell endfoot (Fig. 5 a), the retina was moved, relatively to the light source, in micrometer steps in y direction, i.e., perpendicular to the light propagation. When the fiber illuminated an endfoot region closer to the axis of the inner stem process, the transmitted spot became brighter and showed a slight displacement against the beam axis as expected for a coupling condition where the laser beam does not hit the central part of the wave guide (Fig. 5 b). When the laser beam hit the center of the cell, the spot was brightest and showed no y displacement, which agrees with ideal coupling conditions (Fig. 5, c and d). The laser beam then left the center again; the spot became less bright and now showed the expected opposite displacement from the beam axis (Fig. 5 e). Finally, most of the laser beam bypassed the Müller cell and the spot became broad, weak, and diffuse, as expected for a situation without light guidance (Fig. 5 f).
Figure 5.
Coupling efficiency of a light-guiding Müller cell. (a–f) A perfectly straight Müller cell was chosen for the experiment; it was moved in 2-μm steps perpendicular to the divergent light beam to investigate the effects for different coupling conditions into a Müller cell (illustrated in right schemata). (a and f) When the laser light illuminates a region between two Müller cells, no light is guided. The situation corresponds to that in Fig. 2c. (b and e) If the retina was moved to a region close to the center of a Müller cell, only oblique light rays enter the Müller cell. The transmitted spot intensity increased and the spot was displaced (b, below the beam axis; e, above the beam axis). (c and d) For ideal coupling conditions, the laser beam hits the center of a Müller cell. The spot intensity became brightest and no displacement was observed.
All results obtained on retinal slice preparations (Figs. 2–5) confirm that Müller cells act as wave guides in their natural environment, transporting light to the photoreceptor cells.
Each Müller cell delivers light to a limited receptor-field
To observe the light arriving at the photoreceptor cells (which are light-guiding structures by themselves (9)), we developed a setup that illuminates the retina in the physiological direction of light propagation, allowing us to image the retina simultaneously from both surfaces by using two opposing microscope objectives (Fig. 1 b). The inner (vitread) retinal surface was placed pointing toward a conventional confocal microscope. The second microscope replaced the condenser of the first one and imaged the outer surface. The confocal microscope was used, 1), to create high-resolution, optically sectioned fluorescent images of the inner part of the retina; and 2), to illuminate the retina such that transmission-mode images were obtained by the opposing objective. Fig. 6 a shows a maximum intensity projection of a confocal stack displaying the Müller cells, which are labeled in red. Fig. 6 b shows the according intersecting slice at the position of the dotted line in Fig. 6 a. These two images provided detailed information about shape, position, and orientation of the Müller cells (Fig. 6, a and b). The bold dots on the dashed green line in Fig. 6 b represent two locations of small-diameter illumination, one positioned above a Müller cell (Fig. 6 b, step 27) and one in an area between Müller cells (Fig. 6 b, step 19). Projection of light onto an endfoot center (Fig. 6, a and b, step 27) resulted in a bright illumination of a small cluster of photoreceptor cells as shown in Fig. 6 d. In contrast, placing the beam at the periphery of an endfoot (Fig. 6, a and b, step 19) caused a broadly dispersed, barely detectable illumination of several randomly scattered cells (Fig. 6, c and e).
Figure 6.

Double-sided imaging of retina whole-mount preparations combined with local light-transmission. (a) The x-z view of a confocal stack of fluorescent images of retinal tissue stained with Mitotracker green, acquired using a 40×/1.2 W objective. Shown is a maximum y projection across seven pixels (corresponding to 2.4 μm) around the line indicated in panel b. The endfeet (top) and processes of the Müller cells are clearly visible. (Green triangles) Positions at which the laser beam was focused onto the tissue; (white line) z position of the image in panel b. (b) Confocal x-y image of the same tissue shown in panel a, acquired with a 10×/0.3 objective. This image was used to position the laser beam (positions indicated by green circles). The transmission images corresponding to the two larger spots are shown in panels c and d. (c and d) Transmission images acquired with the upright imaging unit while the laser focus was either placed in the periphery at Müller cell endfoot (c) or on top of a Müller cell process (d). The scale is identical to the scale used for panels a and b; both images show the same field of view. (e and f) Transmission images shown in panels c and d (green) superimposed with an overview image (red) acquired with the same camera during wide-field transmission-mode illumination of the retina's inner surface.
The laser beam of an optical fiber was then moved over the Müller cell endfeet at the inner retinal surface, and the illuminated photoreceptor cells were observed at the opposite surface (see setup in Fig. 1 c). When the fiber was stepwise moved ahead, the pattern of illuminated groups of photoreceptor cells frequently changed in jumps, but this did not occur after every step (Fig. 7, a and b). Generally, the illumination pattern followed the direction of the movement of the fiber, but sideward-deviations occurred in addition to backward-jumps. This likely reflects the morphology of Müller cells that, as biological objects, are not all oriented exactly perpendicular to the retinal surface (compare to, e.g., Fig. 7 a). Sometimes two or even three small groups of photoreceptors appeared to be illuminated simultaneously, and this could reflect the positioning of the beam over two or three adjacent Müller cell endfeet (Fig. 8).
Figure 7.
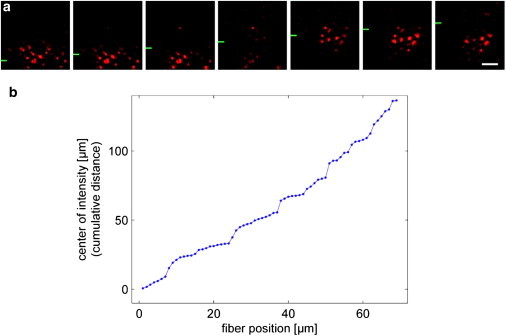
Local light-transmission experiments on retinal whole-mount preparations. (a) Illumination of distinct groups of photoreceptor cells by a light beam directed to the vitread surface of a retina (compare to Fig. 1c). While the fiber was moved in equal steps (1 μm, every second position shown) into the y direction (the y position of the fiber is indicated by green bars at the left side), the field of illuminated photoreceptor cells changes in a discontinuous manner. Scale bar 5 μm. This is quantitatively analyzed in panel b, where the cumulative distance of the field center (center of gravity of the intensities), plotted against the y position of the fiber tip, shows discrete steps.
Figure 8.
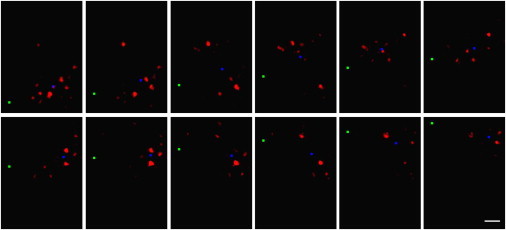
Biased light propagation through the retina. Laser light emanating from a glass fiber was projected onto the retina from the vitread side (compare to Fig. 1c). (Green square) The y position of the fiber that was moved in equal steps of 1 μm across the retinal surface (every second position shown). (Red) Resulting light pattern at the receptor side of the retina. Unlike the fiber, the pattern of illuminated photoreceptor cells moves rather irregularly; large jumps alternate with sequences of stationarity. In some positions, more than one photoreceptor group was illuminated. (Blue square) Center-of-intensity calculated for each frame after background substraction. The locations of these points were used for the plot of cumulative distances in Fig. 7b. Scale bar 5 μm.
Thus, in intact retinal tissue, each Müller cell is able to guide light from its endfoot toward a small group of adjacent photoreceptor cells that may be called its illuminated receptor-field. Counts of such groups of simultaneously illuminated photoreceptor cells resulted in an average group size of 10–12 cells (Figs. 6 d, 7 a, and 8). This coincides with the number of photoreceptor cells statistically belonging to one Müller cell in the guinea pig retina, suggesting that every Müller cell (at least, predominantly) guides light toward its adjacent array of photoreceptor cells, as members of the same ontogenetically organized functional retinal microcolumn (10). From a physiological perspective, this poses the question of how many cones are illuminated by a Müller cell, as it is the cone-driven photo-optic circuit that is responsible for visual acuity, i.e., for spatial resolution of the perceived image.
Correlation between Müller cells and cone photoreceptors
Cell type-specific double-labeling of Müller cells (by antibodies directed to vimentin) and of cone photoreceptor cells (by fluorescent peanut agglutinin, PNA) in the retina revealed that the Müller cells and cones match in location and density (Fig. 9 a). This was observed at every retinal region, despite decreasing absolute densities of both cell types from center toward the periphery (Table 1). The counts were made in the outer plexiform layer where the synaptic terminals (pedicles) of the cones are localized. Here, Müller cell processes and cone pedicles frequently were arranged as closely adjacent pairs (Fig. 9 b). In addition, in many instances a Müller cell and a cone appeared to be aligned in series when the same double-labeling procedure was applied to radial retinal sections (Fig. 9 c). This close coalignment has already been observed by an early pioneer of retina morphology. He considered the connection so strong that he misinterpreted Müller cells as processes and integral parts of the cones (11). Our results clearly suggest that, on average, every cone is coupled to a Müller cell as an individual light guide.
Table 1.
Local densities of cones and Müller cells in the guinea pig retina
| Area | Cones (mm−2) | Müller cells (mm−2) | Cone/Müller cell ratio |
|---|---|---|---|
| Central | 25.410 ± 1.975 | 17.310 ± 1.126 | 1.50 ± 0.13 |
| Midperipheral | 25.950 ± 3.295 | 16.810 ± 1.136 | 1.55 ± 0.17 |
| Peripheral | 23.820 ± 3.467 | 16.550 ± 1.562 | 1.45 ± 0.24 |
Histochemically stained cones and Müller cells were counted in the central, midperipheral, and peripheral areas of guinea pig retinae (n = 5). Absolute cell densities vary among the retinal regions whereas the cone/Müller cell ratio remains virtually constant at 1.5 (mean values ± SDs).
Discussion
Here we show that Müller cells minimize intraretinal light scattering and maintain the light-beam diameter (Figs. 2–4). The cells also display the coupling characteristics of a wave guide (Fig. 5). Together this provides clear evidence for the light guiding capability of Müller cells not only as isolated elements (5) but also within the intact retina. Each Müller cell guides light to a defined, nonoverlapping area at the photoreceptor plane that contains, on average, ∼10 photoreceptor cells including one cone. Müller cells channel virtually all light from one side of the retina to the other, despite the fact that Müller cell processes occupy <10% of the retinal cross-sectional area and tissue volume (12).
There are two proposed physiological functions of this array of light-guiding Müller cells (5): First, it will increase the number of photons arriving in the photoreceptor cell outer segment and, thus, contribute to a high sensitivity of the rods during night vision. Second, it improves the contrast sensitivity of vision by enhancing the signal/noise ratio in the cone arrays. Moreover, this high light intensity facilitates the detection of fast-moving objects (5,6). Maximum possible resolution is achieved because, for each cone, there exists an individual light-guiding Müller cell. Comparing this to a video camera each pixel on the camera chip would be connected to its own wave guide. Thus, resolution is actually limited by the cone spacing, but not by the density, of Müller cells.
This arrangement matches with the actual physiological limit of visual acuity that is determined by the density of cone-driven retinal ganglion cells (13–16). Each of these contrast-sensitive retinal ganglion cells collects information from one or a few cones (17) such that it is definitely sufficient if, on average, every cone is endowed with one Müller cell as its individual light guide.
Beyond this basic pattern, two remarkable specifications can be found in vertebrate retinae. One is the primate fovea, where the light directly hits the photoreceptors and where Müller cell-provided light guidance is thus dispensable. It is noteworthy, however, that even the foveal Müller cells are involved in light and image transport, as their endfeet provide a plain, unruffled vitread surface of the retina (i.e., a smooth cover-slide on the cone photoreceptors to avoid irregular light scattering). Furthermore, the maximum size of the primate fovea is limited for constructive reasons (18) such that high-acuity vision without Müller cell-provided light guidance to individual cones must remain a small, local exception within the total retinal area.
Another adaptation appears to be required in nocturnal mammals where the high spatial density of rod photoreceptor cells compels a thick, multilayered outer nuclear layer in which the outer Müller cell processes are very thin. Here, the columnar arrangements of photoreceptor cell nuclei act as stacks of lenses (19,20) to safely transport light from the Müller cell stem processes toward the photoreceptor cells.
Although our data were obtained from the guinea pig as a representative of mammals, it is intriguing to speculate that Müller cell-derived light guidance toward distinct groups of photoreceptors (particularly, cones) might be a phylogenetically old mechanism, ameliorating the optical shortcomings of the inverted vertebrate retina. It has been shown that the optical properties (refractive indices) of frog Müller cells are very similar to those of mammalian cells (5) and that in fish retina, there is a constant 1:1 ratio between Müller cells and the smallest complete sets of cone photoreceptors (i.e., mosaics) (21). This may have enabled vertebrates to develop a highly sophisticated retina with superior densities of elongated (i.e., photopigment-rich) photoreceptors—supplied by a highly effective choroid blood-vessel system (22). In particular, this arrangement provides an advantage for the positioning of the neuronal circuitries. The circuits can be already placed in the retina, at the root of the pathway to the brain, because as much as 90% of the retinal volume is spared by the light-guiding Müller cells that, additionally, metabolically sustain these neurons (23). This configuration appears to be a remarkable evolutionary success that might originate from the primitive cutaneous nervous systems of ancestral deuterostomes (e.g., starfish) that already were endowed with a lattice of radial glial cells from which the retinal Müller glial cells developed (10).
Acknowledgments
We are grateful to K. Franze, J. Guck, and S.N. Skatchkov for helpful comments and discussions.
The work presented in this article was supported by grants provided by the Deutsche Forschungsgemeinschaft Research Training School “Interneuro” (GK1097) to S.A., E.U., A.W., J.A.K., and A.R.; the Deutsche Forschungsgemeinschaft Research Center Molecular Physiology of the Brain to S.J.; and the Cluster of Excellence 171 to D.S.
References
- 1.Kröger R.H., Biehlmaier O. Space-saving advantage of an inverted retina. Vision Res. 2009;49:2318–2321. doi: 10.1016/j.visres.2009.07.001. [DOI] [PubMed] [Google Scholar]
- 2.Nguyen-Legros J., Hicks D. Renewal of photoreceptor outer segments and their phagocytosis by the retinal pigment epithelium. Int. Rev. Cytol. 2000;196:245–313. doi: 10.1016/s0074-7696(00)96006-6. [DOI] [PubMed] [Google Scholar]
- 3.Brudenall D.K., Schwab I.R., Graydon M.L. Optimized architecture for nutrition in the avascular retina of Megachiroptera. Anat. Histol. Embryol. 2007;36:382–388. doi: 10.1111/j.1439-0264.2007.00779.x. [DOI] [PubMed] [Google Scholar]
- 4.Goldsmith T.H. Optimization, constraint, and history in the evolution of eyes. Q. Rev. Biol. 1990;65:281–322. doi: 10.1086/416840. [DOI] [PubMed] [Google Scholar]
- 5.Franze K., Grosche J., Guck J. Müller cells are living optical fibers in the vertebrate retina. Proc. Natl. Acad. Sci. USA. 2007;104:8287–8292. doi: 10.1073/pnas.0611180104. [DOI] [PMC free article] [PubMed] [Google Scholar]
- 6.Labin A.M., Ribak E.N. Retinal glial cells enhance human vision acuity. Phys. Rev. Lett. 2010;104:158102. doi: 10.1103/PhysRevLett.104.158102. [DOI] [PubMed] [Google Scholar]
- 7.Chen E. Refractive indices of the rat retinal layers. Ophthalmic Res. 1993;25:65–68. doi: 10.1159/000267223. [DOI] [PubMed] [Google Scholar]
- 8.Parry J.W., Bowmaker J.K. Visual pigment coexpression in guinea pig cones: a microspectrophotometric study. Invest. Ophthalmol. Vis. Sci. 2002;43:1662–1665. [PubMed] [Google Scholar]
- 9.Enoch, J. M., and F. L. Tobey, jr. (editors). 1981. Vertebrate Photoreceptor Optics. Springer, Berlin, Heidelberg, New York.
- 10.Reichenbach A., Robinson S.R. Phylogenetic constraints on retinal organization and development. Prog. Retin. Eye Res. 1995;15:139–171. [Google Scholar]
- 11.Police G. Morphological interpretation of radial fibers in the retina of vertebrates [Sull'interpretazione morfological delle fibre radiali nella retina del vertebrati] Arch. Zool. (Torino) 1932;17:449–493. [Google Scholar]
- 12.Reichenbach A., Hagen E., Eberhardt W. Quantitative electron microscopy of rabbit Müller (glial) cells in dependence on retinal topography. Z. Mikrosk. Anat. Forsch. 1988;102:721–755. [PubMed] [Google Scholar]
- 13.Arrese C., Dunlop S.A., Beazley L.D. Retinal structure and visual acuity in a polyprotodont marsupial, the fat-tailed dunnart (Sminthopsis crassicaudata) Brain Behav. Evol. 1999;53:111–126. doi: 10.1159/000006588. [DOI] [PubMed] [Google Scholar]
- 14.Jacobs G.H., Calderone J.B., Williams G.A. Visual adaptations in a diurnal rodent, Octodon degus. J. Comp. Physiol. A Neuroethol. Sens. Neural Behav. Physiol. 2003;189:347–361. doi: 10.1007/s00359-003-0408-0. [DOI] [PubMed] [Google Scholar]
- 15.Northmore D.P., Oh D.J., Celenza M.A. Acuity and contrast sensitivity of the bluegill sunfish and how they change during optic nerve regeneration. Vis. Neurosci. 2007;24:319–331. doi: 10.1017/S0952523807070307. [DOI] [PubMed] [Google Scholar]
- 16.Rossi E.A., Roorda A. The relationship between visual resolution and cone spacing in the human fovea. Nat. Neurosci. 2010;13:156–157. doi: 10.1038/nn.2465. [DOI] [PMC free article] [PubMed] [Google Scholar]
- 17.Sjöstrand J., Olsson V., Conradi N. Quantitative estimations of foveal and extra-foveal retinal circuitry in humans. Vision Res. 1999;39:2987–2998. doi: 10.1016/s0042-6989(99)00030-9. [DOI] [PubMed] [Google Scholar]
- 18.Franco E.C., Finlay B.L., Crowley J.C. Conservation of absolute foveal area in New World monkeys. A constraint on eye size and conformation. Brain Behav. Evol. 2000;56:276–286. doi: 10.1159/000047211. [DOI] [PubMed] [Google Scholar]
- 19.Solovei I., Kreysing M., Joffe B. Nuclear architecture of rod photoreceptor cells adapts to vision in mammalian evolution. Cell. 2009;137:356–368. doi: 10.1016/j.cell.2009.01.052. [DOI] [PubMed] [Google Scholar]
- 20.Kreysing M., Boyde L., Chalut K.J. Physical insight into light scattering by photoreceptor cell nuclei. Opt. Lett. 2010;35:2639–2641. doi: 10.1364/OL.35.002639. [DOI] [PubMed] [Google Scholar]
- 21.Mack A.F. Evidence for a columnar organization of cones, Müller cells, and neurons in the retina of a cichlid fish. Neuroscience. 2007;144:1004–1014. doi: 10.1016/j.neuroscience.2006.10.029. [DOI] [PubMed] [Google Scholar]
- 22.Yu D.Y., Cringle S.J. Oxygen distribution and consumption within the retina in vascularized and avascular retinas and in animal models of retinal disease. Prog. Retin. Eye Res. 2001;20:175–208. doi: 10.1016/s1350-9462(00)00027-6. [DOI] [PubMed] [Google Scholar]
- 23.Reichenbach A., Bringmann A. Springer; New York-Dordrecht-Heidelberg-London: 2010. Müller Cells in the Healthy and Diseased Retina. [Google Scholar]