

Abstract
Changes in the clustering of surface receptors modulate cell responses to ligands. Hence, global measures of receptor clustering can be useful for characterizing cell states. Using T cell receptor for antigen as an example, we show that k-space image correlation spectroscopy of quantum dots blinking detects T cell receptor clusters on a scale of tens of nanometers and reports changes in clustering after T cell activation. Our results offer a general approach to the global analysis of lateral organization and receptor clustering in single cells, and can thus be applied when the cell type of interest is rare.
Quantum dots (QDs) are stable, bright fluorescent labels and, despite the fact that they exhibit intermittent fluorescence, i.e., blinking, they have been used in microscopy for imaging of surface receptors and for tracking their diffusion over the surface (1,2). We have found that QD blinking itself is a useful parameter for characterizing the nanometer-scale organization of the T-cell receptor (TCR) for antigen. The blinking statistics differentiate small clusters of QDs from a single QD or large clusters, and thus function as reporters of nanometer-scale changes in QD-labeled TCR organization after T cell activation by antigen.
Studies of QDs, on a surface using AFM to resolve QD and fluorescence to image their blinking, show that the blinking of a single QD shows persistent autocorrelation over time due to power law emission statistics; there are variable on- and off-periods of fluorescence emission that span many orders of time. The blinking of clusters of many QDs also exhibits persistent autocorrelation in time. On the other hand, blinking of small groups of QDs separated by a few tens of nanometers is poorly correlated. There are frequent transitions between fluorescent and nonfluorescent states, apparently due to Förster resonance energy transfer interactions between individual dots (3–5).
It has been reported that TCRs of naïve, unstimulated T cells are present as a mixture of monomers and small oligomers (6,7), which form larger clusters when cells are activated by a specific antigen (8,9). If this is correct, then we expect that blinking of QD labeling TCRs will shift from relatively uncorrelated (the signature of small numbers of QD in nanometer proximity on labeled TCR oligomers) to highly time-correlated (the signature of larger QD clusters labeling clustered TCR).
QD blinking was characterized using k-space image correlation spectroscopy (kICS) (10) (developed by D.K. and P.W.W.). kICS characterizes the photophysics and distribution of fluorescence for large regions or entire cells, by calculating changes in k-space time correlation functions calculated from image series. The kICS analysis yields a temporal autocorrelation function for probe blinking, 〈Θ(t) Θ(t+τ)〉, where Θ = 1 if a QD is fluorescent and Θ = 0 if it is not (Fig. 1 A), averaged over the image series in both space and time. The kICS correlation function amplitude is directly proportional to the mean number of fluorescent entities per image area as well as the amplitude of correlated photophysical fluctuations (10). The decay of the blinking autocorrelation is characterized in terms of a Θ-ratio, the ratio of the correlation amplitude for the longest and shortest lag times (τ) observed.
Figure 1.
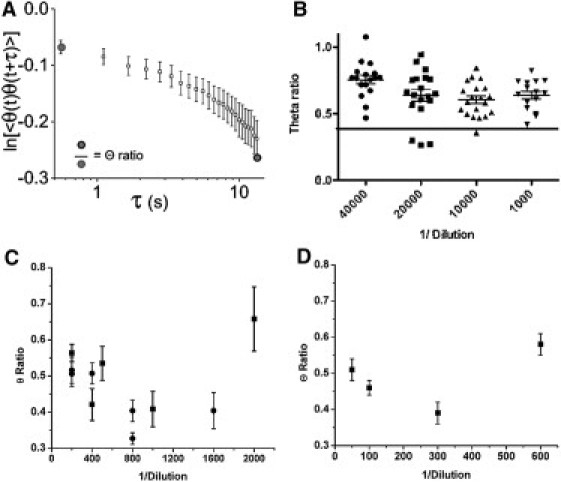
(A) Θ-ratio compares the correlation amplitude at long lag times to that at short lag times. (B) The Θ-ratios for blinking of QDs diluted in buffer, and adhered on glass. Dilutions are from the nominal stock concentration, 1 μM. Spots blinking rapidly and chaotically, as expected from small numbers of QDs in nanometer proximity, are found in the intermediate dilutions. The Θ-ratios for these rapidly blinking spots lie below the horizontal line that defines the lowest 5% of all values. (C) Changes in Θ-ratio of CD8+ 2C T cells labeled with biotin-MHC/peptide followed by streptavidin QDs. The Θ-ratio for cells decreases with increasing dilutions of QDs but at further dilution increases again. This is consistent with the finding that small numbers of QDs within nanometer proximity of one another blink more chaotically than large clusters of QDs or a single QD. Data are pooled from two experiments. (D) Changes in Θ-ratio of CD4+ 5CC.7 T cells labeled with biotin anti-CD3 Fab followed by streptavidin QDs. The trend in Θ-ratio is the same as that seen for CD8+ T cells. The high value of Θ-ratio at the greatest dilution is consistent with labeling by a single QD. CD8+ cells were labeled six days after stimulation. CD4+ cells were labeled three days after stimulation; they also differ from CD8+ in number of TCRs. Hence, the difference in number of QDs bound at a given dilution.
We first used kICS to see if clustering QDs in buffer alters their blinking in the same way as described for QDs in plastic (3). QDs in buffer, immobile and adhered on glass, were imaged over a range of concentrations. Blinking of individual fluorescent spots was easily seen, especially at the lowest concentration of QDs. Quantifying this blinking by kICS, we expected to see high Θ-ratios for high concentrations of QDs, because at high concentrations, each fluorescent spot contains many QDs, whereas at the lowest concentration used, single spots are likely to represent a single QD and again will yield high Θ-ratios. Intermediate concentrations of QDs will yield some spots that contain two or three QDs within Förster resonance energy transfer proximity and so yield low Θ-ratios. This proved to be the case (Fig. 1 B). About 5 percent of the spots gave Θ-ratios <0.5. We also found the same effect when T cells were labeled with saturating amounts of biotin MHC/peptide and then with dilutions of QDs (Fig. 1, C and D). Whatever the distribution of TCR, we expect that as QDs are diluted, fewer and fewer clusters of TCR will be labeled with multiple QDs until at a limiting dilution there is only one (or no) QD per TCR cluster.
We next used TCR transgenic T cells to test the model prediction that a single QD will show highly correlated blinking and high Θ-ratios (3). The TCRs of CD8+ 2C T cells were specifically labeled to saturation with monomeric biotin-MHC/peptide H2Kb/SIY, followed by dilutions of streptavidin-conjugated QD655 (see Methods, below). Labeled cells were imaged at ∼0.5 s intervals for ∼3 min. If the model holds for labeled T cells, then we expect a progressive decrease in Θ-ratio, followed by an increase when we reach the limit of one QD per TCR cluster. This proved to be the case both for 2C TCR CD8+ T cells and for 5CC.7 CD4+ T cells (labeled with anti-CD3-biotin +QD). This reinforces our interpretation that the rapid decay of 〈Θ(t) Θ(t + τ)〉 autocorrelation reports small clusters of TCR on naïve T cells and the slow decay of 〈Θ(t) Θ(t + τ)〉 is consistent with aggregation of receptor microclusters, or with their dispersion to single receptors.
Naïve CD8+ 2C T cells stimulated by antigen in vitro activate, proliferate, and acquire lytic effector function over a 4–6 day time-course. We followed the changes in Θ-ratio as a measure of TCR organization in a population of 2C T cells after in vitro stimulation. The mean Θ-ratio increased significantly within a day of stimulation, remained high for days 2–5, and dropped at day 6 (Fig. 2). The Θ-ratio rose again after the cultures were stimulated with T cell growth factors on day 6 (data not shown). The lower values of Θ-ratio for naïve cells as compared to activated cells are consistent with antigen-independent clustering of small numbers of TCR on a scale of tens of nanometers, an organization suggested by electron microscopy (7), though not observable using standard light microscopy techniques. kICS also measures intensity and larger-scale clustering of label (number of fluorescent spots per unit cell surface area), degree of aggregation, and its diffusion. These changed as implied by the higher Θ-ratios. Degree of aggregation increased ∼20× from day 0 to day 3, whereas diffusion decreased ∼5-fold from 2.5 × 10⁻³ μm2 s−1 to 0.5 × 10⁻³ μm2 s−1. All these values are also consistent with published reports of increased TCR microclustering associated with T cell activation (8,9).
Figure 2.
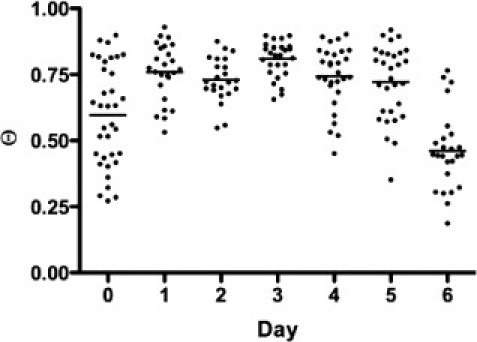
Small-scale clustering of TCR after in vitro T cell activation. The Θ-ratio for naïve cells is significantly (p < 0.001) lower than Θ-ratio for day-3 activated T cells. Also, there is a significant (p < 0.0001) linear trend of increasing Θ-ratio over time.
kICS and specific QD labels allow characterization of nanoscale TCR clustering and inferences about functional activity by sampling thousands of spots of fluorescence on as few as 20–50 cells. As noted above, the system also yields data about larger-scale clustering. Although the range of measured Θ-ratios (0–1) is limited and a given Θ-ratio may reflect clustering or a monomeric state, if all parameters are used, the technique can be as a tool for distinguishing T cell subsets differing in receptor sensitivity, organization, and response to ligand. More generally, our approach offers the possibility of monitoring many types of receptors and a wide range of cell biological responses to stimuli.
Methods
In vitro activation
Naïve 2C T cells were purified from spleens of 2C transgenic mice using a Murine T Cell CD8 Subset Column Kit (R&D Systems, Minneapolis, MN). T cells were activated on irradiated alloreactive splenic stimulator cells from BALB/c mice, then cultured in RPMI media (Sigma-Aldrich, St. Louis, MO), supplemented with 10% fetal calf serum and conditioned medium containing IL-2 and growth factors. Fresh medium was at days 0, 3, and 6. CD4+ T cells were purified from spleens of 5C.C7 mice (Taconic Farms, Germantown, NY) The studies have been reviewed and approved by the Institutional Animal Care and Use Committee at Johns Hopkins University.
Labeling CD8+
T cells were labeled using H2-SIY Kb monomer (National Institutes of Health Tetramer Facility, Atlanta, GA), which has been shown to bind stably to 2C cells (11), at a concentration of 2 μg/2–5 × 106 T cells in 100 μl phosphate-buffered saline (PBS) for 30 min on ice and then washed once with 2 ml PBS, followed by 10 nM streptavidin-coated QD655 (Invitrogen, Carlsbad, CA) in 100 μl PBS incubated for 30 min at 0°C. Labeled cells were then washed 2× with 2 ml PBS before imaging. Labeling was specific; H2Kb monomer loaded with three different noncognate peptides (TSINFVK, SSIEFARL, and SSYRRPVG) did not label 2C cells as detected by either microscopy or flow cytometry. Although streptavidin QD655 is nominally polyvalent, a comparison of QD bound to T cells with antibody labeling of TCR (Stone and Stern (11) and our data, not shown) indicated that most QD bound monovalently. CD4+ T cells were labeled with biotin-anti-CD3 mAb and streptavidin QD655.
Imaging
Cells were imaged using a 3-I Marianas Live Cell Imaging Workstation (Intelligent Imaging Innovations, Denver, CO) equipped with dual Cascade II 512 electron-multiplying charge-coupled device cameras (Photometrics, Tucson, AZ). Each image in a series of 300–500, taken 550 ms apart, is fast Fourier-transformed in two dimensions to convert to k-space followed by temporal correlation of the series.
Image processing
Each image series was preprocessed before kICS analysis. Initially, the image series was corrected for background intensity values using a top-hat transformation (12). Cells were then segmented using the watershed transform (12). Mean-intensity padding outside the cells was used to maximize the analysis area (13). For the photophysical measurements, the image series was filtered for immobile components (as described in Hebert et al. (14)). For all of the image series, 25 time lags were calculated in the time correlation function, which is <10% of the length of the image series. Changes in the Θ-ratio were insensitive to the time point used for the calculation, as long as the correlation functions had not decayed to zero. The k-space correlation functions were fit up until |k|2 = 20 μm−2.
Acknowledgments
We thank S. V. Desiderio, J. Hwang, J. Peters, J. Powell, R. Siliciano, and T. Schroer for help, comments, and discussion.
This work was supported by National Institutes of Health grants AI14584 (to M.E.) and P01 AI072677, AI29575, AI44129, and CA108835 (to J.P.S.); it was also supported by grants from the Natural Sciences and Engineering Research Council (Canada), the Canadian Institutes of Health Research (to P.W.W.), and a Natural Sciences and Engineering Research Council (Canada) Postgraduate Scholarships fellowship (to D.K.).
References and Footnotes
- 1.Michalet X., Pinaud F.F., Weiss S. Quantum dots for live cells, in vivo imaging, and diagnostics. Science. 2005;307:538–544. doi: 10.1126/science.1104274. [DOI] [PMC free article] [PubMed] [Google Scholar]
- 2.Dahan M., Lévi S., Triller A. Diffusion dynamics of glycine receptors revealed by single-quantum dot tracking. Science. 2003;302:442–445. doi: 10.1126/science.1088525. [DOI] [PubMed] [Google Scholar]
- 3.Yu M., Van Orden A. Enhanced fluorescence intermittency of CdSe-ZnS quantum-dot clusters. Phys. Rev. Lett. 2006;97:237402. doi: 10.1103/PhysRevLett.97.237402. [DOI] [PubMed] [Google Scholar]
- 4.Lee J.D., Maenosomo S. Intensified blinking, continuous memory loss, and fluorescence enhancement of interacting light-emission quantum dots. Phys. Rev. B. 2009;80 205327–1–5. [Google Scholar]
- 5.Shepherd D.P., Whitcomb K.J., Van Orden A. Fluorescence intermittency and energy transfer in small clusters of semiconductor quantum dots. J. Phys. Chem. C. 2010;114:14831–14837. [Google Scholar]
- 6.Schamel W.W., Arechaga I., Alarcón B. Coexistence of multivalent and monovalent TCRs explains high sensitivity and wide range of response. J. Exp. Med. 2005;202:493–503. doi: 10.1084/jem.20042155. [DOI] [PMC free article] [PubMed] [Google Scholar]
- 7.Lillemeier B.F., Pfeiffer J.R., Davis M.M. Plasma membrane-associated proteins are clustered into islands attached to the cytoskeleton. Proc. Natl. Acad. Sci. USA. 2006;103:18992–18997. doi: 10.1073/pnas.0609009103. [DOI] [PMC free article] [PubMed] [Google Scholar]
- 8.Fahmy T.M., Bieler J.G., Schneck J.P. Increased TCR avidity after T cell activation: a mechanism for sensing low-density antigen. Immunity. 2001;14:135–143. [PubMed] [Google Scholar]
- 9.Chen Y., Shao L., Chen Z.W. NSOM/QD-based nanoscale immunofluorescence imaging of antigen-specific T-cell receptor responses during an in vivo clonal VΓ2VΔ2 T-cell expansion. Blood. 2008;111:4220–4232. doi: 10.1182/blood-2007-07-101691. [DOI] [PMC free article] [PubMed] [Google Scholar]
- 10.Kolin D.L., Ronis D., Wiseman P.W. k-Space image correlation spectroscopy: a method for accurate transport measurements independent of fluorophore photophysics. Biophys. J. 2006;91:3061–3075. doi: 10.1529/biophysj.106.082768. [DOI] [PMC free article] [PubMed] [Google Scholar]
- 11.Stone J.D., Stern L.J. CD8 T cells, like CD4 T cells, are triggered by multivalent engagement of TCRs by MHC-peptide ligands but not by monovalent engagement. J. Immunol. 2006;176:1498–1505. doi: 10.4049/jimmunol.176.3.1498. [DOI] [PubMed] [Google Scholar]
- 12.Soille P. 2nd Ed. Springer-Verlag; New York: 2003. Morphological Image Analysis. [Google Scholar]
- 13.Comeau J.W., Kolin D.L., Wiseman P.W. Accurate measurements of protein interactions in cells via improved spatial image cross-correlation spectroscopy. Mol. Biosyst. 2008;4:672–685. doi: 10.1039/b719826d. [DOI] [PubMed] [Google Scholar]
- 14.Hebert B., Costantino S., Wiseman P.W. Spatiotemporal image correlation spectroscopy (STICS) theory, verification, and application to protein velocity mapping in living CHO cells. Biophys. J. 2005;88:3601–3614. doi: 10.1529/biophysj.104.054874. [DOI] [PMC free article] [PubMed] [Google Scholar]