

Abstract
The objective of this study is to develop an effective siRNA delivery system for successful delivery to the liver for the treatment of HCV. Nanosize liposomes (nanosomes) have been prepared using a mixture of cholesterol and DOTAP. A functional siRNA was encapsulated into nanosomes following condensation with protamine sulfate. The delivery of siRNA was optimized in an in vitro cell culture system. The efficacy of the formulations was evaluated by measuring functional gene silencing and cytotoxicity. Encapsulation of siRNA ≥ 7.4 nM resulted in successful delivery of siRNA to nearly 100% of cells. The formulations containing lipids to siRNA ratio ≥ 10.56:1 instantly cleared approximately 85% of HCV while maintaining cell viability at about 90%. The formulations were sonicated to further reduce the particle size. The size of these formulations was decreased up to 100 nm. However, there were no significant changes observed in zeta potential, or in siRNA encapsulation and integrity following sonication. The sonicated formulations also showed higher liver hepatocytes deposition and gene silencing properties. This study therefore provides a novel approach of siRNA delivery to liver hepatocytes which can also be applied to treat HCV in chronic liver diseases.
Keywords: High pressure homogenization, Hepatitis C virus, siRNA delivery, Nanosomes, Sonication
1. Introduction
Sequence specific gene silencing based on RNA interference (RNAi) is one of the newly evolving fields in biomedical science, and holds great promise for molecular-targeted treatment of various diseases, including genetic disorders, cancer and viral infection [1–3]. It has been shown that a RNA-Induced Silencing Complex (RISC) is formed with cytoplasmic double stranded RNA, following which RNAi initiates the cleavage of complementary messenger RNA (mRNA) which in turn results in the silencing of the corresponding gene [4]. Since its initial discovery by Fire et al. in nematodes [5], and subsequent reports of functional gene silencing in a variety of organisms [6], RNAi has provided promising treatment options for a variety of inflammatory and neoplastic conditions. Given that many diseases are fundamentally gene-based, specific targeting of RNA or an RNA virus, such as HCV by RNAi offers great therapeutic potential for the treatment of genetic and viral diseases [7,8]. But the delivery of siRNA specifically to the target cells or tissues is a major hurdle because functional gene silencing requires that siRNA be delivered to the RNAi machinery which is housed in the cell cytoplasm. Delivery of siRNA into the cell cytoplasm is hindered by their rapid degradation by nucleases in the serum, unless they are somehow protected from this nuclease digestion. To overcome this potential problem of siRNA delivery, a number of techniques have been attempted, such as hydrodynamic injection [9,10], viral genomes [11], electroporation, liposomal and polymeric nanoparticles [12,13]. Viral vectors were reported to provide efficient gene delivery, but they are associated with significant drawbacks, such as high toxicity [14] and immunogenicity [15]. Among various non-viral delivery methods, lipid and polymer based delivery vehicles have been widely used for siRNA delivery. In the area of polymeric delivery, a variety of polymers such as poly-ethyleneimine (PEI), poly-L-lysine (PLL), poly-lactide-co-glycolide (PLGA), chitosan, gelatin, etc. have been used to prepare nucleic acid condensed polyplexes or other polymeric carriers (i.e. micelles, nanoplexes, nanogels etc.) [16,17]. In the case of lipid based carrier systems, cationic lipids such as DOTAP (1,2-dioleoyl-3-trimethylammonium-propane), DC-cholesterol, etc. have been used extensively due to their ability to enhance transfection efficiency [18]. Neutral lipids such as DOPC (1,2-dioleoyl-sn-glycero-3-phosphocholine) and other surface modified lipids have also been investigated [19]. Among different delivery techniques, liposomal delivery has long been preferred due to its safety, non- immunogenicity, comparative ease of assembly, as well as the diverse range of morphologies, sizes, tissue targeting and controlled release characteristics.
Delivery of siRNA presents a special challenge due to its large molecular weight (~13kDa) and polyanionic nature (~40 phosphate negative charges) [20], making it highly impermeable to the cell membrane. A cationic lipid such as DOTAP is suitable in this context due to the fact that its net positive charge enhances complex formation with polyanionic nucleic acids such as siRNAs, as well as facilitates interaction with negatively charged cell membranes resulting in the engulfment of the particles [21]. In this study, cationic lipid (DOTAP) based nanosomal formulations, defined as ‘nanosomes’ due to their nanometer size range, were developed to deliver siRNAs in the in vitro and in vivo studies. The siRNA amount was successfully optimized for efficient delivery to liver cells in vitro. Several siRNA nanosomal formulations were prepared by changing the siRNA to nanosome ratio to obtain an effective formulation for optimal HCV clearance. Efficient intracellular delivery of siRNA to the target organ or tissues in the body is the primary obstacle for widespread use of siRNAs in the clinics [22,23]. Our study was focused on developing and optimizing cationic nanosomal formulations capable of silencing HCV in an in vitro cell based study. A second goal of the study was to achieve efficient in vivo delivery of the formulations to the liver hepatocytes.
Since the HCV is located primarily in the liver hepatocytes, siRNA nanosomes need to be delivered specifically to the liver. Successful siRNA therapy for HCV in the liver warrants that these siRNA nanosome particles be small enough to prevent clogging of capillaries, and be able to pass the endothelial cell barrier to reach the hepatocytes [24,25]. The nanosomes should also maintain siRNA’s functional integrity during formulation processing, as well as in the tissue environment during their passage to the target site. In this study, siRNA nanosomes were initially optimized for efficient knock-down of HCV in an in vitro cell study. Subsequently, in order to facilitate siRNA delivery to the liver hepatocytes in an in vivo mouse model, the siRNA nanosomes were sonicated for 2–5 minutes to further reduce their particle size. The optimum sonication time was determined by an assessment of the correlation of the physiochemical characteristics of the sonicated nanosomes and their in vivo delivery to the liver hepatocytes, as well as their functional gene silencing capabilities for the in vitro and in vivo studies.
2. Materials and Methods
2.1. Materials
DOTAP and cholesterol were purchased from Avanti Polar-lipids Inc. (Birmingham, AL, USA). Protamine sulfate salt Grade X (PS), trehalose dihydrate and HPLC grade chloroform were obtained from Sigma Chemical Co. (St. Louis, MO, USA). Functional siRNA (5′-CCU CAA AGA AAA ACC AAA ATT -3′) and control siRNA (5′-GCG CCU AGC CAU GGC GUU ATT -3′) and silencer cy3-lebeled GAPDH siRNA were designed and purchased from Applied Biosystems (Austin, TX). Silencer GAPDH siRNA (Cat. No. AM4631), fetal bovine serum albumin (BSA), Dulbecco’s modified Eagle’s medium (DMEM), penicillin/streptomycin and lipofectamine 2000 were purchased from Invitrogen Corp. (Carlsbad, CA, USA). The Ribogreen assay kit was supplied by Molecular Probes (Eugene, OR, USA). The anti-Rabbit GAPDH antibody, anti-Rabbit β-actin antibody and anti-Rabbit IgG HRP labeled secondary antibody were purchased from Cell Signaling Technology (Danver, MA). IFN-1 (Interferon-1) was purchased from Schering Corporation (New Jersey, NJ, USA). All other reagents were of analytical grade and were supplied by Sigma Chemical Co. (St. Louis, MO, USA).
2.2. Preparation of nanosomes
The nanosomes were prepared by an EmulsiFlex-B3 high pressure homogenizer (HPH) (Avestin Inc., Ottawa, Canada) [26,27]. In brief, the nanosomes were prepared from a mixture of two lipids; cholesterol and DOTAP, at the molar ratio of 1:1. The lipids (containing 50 mg DOTAP and 26.7 mg cholesterol) were dissolved in 15 ml HPLC-grade chloroform in a round bottom flask and then dried under nitrogen gas and overnight vacuum. The resulting films of the lipids were hydrated in de-ionized water to give a final concentration of 20 mM. The lipid dispersions were warmed and mixed at 50°C for 45 minutes by rotation, followed by warming again at 35°C for another 10 minutes. The resultant dispersion was stored at room temperature for 3 hours before it was transferred into a scintillation vial and warmed again at 50°C for 10 minutes. The final lipid dispersion was homogenized by using HPH at 20,000 PSI for 5 cycles. Each time, 2.5 ml of lipid dispersion was subjected to homogenization and the resultant nanosomes were collected in another scintillation vial. The nanosomes were kept at room temperature for 1 hour prior to overnight storage at 4°C.
2.3. Preparation of siRNA loaded nanosomes
Five different siRNA loaded nanosome formulations (F1, F2, F3, F4, and F5) were prepared by using homogenized nanosomes, protamine sulfate, trehalose and siRNA. The composition of the different formulations and siRNA amounts used for the experiments is listed in Table 1. In brief, freshly prepared protamine sulfate solution in DEPC-treated water was added drop-wise to an aqueous solution of siRNA (10 pmol/μl) while vortexing the solution at a moderate speed. siRNA and protamine sulfate condensation was performed at room temperature by incubation of the mixture for 40 minutes. Following the siRNA-protamine sulfate condensation, the pre-warmed nanosomes (20 mM) were added to the mixture. The final preparations were mixed rapidly by pipeting up and down thirty times. Finally, freshly prepared trehalose solution in DEPC-treated water (0.0301 nM) was added to the nanosome formulations, followed by vortexing four times to allow thorough mixing of the siRNA nanosomes with trehalose.
Table I.
Composition of different siRNA nanosomes for inhibition of HCV replication. Each formulation also contain protamine sulfate (PS) = 2 μg; trehalose (TH) = 10 μg.
| Nanosome formulations | DOTAP | Cholesterol | Total lipids | Functional siRNA | Control siRNA | * siRNA concentration |
|---|---|---|---|---|---|---|
| F1 | 2.09 μg | 1.16 μg | 3.25 μg | 1.0 μg | 100 nM | |
| F2 | 3.44 μg | 1.90 μg | 5.34 μg | 1.0 μg | 100 nM | |
| F3 | 6.80 μg | 3.76 μg | 10.56 μg | 1.0 μg | 100 nM | |
| F4 | 8.60 μg | 4.76 μg | 13.36 μg | 1.0 μg | 100 nM | |
| F5 | 8.60 μg | 4.76 μg | 13.36 μg | 1.0 μg | 100 nM |
siRNA concentration was determined based on 1ml cell culture media
To study the effect of sonication on the siRNA nanosome formulations, a modified F4 containing cy3-GAPDH siRNA was used instead of the functional siRNA. In this experiment, after preparing a bulk amount of modified F4, it was aliquoted into a set of Eppendorf tubes (B1-B9), each containing 20 μg siRNA encapsulated nanosomes in 60 μl total volume (Table 3). These preparations were subsequently diluted to 1 ml by adding DEPC-treated water. Each formulation was sonicated in ice cold water in a water bath for a specific time period (Table 3). The sonicated formulations were always freshly prepared for different experiments.
Table 3.
Particle size and zeta potential of different sonicated siRNA nanosomes (B1–B9).
| Nanosomes | Sonication time (min) | Particle size (nm)
|
Zeta potential (mV) | ||
|---|---|---|---|---|---|
| 30% | 70% | 90% | |||
| B1 | 0.0 | 76±13 | 211±19 | 405±67 | 13.6±3.8 |
| B2 | 0.5 | 47±7 | 122±26 | 269±87 | 13.1±1.8 |
| B3 | 1.0 | 65±24 | 140±44 | 275±96 | 14.4±3.2 |
| B4 | 2.0 | 50±11 | 108±28 | 240±84 | 14.1±3.2 |
| B5 | 3.0 | 43±5 | 103±14 | 196±31 | 13.7±3.8 |
| B6 | 4.0 | 42±3 | 101±18 | 192±43 | 13.6±3.1 |
| B7 | 5.0 | 42±5 | 99±17 | 186±37 | 13.1±3.2 |
| B8 | 6.0 | 52±17 | 129±41 | 237±75 | 13.1±3.5 |
| B9 | 7.0 | 43±5 | 112±19 | 225±51 | 11.1±3.7 |
2.4. Measurement of particle size, particle morphology and zeta potential
The mean particle size of the siRNA nanosomes (B1-B9) was determined by dynamic laser light scattering method at room temperature by using a Delsa Nano C Particle Analyzer (Beckman Coulter Inc., Fullerton, CA, USA). The particle size was reported as the mean ± standard deviation (n=4).
The morphology of different sonicated nanosomal particles was examined by a cryo-Transmission Electron Microscope (cryo-TEM; JEOL 2010, Peabody, MA, USA). A 6 μl drop of each formulation (B1, B4, B6 and B8) was placed on a holey carbon grid and rapidly vitrified in liquid ethane. The sample was then transferred under the protection of liquid nitrogen to the cryo-TEM sample holder and inserted into the cryo-TEM. The temperature of the sample grids was maintained at −175°C during the course of imaging.
Analysis of the charge density on the sonicated siRNA loaded nanosomes was performed by examining their zeta potential with a Malvern Zetasizer 2000 (Malvern Instruments, Malvern, UK). The system was initially calibrated with standards. All experimental samples were prepared in 1mM KCl and five measurements times.
2.5. Measurement of siRNA encapsulation efficiency in different sonicated formulations
The amount of siRNA, either complexed or encapsulated, was determined for different sonicated formulations. The efficiency of encapsulation was calculated by comparing the total amount of siRNA measured in the sample with the actual amount of siRNA added to the sample. Briefly, after preparation, the samples (B1-B9) were centrifuged at 14,000 rpm (Allegra Centrifuge, Beckman Coulter Inc., Fullerton, CA) for 15 minutes at 4°C. Supernatants containing the free siRNA were separated from the pellets. 500 μl of a 1% sodium dodecyl sulfate (SDS) solution was added to the pellets, and to the supernatants. Samples were then incubated at 37°C for 18 hours with gentle agitation (50 rpm). The siRNA amount from both supernatants and pellets was measured by using Ribogreen assay, following the manufacturer’s protocol. The results were reported as the mean ± standard deviation (n=4).
2.6. Agarose gel electrophoresis
The structural integrity of encapsulated siRNA in different sonicated formulations was assessed by agarose gel electrophoresis. In brief, after extracting siRNA by using 500 μl of 1% SDS, the solution was mixed with an equal volume of phenol and chloroform (1:1) and then vortexed for 1 minute using the Vortex Genie Mixer (Scientific Industries Inc., Bohemia, NY) and stored at room temperature for 5 minutes. The resultant mixture was centrifuged at 11,000 rpm for 15 minutes and the aqueous layer was collected. The siRNA present in the aqueous layer was mixed with 1 ml isopropanol and kept at −80°C overnight. The mixture was again centrifuged at 11,000 rpm for 30 minutes at 4°C and the pellets were collected. Finally, the siRNA was precipitated and purified by adding 20 μl 2M sodium acetate and absolute ethanol (100%v/v), centrifuging at 11000 rpm for 30 minutes at 4°C, and subsequently run on a 3% agarose gel.
2.7. Measurement of intracellular localization of siRNA by confocal microscope
For measuring intracellular localization of siRNA, Huh-7 cells were cultured in 8-well chamber slides (Electron Microcopy Sciences, Hatfield, PA) for 24 hours and transfected with B6 encapsulating cy3-GAPDH siRNA for different time periods (i.e. 30 minutes, 2 hours and 12 hours, respectively). The endosomes and lysosomes were stained by incubating those B6 transfected cells with LysoTraker Green DND-26 (Molecular Probes) and the cells were fixed with 4% paraformaldehyde solution after several washings with phosphate buffered saline. Nuclei were also stained with To-Pro3 nuclear marker (Eugene, OR, USA) and observed with Leica TCS SP2 confocal microscope equipped with three lasers (Leica Microsystems, Exton, PA).
2.8. Cell culture and cell lines
The Huh-7 cells and R4GFP HCV (+) replicon cells [28] were used. The cells were routinely cultured and expanded at 37°C in DMEM, supplemented with 2 mM l-glutamine, nonessential amino acids, 100 U/ml of penicillin, 100 μg/ml of streptomycin and 5% fetal bovine serum in an atmosphere of 5% CO2.
2.9. In vitro functional assessment of HCV inhibition by different siRNA nanosomes (F1-F5)
GFP expression
In vitro transfection efficiency and inhibition of HCV by different formulations (F1-F5) were monitored for three consecutive doses by qualitative (GFP expression) and quantitative (FACS) analysis. Briefly, 2x10⁵ R4GFP cells were cultured in 6-well tissue culture plates (TCPs) for 24 hours. The media was replenished by 1 ml fresh media and the cells were transfected with lipofectamine, or with siRNA nanosomes encapsulating 100 pmol siRNA (i.e. 100 nM siRNA based on 1 ml cell culture media). After 4 hours, an additional 1 ml of fresh media was added and cell culture was continued for 48 hours. The cells were then scraped by using trypsin-EDTA and re-suspended into 1 ml of media. The cell number of control experiments (i.e. mock) was counted, and the suspension media containing 2x10⁵ R4GFP cells in the control experiment was measured. This amount (i.e. volume) of cell suspension media was then taken in order to re-plate cells for each experimental condition and cultured again for 48 hours. After this time period, the cells were again transfected a second time with the same nanosome formulations, or with lipofectamine entrapping the same amount of siRNA for another 48 hours. This procedure was followed again to re-plate cells for a third dose of transfection. Simultaneously, in another well, cells were treated with 1000 IU/ml IFN for all three dose points. Following the third dose, the GFP expression was monitored by using a fluorescence microscope (Olympus America, Inc., NY, USA) and photographs were captured at 10X magnification.
FACS analysis
After capturing GFP images by fluorescent microscope, flow cytometric analysis (FACS) (BD Biosciences, San Hose, CA, USA) was performed to quantify the GFP positive cells post treatment.
2.10. Ribonuclease Protection Assay (RPA)
A positive strand of human GAPDH mRNA level was detected by RPA. Briefly, Huh-7 cells were transfected with different formulations for two consecutive doses as stated above. Subsequently, total RNA was isolated from the transfected cells by the GITC method and subjected to RPA using a probe targeted to human GAPDH mRNA. A linearized plasmid pTRI-GAPDH-human antisense control template was used to prepare the probe to detect GAPDH mRNA by using Sp6 RNA polymerase (Ambion Inc., Austin, TX).
2.11. Measurement of cell viability
The toxicity of different siRNA nanosomes (F1-F5) and lipofectamine transfection was determined on R4GFP replicon cells by the MTT assay according to the manufacturer’s protocol (Sigma Chemical Co., MO, USA). The cells (2x10⁴) were cultured on 24-well TCPs for 24 hours followed by transfection with different siRNA nanosomes (10 nM), or with lipofectamine for another 48 hours. Simultaneously, 2×10⁵ R4GFP cells were cultured in a 6-well plate and transfected with 100 nM siRNA formulations, or with lipofectamine for 48 hours. The cells from 6-well plates were then scraped by trypsin-EDTA and re-suspended into 1 ml media. The suspension media of control experiments (i.e. mock) that contained 2×10⁴ and 2×10⁵ R4GFP cells was measured and this volume of suspension media was taken to re-plate cells for each experimental condition in 24- and 6-well plates, respectively. After a 48 hour incubation period, the cells in the 24- and 6-well plates were transfected a second time with various formulations or with lipofectamine entrapping the same amount of siRNA (i.e. 10 nM for 24-well plates and 100 nM for 6-well plates) for another 48 hours. For the experiment with the third dose transfection, the same procedure was followed for the cell scraping and counting from 6-well plates to replate them in 24-well plates. Finally, the MTT assay was performed after completion of 1st, 2nd and 3rd dose in 24-well plates by incubating MTT solution at 37°C for 3 hours and the cell viability was measured by reading the absorbance at 570 nm.
2.12. Delivery of cy3-GAPDH siRNA
For optimizing siRNA amount, another set of formulations was also prepared by adding different amount of siRNA (cy3-GAPDH siRNA) into the siRNA nanosomes while keeping the amount of liposomes, protamine sulphate and trehalose unchanged (i.e. liposome: PS: trehalose = 13.36:2:10). This set of formulations was prepared by following the same procedure already stated above. The formulations were used to transfect Huh-7 cells in 12-well TCPs for 24 hours and the transfection was observed at 10X magnification by using a fluorescence microscope and quantitatively measured by FACS analysis.
2.13. Experimental Animals
Female Balb/c mice (8–10 weeks old) were obtained from Charles River Laboratories (Wilmington, MA, USA). The mice were housed at the Tulane Vivarium facility. This facility complies with the recommendations of the Guide for Care and Use of Laboratory Animals with respect to restraint, husbandry, surgical procedures, feed and fluid regulation, and veterinary care. All experiments performed on the animals were in accordance with, and approved by the Tulane University Animal Care and Use Committee (IACUC).
2.14. In vivo delivery of siRNA nanosomes in mice
The Cy3-GAPDH siRNA encapsulated nanosomes were administered via the intraperitoneal route (IP), whereas the functional GAPDH siRNA nanosomes were administered via both IP and intravenous routes (IV) to Balb/c mice. For cy3-GAPDH siRNA delivery, 50 μg siRNA (at 2.5 mg/kg body weight) was used to prepare nanosomes (B1 and B6), and for GAPDH siRNA delivery, 100 μg siRNA (at 5.0 mg/kg body weight) was used to prepare nanosomes (B1 and B6). Another blank nanosome formulation (B0) was also prepared without the siRNAs. The B0 and B6 formulations were exposed to 4 minutes sonication in ice cold water, whereas the B1 formulation was kept non-sonicated. After 6 hours of cy3-GAPDH siRNA delivery, the mice were sacrificed by euthanization and the organs (liver, lung, heart, kidney and spleen) were collected immediately and embedded in Tissue-Tek OCT embedding compound (American Master Tek Scientific, Lodi, CA, USA) and stored in dry ice. The tissue sections cut at 12 μm thickness were analyzed for cy3-GAPDH siRNA deposition in different organs by using a fluorescence microscope at 10X magnification. For the functional GAPDH siRNA delivery group, the siRNA nanosomes were injected for three consecutive doses over a period of three days. Finally, the mice were sacrificed by euthanization and the liver was collected and stored at −80°C.
2.15. Western Blot analysis
A small portion of each lobe of the liver tissue was separated, weighed and lysed by the RIPA lysis buffer with proteinase and phosphatase inhibitors (1x PBS, 1% NP-40, 0.5% Deoxycholate, 0.1% SDS, 50 ug/ml PMSF, 5 μg/ml aprotinin, 5 μg/ml leupeptin, 1 μg/ml pepstatin). The tissue lysates were cleared by centrifugation at 14000 rpm for 20 minutes, the supernatant was collected and an equal amount of proteins (7 μg) was run for Western blotting to detect GAPDH (1:2000 dilution) and β-actin (1:2000 dilution).
2.16. Histology and Immunocytochemistry
The histological features of the frozen section of liver tissue of Balb/C mice which were treated with control (B0), sonicated (B6) or non-sonicated (B1) formulations were examined by hematoxylin and eosin staining (H&E). Briefly, five-micrometer sections were cut from each tissue block and were examined by a routine H&E staining procedure. In order to demonstrate the knock down of GAPDH in the liver hepatocytes, the tissue sections were immunostained with an antibody against mouse GAPDH (1:100 dilution) (Cell Signaling Technology, Danver, MA). The immunereactivity of the GAPDH antibody was detected using the ABC detection kit (Vector Lab, Burlingame, CA) using a standard laboratory protocol. The counterstaining of the nucleus was done by CAT hematoxylin. The cytoplasmic expression of GAPDH (brown staining) of mouse hepatocytes in the liver sections was subsequently captured via microscope (Olympus IX 60, Germany) at 20X magnification.
2.17. Statistical analysis
The results were expressed as mean ± standard deviation. Statistical significance between groups (i.e. F4 and lipofectamine transfection) during FACS analysis of HCV inhibition and MTT assay of cell viability was compared by the Student-Newman-Keul’s nonparametric test, using the GraphPad Prism 5 software. A p value of <0.05 was considered as evidence of a significant difference.
3. Results
3.1. Endosomal escape and siRNA release in the cell cytoplasm
Huh-7 cells were transfected with increasing concentrations of cy3-GAPDH siRNA nanosomes. Fig. 1A and Table 2 demonstrate the efficiency of delivery and indicate that the delivery of siRNA into the cell cytoplasm was observed by using as little as 0.74 nM siRNA. The FACS analysis data of the deposited particles further indicates that nearly all cells took up the particles at ≥ 7.4 nM of siRNA and the mean intensity of deposited siRNA into the cells gradually increased with the increase of siRNA addition to the nanosomes (Table 2). However, truly significant clearance of HCV from R4GFP HCV (+) cells by siRNA nanosomes was attained at 100 nM siRNA (i.e. functional siRNA), a concentration which was associated with minimal or no cytotoxicity (data to be published elsewhere). This observation was the rationale for using this specific amount of siRNA (100 nM) for encapsulation into the nanosomes. In order to gain further insight into siRNA delivery into the cytoplasm, the current study tracked siRNA localization, as well as endosome formation within the cells at different time periods. The siRNA nanosomes need to cross the cell plasma membrane and reach into the cytoplasm to initiate gene silencing activities. The siRNA should subsequently be released from the endosome/lysosome compartments [29,30]. The experimental results shown in Fig. 1B indicate that within 30 minutes of transfection, the siRNA nanosomes (red; *) were associated with the plasma membrane, a few of them were engulfed into the endosomes (yellow; marked with arrow) while the remaining particles were sitting on the plasma membrane. After 2 hours of cell transfection, a high percentage of cy3-lebeled siRNA nanosomes (red) was found to be located in the cell cytoplasm. The Lysotraker also tracked endosomes (green; #) in both the cytoplasmic and peripheral regions of the cells. When these two images were merged, it was noticed that most of the siRNA nanosomes were confined within the endosomes in the cell cytoplasm. The siRNA particles were yet to release from the endosome vesicles. After 12 hours of transfection, the particles (siRNA nanosomes) were observed to break into small pieces allowing release of siRNA, as evidenced by the presence of red colored smears throughout the cytoplasm. The endosomes (green, marked by # in the merged image) did not appear to be holding any siRNA nanosomes after this 12 hour time period. This study therefore clearly demonstrates that the siRNA nanosomes are taken up by the endosomes and then carried into the cell cytoplasm within 2 hours of transfection. Later, the siRNA is released from the endosomes within 12 hours of transfection and become available for functional gene silencing.
Fig. 1.


Assessment of siRNA delivery and endosomal escape following endocytosis by siRNA nanosomes. A. Optimization of siRNA delivery by using different amounts of siRNA. Huh-7 cells were transfected with increasing amounts of cy3-GAPDH siRNA nanosomes for 24 hours and the delivery of siRNA into the cells was imaged by using a fluorescence microscope at 10X magnification. B. Assessment of endosomal escape of siRNA nanosomes. Huh-7 cells were transfected with B6 for different time periods and then stained with Lysotraker Green DND-26 and To-Pro3 nuclear dye. The siRNA nanosomes (red) and endosomes (green) was imaged by Leica TCS SP2 confocal microscope. Scale bar represents 20 μm.
Table 2.
Measurement of siRNA accumulation into Huh-7 cells by entrapping different amount of siRNA into siRNA nanosomes.
| siRNA concentration | siRNA accumulation into Huh-7 cells
|
|
|---|---|---|
| Percentage of cells | Mean intensity (×1000) | |
| 0 nM | 0.0 | 0.0 |
| 0.74 nM | 24.4±6.0 | 0.44±0.008 |
| 3.7 nM | 93.8±4.0 | 0.94±0.07 |
| 7.4 nM | 99.4±0.05 | 1.96±0.10 |
| 37.0 nM | 100.0±0.0 | 5.87±0.24 |
| 74.0 nM | 100.0±0.0 | 11.82±0.13 |
| 148.0 nM | 100.0±0.0 | 17.94±0.36 |
| 222.0 nM | 99.86±0.15 | 20.73±1.20 |
3.2. Inhibition of HCV replication in cell culture model
The inhibition of HCV replication in the in vitro cell culture study was monitored for three consecutive doses of siRNA nanosomes and compared with lipofectamine transfection. Of the formulations F1 to F4, significantly high HCV inhibition was observed in both F3 and F4 (Fig. 2A). F1 and F2 were not as effective as F3 and F4, as several GFP positive cells were evident in these two siRNA nanosomes treated cells (Fig. 2A). The results were also confirmed from the quantitative FACS analysis of GFP expression (Fig. 2B). The inhibition of HCV replicon by these siRNA nanosomes was ranked as follows: F4>F3>F2>F1. The clearance of HCV by either F3 or F4 was significantly higher than by F1 or F2 at different dose points (Fig. 2B), though the inhibition of HCV replication from 2nd to 3rd dose for F3 and F4 was not as significant as observed with F1 and F2. On the other hand, when the knock-down efficiency of F4 was compared with lipofectamine, a more significant inhibition of HCV replication was observed for F4 compared to lipofectamine at different dose points (i.e. ~87% vs. ~57% for 1st dose, ~91% vs. ~64% for 2nd dose and ~91% vs. ~80% for 3rd dose) (p< 0.0001). This study thus indicates that a lipid to siRNA ratio ≥ 10.56:1 is more effective in its ability to inhibit HCV replication, than the corresponding ratios ≤ 3.25:1. No inhibition of virus replication was observed in the control siRNA nanosomes (F5) or with IFN-1.
Fig. 2.


Qualitative and quantitative assessment of the inhibition of HCV replication by different siRNA nanosomes. R4GFP cells were transfected with different formulations (F1-F5), or with lipofectamine and IFN for three consecutive doses during 12 days. A. Fluorescence photographs of GFP expression after siRNA treatment using a fluorescence microscope at 10X magnification and B. Quantitative measurement of GFP expression by FACS analysis. The results represent mean ± standard deviation (n=3). (***, $$$ and ### indicates p<0.0001 of HCV inhibition of F4 with respect to lipofectamine after 1st, 2nd and 3rd dose, respectively).
3.3. Cell viability
The viability of R4GFP cells during the process of clearing HCV replication by different siRNA nanosomes was also monitored for 3 consecutive doses and the results were again compared with lipofectamine transfection (Fig. 3). The results indicate that F1 and F2 were able to maintain cell viability ~100% during the 1st and 2nd dose, following which a slight decline of cell viability was observed after the 3rd dose. When the lipid amount was comparatively higher, as in F3 and F4, the cell viability was determined to be ~90%, ~86%, ~86% for F3 and ~89%, ~81%, ~79% for F4 after 1st, 2nd and 3rd doses, respectively. In the case of lipofectamine transfection, the cell viability was shown to be ~83%, ~70% and ~68% after 1st, 2nd and 3rd doses, respectively. By comparison, a significantly higher viability of R4GFP cells was observed for F4 transfection compared to lipofectamine after the 2nd and 3rd doses (p< 0.001), but not after the 1st dose. With regard to toxicity, IFN did not show any toxic effects, whereas the F5 formulation entrapping control siRNA showed slight toxicity to the cells (i.e. viability was ≥ 90% at different dose points). This was assumed to be due to the presence of lipid components, rather than siRNA itself in F5.
Fig. 3.

Cell viability of R4GFP cells transfected with different siRNA nanosomes (F1-F5), versus with lipofectamine and with IFN. The cells were cultured in 24-well plates and they were treated with different siRNA nanosomes, lipofectamine or with IFN-1 for three consecutive doses for a period of 12 days. The percentage of viable cells compared to the untreated cells during transfection was measured by MTT assay. The results represent mean ± standard deviation (n=5). (** and ## indicates p<0.001 of cell viability of R4GFP cells by F4 transfection compared to lipofectamine after 2nd and 3rd dose, respectively).
3.4. Characterization of sonicated siRNA nanosomes (B1-B9) - particle size, morphology, and zeta potential
The particle size data shown in Table 3 and Fig. 4 indicate that when the siRNA nanosomes were sonicated for a brief time period (30 seconds; B2), their size (122±26 nm; 70% confidence) was significantly reduced compared to the non-sonicated formulation (B1) (211±19; 70% confidence). The particle size was observed to gradually decrease with increasing sonication time periods. The smallest particles were observed in B5 (3 minute sonication), B6 (4 minute sonication) and B7 (5 minute sonication) which had average sizes of 103±14, 101±18 and 99±17 nm (70% confidence). The particles were found to be slightly larger when the sonication time period exceeded 5 minutes (i.e. B8 and B9 formulations). The zeta potential of all these formulations was also measured (Table 3). The data indicates that the zeta potential of different sonicated formulations did not change significantly compared to their respective non-sonicated counterparts. The average zeta potential of the sonicated formulations ranged from +11 to +14 mV and was comparable to that of the non-sonicated formulation (B1; ~ 13.6±3.8 mV).
Fig. 4.

Cryo-TEM pictures of different post-sonicated siRNA nanosomes. Scale bar represents 100 nm.
3.5. siRNA encapsulation and integrity in the various sonicated formulations
Since the nanosomes (B1-B9) were exposed to different degrees of sonication, it was considered important to determine whether sonication had any deleterious effects on the integrity and encapsulation efficiency of siRNA within the nanosomes. This was assessed by measuring the siRNA level in both the encapsulated and free states using the Ribogreen assay (Fig. 5A) and agarose gel electrophoresis (Fig. 5B). The non-sonicated formulation B1 was observed to entrap high levels of siRNA (76±3%), while leaving a small quantity of free unbound siRNA (6.3±0.5%) in the solution. When the formulations were sonicated, some of the formulations seemed to lose some of the siRNA, though none of them differed significantly (p>0.05) from the non-sonicated formulation (B1). The siRNA encapsulation efficiency (see Fig. 5A) was found to be 77±2% for B2, 76±6% for B3, 73±4% for B4, 72±3% for B5, 73±2% for B6, 72±4% for B7, 70±4% for B8 and 68±3% for B9. In contrast, the level of free siRNA in the sonicated formulations increased slightly compared to the non-sonicated formulation (B1). The free siRNA level was determined to be 7.8±0.2% for B2, 9.0±1.4% for B3, 9.8±0.5% for B4, 9.4±1.0% for B5, 9.2±1.2% for B6, 10.3±1.8% for B7, 9.9±0.7% for B8 and 10.2±0.8% for B9. The presence of protamine sulphate and trehalose in the nanosomes, and the decomplexing agent (i.e. SDS) likely influenced the fluorescence reading that resulted in the reduction of total siRNA amounts measured from both encapsulated and free state in each formulation. This study clearly indicates that sonication has no significant detrimental effect on the encapsulation efficiency of siRNA within the nanosomes. The integrity of the encapsulated siRNA during this prolonged sonication time period was also assessed by subjecting the siRNA isolated from different samples (B1-B9) to agarose gel electrophoresis. The results shown in Fig. 5B indicate that all the siRNAs were released from the particles by 1% SDS treatment and there were no smearing of bands or any broken bands observed in any of those formulations. This study also confirms that extended sonication has no deleterious effects on the integrity of encapsulated siRNA in the nanosomes.
Fig. 5.


Determination of siRNA’s encapsulation efficiency and integrity during prolonged sonication of the formulation. A. The free and encapsulated siRNA in different sonicated formulations (B1-B9) were decomplexed by exposure to 1% SDS and then measured by Ribogreen assay. The results represent mean ± standard deviation (n=4). B. The integrity of encapsulated siRNA isolated from the nanosomes was measured by agarose gel electrophoresis.
3.6. Tissue distribution of siRNA nanosomes following IP delivery
In order to assess the impact of particle size on the in vivo delivery, B1 (non-sonicated) and B6 (sonicated) were delivered via the IP route. Blank nanosomes containing no siRNA were also injected for comparison. The results shown in Fig. 6 indicate that most of the particles in the B6 formulation were deposited in the liver. A small percentage was also found in the spleen. However, there was nearly no deposition observed in the kidney, lung or heart. In contrast, when B1 was administered via the IP route, a significant reduction of particle deposition was observed in the liver. There was some deposition in the spleen, but none in the heart, kidney or lung.
Fig. 6.

Comparison of tissue uptake of non-sonicated and sonicated siRNA nanosomes via IP route. B1 and B6 formulations containing cy3-GAPDH siRNAs at the dose of 2.5 mg/kg body weight, and blank nanosomes without siRNAs were injected intraperitoneally. Different organs were collected after 6 hours, embedded and sectioned for fluorescence imaging of cy3-GAPDH siRNA at 10X magnification by using a fluorescence microscope.
3.7. In vitro and in vivo functional inhibition of GAPDH by siRNA nanosomes
In vitro and in vivo GAPDH inhibition studies were performed to examine the ability of the siRNA nanosomes to effectively silence GAPDH, and also to compare functional inhibition by sonicated versus non-sonicated formulations. The results from the in vitro study shown in Fig. 7A indicate that both the B1 and the B6 formulations inhibited GAPDH at 100 nM siRNA. Furthermore, at the higher level of siRNA (i.e. 150 nM), a near complete inhibition of GAPDH was observed. It was also observed that the inhibition of GAPDH by the sonicated formulation (B6) was comparatively higher than that by the non-sonicated formulation (B1) (Fig. 7A). Similarly, when this experiment was conducted in vivo, the reduction of GAPDH was observed to be significantly higher with the sonicated formulation (B6) compared to the non-sonicated formulation (B1) (Fig. 7B). These findings were consistent for both routes of delivery, i.e. the IP as well as the IV routes. The actual percentage inhibition of GAPDH by B6 via the IP and IV routes was 45±10% and 65±4%, respectively, whereas the inhibition by B1 via the IP and IV routes was 24±11% and 33±6%, respectively. In this study, the inhibition of GAPDH by B6 was significantly higher by IV delivery compared to the IP delivery. The results of the H&E staining of frozen sections of liver tissue and immunostaining of GAPDH in the same tissue sections clearly indicate that the knock-down of GAPDH occurred mostly in the liver hepatocytes (marked by arrow) (Fig. 7C). Similar to the WB results, the knock-down efficiency of GAPDH in the liver hepatocytes was also observed to be higher for B6 compared to B1 when assessed by immunocytochemical analysis.
Fig. 7.

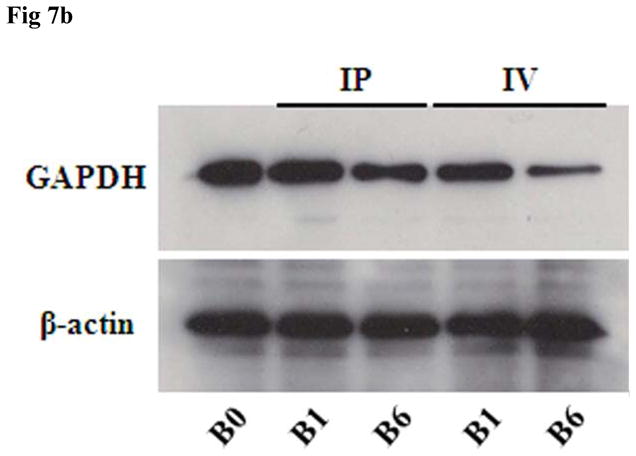

In vitro and in vivo inhibition of GAPDH by sonicated vs. non-sonicated nanosomes. A. Huh-7 cells were transfected with B1 and B6 formulations at two different siRNA concentrations (i.e. 100 nM and 150 nM) for 2 consecutive doses for a period of 8 days and GAPDH inhibition was measured by RPA. B. B1 and B6 formulations entrapping GAPDH siRNA were injected via either IP or IV route to Balb/c mice at a dose of 5.0 mg/kg body weight for 3 consecutive doses over 3 days. The liver was collected and the GAPDH inhibition was compared between sonicated (B6) and non-sonicated (B1) nanosomes by Western Blot analysis. Three mice were used for each experimental condition. C. Histological and immunocytochemical analysis of GAPDH inhibition in the liver hepatocytes (marked with arrow) of the frozen tissue sections of liver in Balb/c mice.
4. Discussion
RNAi offers great clinical potential as a therapeutic modality for a variety of viral diseases, especially HCV [3,31,32]. For HCV clearance, a novel gene delivery vehicle is required, which can deliver highly specific siRNA sequences to the virally infected liver hepatocytes. The current study has focused on the development of siRNA delivery vehicles which can specifically inhibit HCV replication and were tested in an in vitro cell culture model. Since HCV is unable to replicate in mice and other small animals, there is no suitable in vivo small animal model available for the assessment of our formulations to treat HCV. We therefore could not test our formulations in actual in vivo settings. As a proof of principle, we have assessed and optimized our siRNA nanosomes for the delivery and knock-down of GAPDH specifically in the liver hepatocytes (Fig. 7C) in an in vivo mouse model.
In the in vitro study, the cell viability is unaltered or barely affected when the cells are transfected with siRNA alone or with siRNA encapsulated nanosomes at lower lipid-to-siRNA ratios (i.e. ≤ 5.34:1) for single or multiple treatment. But when the lipid amount was increased, the viability of the cells was reduced. However, at lipid-to-siRNA ratios ≤ 5.34:1, the inhibition of HCV was significantly lower than that observed with a lipid-to-siRNA ratio ≥ 10.56:1. These findings led to the conclusion that a relatively higher lipid-to-siRNA ratio 13.36:1 (F4) was considered to be the most ideal formulation showing approximately 87% viral inhibition with a moderate level of cytotoxicity (~11%) after treatment with the first dose. We further attempted to determine whether the long term treatment with siRNA formulations could eradicate HCV completely, given that a single treatment could not clear all the HCV from the cells. We observed that even after three consecutive treatments with our formulations, complete clearance of HCV from the cells was not achieved. This observation suggests that a new approach of either treating cells initially with a higher amount of siRNAs, or delivering multiple siRNAs simultaneously could be more successful in accomplishing knock-down all the viruses (HCV) from the cells. However, compared to lipofectamine, the significantly higher cell viability of our formulations could offer a potential option for long term delivery of siRNA in the treatment of HCV.
Several articles published recently have suggested that the particle size of a delivery system should not exceed 150 nm for successful targeting to the liver hepatic cells [24,25]. This is because the endothelial fenestrae have an approximate diameter of 150–175 nm [33]. In the non-sonicated formulation B1, approximately 52% of particles are ≥ 150 nm. If this formulation is selected for in vivo delivery, this amount of particles (~ 52%) would not theoretically be able to enter into the liver hepatocytes, representing a significant clinical drawback. In the current study, rather than changing the composition, the formulation (F4) was sonicated to create smaller particles. Our study demonstrates that with as little as 30 seconds of sonication, the particles in B2 became significantly smaller (70% ~ 122±26 nm) than the non-sonicated formulation B1 (70% ~ 211±19 nm). We observed that only 30% of particles have a similar size distribution across the different batches (Table 3). Differences in particle size became clearly apparent when majority of the particles were counted (i.e. 90%). The results demonstrate that a relatively lower percentage of small particles are produced spontaneously during HPH and siRNA nanosome preparation. After the initial preparation step, the siRNA nanosomes may collide with each other with differing degrees of force and fuse together to form larger particles. The subsequent sonication (of the formulation) helps to separate these fused particles leading to a homogeneous distribution of smaller particles. Our study clearly shows that a brief sonication of the formulation for a period of 2 to 5 minutes results in the formation of a homogeneous siRNA nanosome with smaller particles. However, it was also observed that sonication in excess of 5 minutes leads to increase the particle size. The localized elevated temperature generated by prolonged sonication may be responsible for disrupting the thermodynamic environment of the saturated particles [34] leading to the formation of larger particles. In a separate note, our study conclusively demonstrates that neither the siRNA’s encapsulation efficiency, nor the encapsulated siRNA’s integrity was significantly affected by prolonged sonication due to presumed protection by protamine sulfate [35–37].
The functional aspects of siRNA nanosomes require not only their successful entry into the cell cytoplasm, but also their escape from the endosomal compartments and their ability to subsequently reach the RISC factors. Our comprehensive study has conclusively shown that the siRNA nanosomes are initially engulfed by the endosomes and then carried into the cell cytoplasm by endosomes within 2 hours of transfection. Though we have not examined the release of siRNA nanosomes from the endosomes and the subsequent break down of the particles to free siRNA, this process could be explained by the ion pair model proposed by Xu and Szoka [38]. The model states that the interaction of cationic lipids with anionic lipids in the endosomes may be responsible for the quick entry and release of siRNA nanosomes from the endosomes. Also, as suggested by Tseng et al. [39], the near complete release of siRNA from the siRNA nanosomes into the cytoplasm within 12 hours of transfection is largely due to the presence of the cationic peptide (i.e. PS) within the nanosomes which helped in de-assembling siRNA from the complex and increasing the ion pair effects for quick endosomal escape. The release of siRNA from the siRNA nanosomes was also confirmed in this study by the functional gene silencing activities of siRNA nanosomes in inhibiting HCV replication in vitro and GAPDH reduction both in vitro and in vivo.
Delivery of siRNA encapsulated nanoparticles in vivo largely depends on the delivery technique. In this context, Larson et al. [40] conducted a comparative study of siRNA delivery by different routes, and concluded that the deposition of siRNA encapsulated nanoparticles within different organs (liver, kidney, lung, spleen, bone and heart) differ based on the delivery route. Their results indicate that there is high siRNA uptake by the spleen and weak uptake by the liver when siRNA nanoparticles are administrated via the IP route [40]. Our results contradict these findings. We observed high siRNA deposition in the liver and weak uptake by the spleen following IP delivery (Fig. 6). In this context, another study has recently shown that if the particles are larger than 141 nm, they will be unable to enter into the liver hepatocytes [24,25]. Since our non-sonicated siRNA nanosomal particles (B1) are comparatively larger (70% ~ 211±19); they were only minimally taken up by the liver hepatocytes. In contrast, as the majority of the particles in our sonicated siRNA nanosomes (B6) are smaller (70% ~ 101±18 nm); they were deposited in significant amounts in the liver hepatocytes. Since Larson et al. [40] have not indicated the optimal particle size of their siRNA nanoparticles, we offer the hypothesis that the weak deposition of siRNA in the liver by IP delivery was possibly due to the larger particle size of siRNA complexes (> 150 nm). Our findings clearly indicate that if the particle size is maintained < 150 nm, they will be deposited in the liver hepatocytes following both IP and IV delivery. These findings were also confirmed by the significant reduction of GAPDH in the liver hepatocytes by the sonicated nanosomes (B6), compared to their non-sonicated counterpart (B1) (Fig. 7B & Fig. 7C).
Immunogenicity or non-specific side effects of gene delivery vehicles are major issues confronting clinical applications. In general, the type or composition of lipids, overall surface charge and the ratio of lipid to siRNA used in the formulation influences the overall toxicity. siRNA containing DOTAP lipoplex [41] as well as siRNA containing PEI or PLL polycations [42] have been reported to induce IFN response and cytokine release. Recently, Semple et al. have reported that rationally designed ionizable cationic lipids of stable nucleic acid lipid particles (SNALP) can maintain significant siRNA knock-down efficiency, while rendering well tolerance of high doses by small animals (i.e. rats) and non-human primates (i.e. monkeys) with no obvious treatment-related changes in animal appearance or behavior [43]. Similarly, in our in vivo delivery of siRNA nanosomes to mice, no abnormal physical behavior, or depression of the mice was noticed, nor were there any abnormal clinical changes in the liver tissue as determined by histochemical analysis (H&E). However, an assessment of abnormal features, such as unusual cytokine release or enhanced enzymatic activity for a prolonged period of time, is required for the potential use of this delivery system in clinical applications.
The delivery of nanoparticles to the liver hepatocytes can be enhanced by conjugating the particles with liver specific antibodies which can specifically recognize and bind to the ligands on the hepatocyte cell surface, such as asyloglycoprotein receptors (ASGP-R) [24,44]. However, Fumoto et al. [24] have reported that the delivery of ASGP-R recognizable nanoparticles to the liver hepatic cells will be diminished if the particles are larger than 150 nm. If the particles are smaller than 150 nm and if they can be conjugated with ASGP-R recognizable antibodies, the overall delivery of the siRNA encapsulated nanosomes to the liver hepatocytes will be significantly improved and this may be an important requirement for the strategic designing of complete clearance of HCV. Further modification of the siRNA encapsulated nanosomes for targeted delivery to the liver for complete clearance of HCV in animal model is under investigation.
5. Conclusion
This study was focused on the development of an effective siRNA delivery system for the treatment of HCV. A lipid based nanosomal formulation was developed for siRNA delivery by optimizing the lipid to siRNA ratio. The efficacy of the formulation to clear HCV was tested in an in vitro cell culture model. The formulation with a higher lipid to siRNA ratio (13.36:1) was preferred for its combined effect of significant virus clearance while maintaining minimal cytotoxicity. The formulation was further optimized without disrupting siRNA integrity or siRNA encapsulation to get a favorable particle size (~100 nm) which resulted in a significant deposition of siRNA into the liver hepatocytes. This study thus in general sets the stage for further evaluation of the formulation in the treatment of HCV.
Acknowledgments
This work was funded in part by the NIH grants 1R01CA127481, R21CA129776, 1G12RR026260-01, P20CA118768-02, and LCRC, Louisiana Board of Regents RC/EEP (2007-11), LEQSF(2007-12)-ENH-PKSFI-PRS-02 and Military Infectious Disease Research Program grant # W81XWH-07-1-0136.
Footnotes
Publisher's Disclaimer: This is a PDF file of an unedited manuscript that has been accepted for publication. As a service to our customers we are providing this early version of the manuscript. The manuscript will undergo copyediting, typesetting, and review of the resulting proof before it is published in its final citable form. Please note that during the production process errors may be discovered which could affect the content, and all legal disclaimers that apply to the journal pertain.
References
- 1.Davis ME. The first targeted delivery of siRNA in humans via a self-assembling, cyclodextrin polymer-based nanoparticle: from concept to clinic. Mol Pharm. 2009;6:659–668. doi: 10.1021/mp900015y. [DOI] [PubMed] [Google Scholar]
- 2.Pan Q, Henry SD, Metselaar HJ, Scholte B, Kwekkeboom J, Tilanus HW, Janssen HL, van der Laan LJ. Combined antiviral activity of interferon-alpha and RNA interference directed against hepatitis C without affecting vector delivery and gene silencing. J Mol Med. 2009;87:713–722. doi: 10.1007/s00109-009-0470-3. [DOI] [PMC free article] [PubMed] [Google Scholar]
- 3.Chevalier C, Saulnier A, Benureau Y, Flechet D, Delgrange D, Colbere-Garapin F, Wychowski C, Martin A. Inhibition of hepatitis C virus infection in cell culture by small interfering RNAs. Mol Ther. 2007;15:1452–1462. doi: 10.1038/sj.mt.6300186. [DOI] [PMC free article] [PubMed] [Google Scholar]
- 4.Tijsterman M, Plasterk RH. Dicers at RISC; the mechanism of RNAi. Cell. 2004;117:1–3. doi: 10.1016/s0092-8674(04)00293-4. [DOI] [PubMed] [Google Scholar]
- 5.Fire A, Xu S, Montgomery MK, Kostas SA, Driver SE, Mello CC. Potent and specific genetic interference by double-stranded RNA in Caenorhabditis elegans. Nature. 1998;391:806–811. doi: 10.1038/35888. [DOI] [PubMed] [Google Scholar]
- 6.Elbashir SM, Harborth J, Lendeckel W, Yalcin A, Weber K, Tuschl T. Duplexes of 21-nucleotide RNAs mediate RNA interference in cultured mammalian cells. Nature. 2001;411:494–498. doi: 10.1038/35078107. [DOI] [PubMed] [Google Scholar]
- 7.Colbere-Garapin F, Blondel B, Saulnier A, Pelletier I, Labadie K. Silencing viruses by RNA interference. Microbes Infect. 2005;7:767–775. doi: 10.1016/j.micinf.2005.02.003. [DOI] [PMC free article] [PubMed] [Google Scholar]
- 8.Leonard JN, Schaffer DV. Antiviral RNAi therapy: emerging approaches for hitting a moving target. Gene Ther. 2006;13:532–540. doi: 10.1038/sj.gt.3302645. [DOI] [PMC free article] [PubMed] [Google Scholar]
- 9.McCaffrey AP, Meuse L, Pham TT, Conklin DS, Hannon GJ, Kay MA. RNA interference in adult mice. Nature. 2002;418:38–39. doi: 10.1038/418038a. [DOI] [PubMed] [Google Scholar]
- 10.Lewis DL, Hagstrom JE, Loomis AG, Wolff JA, Herweijer H. Efficient delivery of siRNA for inhibition of gene expression in postnatal mice. Nat Genet. 2002;32:107–108. doi: 10.1038/ng944. [DOI] [PubMed] [Google Scholar]
- 11.McCaffrey AP, Nakai H, Pandey K, Huang Z, Salazar FH, Xu H, Wieland SF, Marion PL, Kay MA. Inhibition of hepatitis B virus in mice by RNA interference. Nat Biotechnol. 2003;21:639–644. doi: 10.1038/nbt824. [DOI] [PubMed] [Google Scholar]
- 12.Yano J, Hirabayashi K, Nakagawa S, Yamaguchi T, Nogawa M, Kashimori I, Naito H, Kitagawa H, Ishiyama K, Ohgi T, Irimura T. Antitumor activity of small interfering RNA/cationic liposome complex in mouse models of cancer. Clin Cancer Res. 2004;10:7721–7726. doi: 10.1158/1078-0432.CCR-04-1049. [DOI] [PubMed] [Google Scholar]
- 13.Andersen MO, Howard KA, Paludan SR, Besenbacher F, Kjems J. Delivery of siRNA from lyophilized polymeric surfaces. Biomaterials. 2008;29:506–512. doi: 10.1016/j.biomaterials.2007.10.003. [DOI] [PubMed] [Google Scholar]
- 14.Engelhardt JF, Simon RH, Yang Y, Zepeda M, Weber-Pendleton S, Doranz B, Grossman M, Wilson JM. Adenovirus-mediated transfer of the CFTR gene to lung of nonhuman primates: biological efficacy study. Hum Gene Ther. 1993;4:759–769. doi: 10.1089/hum.1993.4.6-759. [DOI] [PubMed] [Google Scholar]
- 15.Herz J, Gerard RD. Adenovirus-mediated transfer of low density lipoprotein receptor gene acutely accelerates cholesterol clearance in normal mice. Proc Natl Acad Sci USA. 1993;90:2812–2816. doi: 10.1073/pnas.90.7.2812. [DOI] [PMC free article] [PubMed] [Google Scholar]
- 16.de Martimprey H, Vauthier C, Malvy C, Couvreur P. Polymer nanocarriers for the delivery of small fragments of nucleic acids: oligonucleotides and siRNA. Eur J Pharm Biopharm. 2009;71:490–504. doi: 10.1016/j.ejpb.2008.09.024. [DOI] [PubMed] [Google Scholar]
- 17.Patil Y, Panyam J. Polymeric nanoparticles for siRNA delivery and gene silencing. Int J Pharm. 2009;367:195–203. doi: 10.1016/j.ijpharm.2008.09.039. [DOI] [PMC free article] [PubMed] [Google Scholar]
- 18.Sorensen DR, Leirdal M, Sioud M. Gene silencing by systemic delivery of synthetic siRNAs in adult mice. J Mol Biol. 2003;327:761–766. doi: 10.1016/s0022-2836(03)00181-5. [DOI] [PubMed] [Google Scholar]
- 19.Wu SY, McMillan NA. Lipidic systems for in vivo siRNA delivery. AAPS J. 2009;11:639–652. doi: 10.1208/s12248-009-9140-1. [DOI] [PMC free article] [PubMed] [Google Scholar]
- 20.Akhtar S, Benter IF. Nonviral delivery of synthetic siRNAs in vivo. J Clin Invest. 2007;117:3623–3632. doi: 10.1172/JCI33494. [DOI] [PMC free article] [PubMed] [Google Scholar]
- 21.Verma UN, Surabhi RM, Schmaltieg A, Becerra C, Gaynor RB. Small interfering RNAs directed against beta-catenin inhibit the in vitro and in vivo growth of colon cancer cells. Clin Cancer Res. 2003;9:1291–1300. [PubMed] [Google Scholar]
- 22.de Fougerolles A, Vornlocher HP, Maraganore J, Lieberman J. Interfering with disease: a progress report on siRNA-based therapeutics. Nat Rev Drug Discov. 2007;6:443–453. doi: 10.1038/nrd2310. [DOI] [PMC free article] [PubMed] [Google Scholar]
- 23.Kim DH, Rossi JJ. Strategies for silencing human disease using RNA interference. Nat Rev Genet. 2007;8:173–184. doi: 10.1038/nrg2006. [DOI] [PubMed] [Google Scholar]
- 24.Fumoto S, Nakadori F, Kawakami S, Nishikawa M, Yamashita F, Hashida M. Analysis of hepatic disposition of galactosylated cationic liposome/plasmid DNA complexes in perfused rat liver. Pharm Res. 2003;20:1452–1459. doi: 10.1023/a:1025766429175. [DOI] [PubMed] [Google Scholar]
- 25.Higuchi Y, Kawakami S, Fumoto S, Yamashita F, Hashida M. Effect of the particle size of galactosylated lipoplex on hepatocyte-selective gene transfection after intraportal administration. Biol Pharm Bull. 2006;29:1521–1523. doi: 10.1248/bpb.29.1521. [DOI] [PubMed] [Google Scholar]
- 26.Berger N, Sachse A, Bender J, Schubert R, Brandl M. Filter extrusion of liposomes using different devices: comparison of liposome size, encapsulation efficiency, and process characteristics. Int J Pharm. 2001;223:55–68. doi: 10.1016/s0378-5173(01)00721-9. [DOI] [PubMed] [Google Scholar]
- 27.Pupo E, Padron A, Santana E, Sotolongo J, Quintana D, Duenas S, Duarte C, de la Rosa MC, Hardy E. Preparation of plasmid DNA-containing liposomes using a high-pressure homogenization--extrusion technique. J Control Release. 2005;104:379–396. doi: 10.1016/j.jconrel.2005.02.001. [DOI] [PubMed] [Google Scholar]
- 28.Hazari S, Chandra PK, Poat B, Datta S, Garry RF, Foster TP, Kousoulas G, Wakita T, Dash S. Impaired antiviral activity of interferon alpha against hepatitis C virus 2a in Huh-7 cells with a defective Jak-Stat pathway. Virol J. 2010;7:36. doi: 10.1186/1743-422X-7-36. [DOI] [PMC free article] [PubMed] [Google Scholar]
- 29.Khalil IA, Kogure K, Akita H, Harashima H. Uptake pathways and subsequent intracellular trafficking in nonviral gene delivery. Pharmacol Rev. 2006;58:32–45. doi: 10.1124/pr.58.1.8. [DOI] [PubMed] [Google Scholar]
- 30.Hossain S, Stanislaus A, Chua MJ, Tada S, Tagawa Y, Chowdhury EH, Akaike T. Carbonate apatite-facilitated intracellularly delivered siRNA for efficient knockdown of functional genes. J Control Release. 2010;147:101–108. doi: 10.1016/j.jconrel.2010.06.024. [DOI] [PubMed] [Google Scholar]
- 31.Watanabe T, Umehara T, Kohara M. Therapeutic application of RNA interference for hepatitis C virus. Adv Drug Deliv Rev. 2007;59:1263–1276. doi: 10.1016/j.addr.2007.03.022. [DOI] [PubMed] [Google Scholar]
- 32.Watanabe T, Umehara T, Yasui F, Nakagawa S, Yano J, Ohgi T, Sonoke S, Satoh K, Inoue K, Yoshiba M, Kohara M. Liver target delivery of small interfering RNA to the HCV gene by lactosylated cationic liposome. J Hepatol. 2007;47:744–750. doi: 10.1016/j.jhep.2007.06.015. [DOI] [PubMed] [Google Scholar]
- 33.Braet F, Wisse E. Structural and functional aspects of liver sinusoidal endothelial cell fenestrae: a review. Comp Hepatol. 2002;1:1. doi: 10.1186/1476-5926-1-1. [DOI] [PMC free article] [PubMed] [Google Scholar]
- 34.Maulucci G, De Spirito M, Arcovito G, Boffi F, Castellano AC, Briganti G. Particle size distribution in DMPC vesicles solutions undergoing different sonication times. Biophys J. 2005;88:3545–3550. doi: 10.1529/biophysj.104.048876. [DOI] [PMC free article] [PubMed] [Google Scholar]
- 35.Kundu AK, Hazari S, Chinta DD, Pramar YV, Dash S, Mandal TK. Development of nanosomes using high-pressure homogenization for gene therapy. J Pharm Pharmacol. 2010;62:1103–1111. doi: 10.1111/j.2042-7158.2010.01140.x. [DOI] [PubMed] [Google Scholar]
- 36.Dunne M, Bibby DC, Jones JC, Cudmore S. Encapsulation of protamine sulphate compacted DNA in polylactide and polylactide-co-glycolide microparticles. J Control Release. 2003;92:209–219. doi: 10.1016/s0168-3659(03)00304-3. [DOI] [PubMed] [Google Scholar]
- 37.Li S, Rizzo MA, Bhattacharya S, Huang L. Characterization of cationic lipid-protamine-DNA (LPD) complexes for intravenous gene delivery. Gene Ther. 1998;5:930–937. doi: 10.1038/sj.gt.3300683. [DOI] [PubMed] [Google Scholar]
- 38.Xu Y, Szoka FC., Jr Mechanism of DNA release from cationic liposome/DNA complexes used in cell transfection. Biochemistry. 1996;35:5616–5623. doi: 10.1021/bi9602019. [DOI] [PubMed] [Google Scholar]
- 39.Tseng YC, Mozumdar S, Huang L. Lipid-based systemic delivery of siRNA. Adv Drug Deliv Rev. 2009;61:721–731. doi: 10.1016/j.addr.2009.03.003. [DOI] [PMC free article] [PubMed] [Google Scholar]
- 40.Larson SD, Jackson LN, Chen LA, Rychahou PG, Evers BM. Effectiveness of siRNA uptake in target tissues by various delivery methods. Surgery. 2007;142:262–269. doi: 10.1016/j.surg.2007.03.011. [DOI] [PMC free article] [PubMed] [Google Scholar]
- 41.Ma Z, Li J, He F, Wilson A, Pitt B, Li S. Cationic lipids enhance siRNA-mediated interferon response in mice. Biochem Biophys Res Commun. 2005;330:755–759. doi: 10.1016/j.bbrc.2005.03.041. [DOI] [PubMed] [Google Scholar]
- 42.Judge AD, Sood V, Shaw JR, Fang D, McClintock K, MacLachlan I. Sequence-dependent stimulation of the mammalian innate immune response by synthetic siRNA. Nat Biotechnol. 2005;23:457–462. doi: 10.1038/nbt1081. [DOI] [PubMed] [Google Scholar]
- 43.Semple SC, Akinc A, Chen J, Sandhu AP, Mui BL, et al. Rational design of cationic lipids for siRNA delivery. Nat Biotechnol. 2010;28:172–176. doi: 10.1038/nbt.1602. [DOI] [PubMed] [Google Scholar]
- 44.Kawakami S, Fumoto S, Nishikawa M, Yamashita F, Hashida M. In vivo gene delivery to the liver using novel galactosylated cationic liposomes. Pharm Res. 2000;17:306–313. doi: 10.1023/a:1007501122611. [DOI] [PubMed] [Google Scholar]