Abstract
Developing advanced ionic electroactive devices such as ionic actuators and supercapacitors requires the understanding of ionic diffusion and drifting processes, which depend on the distances over which the ions travel, in these systems. The charge dynamics of [C4mim][PF6] ionic liquid films and Aquivion membranes with 40 wt% [C2mim][TfO] were investigated over a broad film thickness (d) range. It was found that the double layer charging time τDL follows the classic model τDL = λDd/(2D) very well, where D is the diffusion coefficient and λD the Debye length. In the longer time regimes (t ≫ τDL) where diffusion dominates, the charge dynamics become voltage dependent. For low applied voltage, the later stage charge process seems to follow the d2 dependence. However, at high voltages (> 0.5 V) in which significant device responses occur, the charging process does not show d2 dependence so that τdiff = d2/(4D), corresponding to the ion diffusion from the bulk region, was not observed.
Keywords: Ionic liquid, Iomomer, Ionic electroactive polymer actuators
I. INTRODUCTION
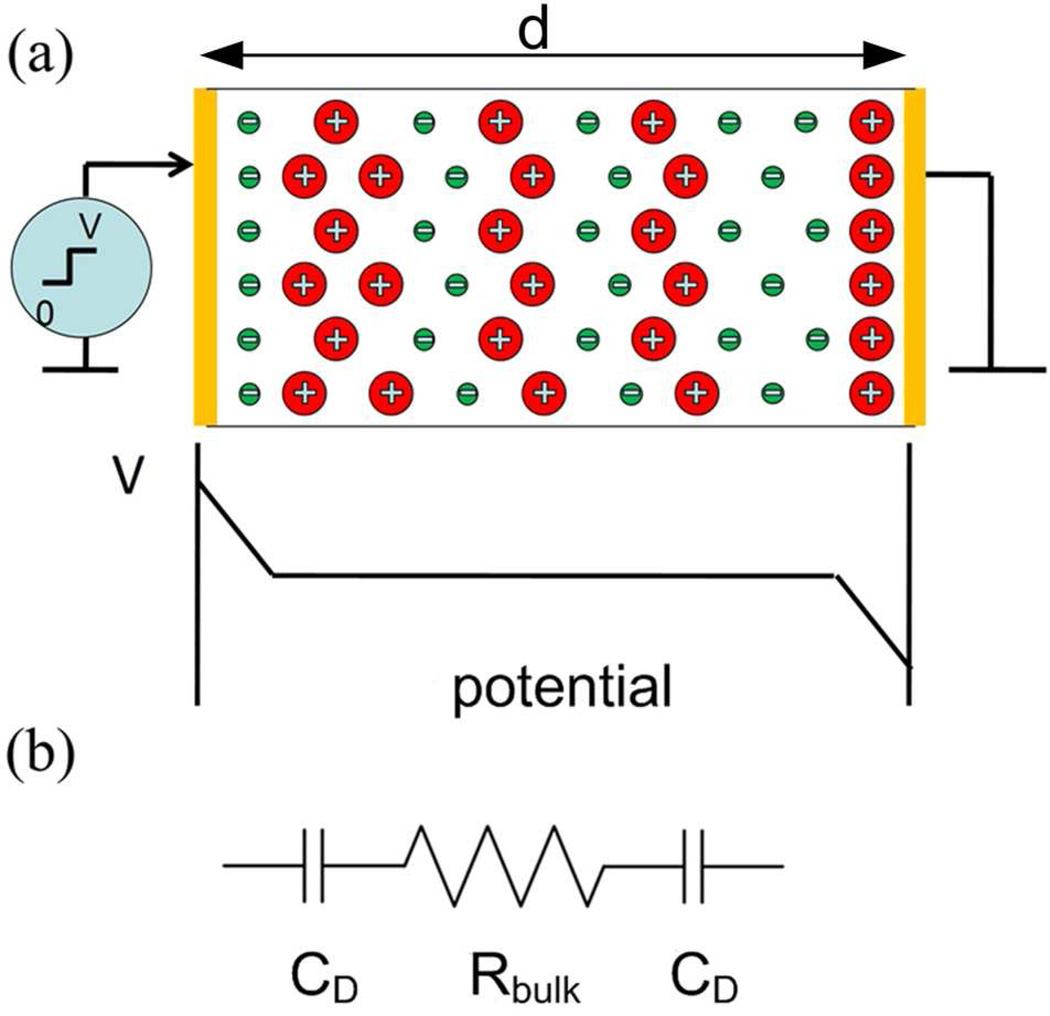
Ion transport and storage in electrolyte containing films are of great interest for ionic electroactive devices, such as actuators, sensors, energy harvesting devices, and supercapacitors.1–5 In general, charge transport is a result of drift and diffusion, described by the ion mobility μ, diffusion coefficient D, and mobile ion concentration n, e.g. the Nernst-Planck equation where ψ+ and ψ− are the fluxes of positive and negative charges. The first term on the right hand side of the equation is the drift current and the second term describes the diffusion current. In dilute systems μ and D are related through the Einstein equation, D = μkT/q, where k is Boltzmann’s constant, T is temperature, and q is the charge ions carry.6–10 During charging, ions in the electrolyte moves towards electrodes of opposite polarity due to the electric field created by applied potential between charged electrodes which leads to the screening of the voltage and a potential drop at the two electrodes as illustrated in figure 1(a). For the metal-ionic conductor-metal (MIM) system of figure 1(a) under a step voltage (from 0 at t < 0 to V volts at t > 0), the initial transient current follows the charging of electric double layer capacitors CD in series with a bulk resistor Rbulk (see figure 1(b)),6–9
| (1) |
where τDL = dεε0/(2λDσ) = RCD/2, describes the typical charging time for the electric double layer which has a thickness λD, the Debye length,
| (2) |
where Ze = q is the mobile ion charge (Z = 1 for the ionic liquids investigated in this paper), e is the electron charge, ε is the relative dielectric permittivity, and ε0 is the vacuum permittivity (ε0 = 8.854 × 10⁻¹² Fm−1). I0 == σVS/d, where σ (= qnμ) is the conductivity, d is the electrolyte film thickness, and S is the electrode area. For the ionic systems investigated in this paper, the Debye layer thickness λD is ~ 1 nm and λDL ≪ 10−2 seconds. It should be pointed out that τDL here is the same as the electrode polarization time constant τEP in the MacDonald/Coelho model, treating electrode polarization as a simple Debye relation.11–13 It is also noted that our recent study reveals that for the ionic systems investigated here, this model (figure 1(b) and eq. (1)) is valid up to 1 volt in these highly concentrated electrolyte systems.14
Figure 1.
(a) Schematics of an electrolyte containing film sandwiched between metal electrodes under an applied voltage. The schematic of the voltage drop across the film after it is charged, illustrating that most voltage drop occurs near the blocking electrodes where the mobile ions screen the charges in the metal electrodes. (b) The equivalent circuit of ionic film metal system where Rbulk is the bulk resistance of the film and CD is the electrical double layer capacitance.
For ionic electroactive devices, experimental results show that the device response time is much longer than τDL and hence it is crucial to develop an understanding of the charge dynamics at longer time scale compared to τDL. Several theoretical models have been advanced for the ionic systems of figure 1(a) to analyze the charge dynamics at longer time scales and modeling results suggest that following the initial charging process (t ~ τDL, which is < 10−2 seconds for the films studied here), there is a later charging process, dominated by diffusion from the bulk of the films.8, 9 In other words, the later stage charging process should scale with the time constant τdiff = d2/(4D). τdiff ≫ τDL since d ≫ λD and for the ionic systems studied in this paper, τdiff ranges from sub-seconds to tens of seconds.7–9, 15 For most ionic electroactive devices such as the ionic electroactive polymer (EAP) actuators and supercapacitors, the response time is in the same time range as τdiff and is much longer than τDL. For example, for ionic membrane actuators, substantial actuation occurs during this later stage charging process. Hence, one interesting question is whether by reducing the ionic containing film thickness d, a much faster device response can be achieved if τdiff is proportional to d2.
This paper investigates two ionic systems, a pure IL and an ionomer membrane containing ionic liquid (IL), focusing on the influence of the electrode separation d on the later stage (time > τDL) ion transport and storage processes. Ionic liquids (ILs), which are a class of salt in liquid form that contain both ions and neutral molecules, are used here as electrolytes because of many interesting properties that make them very attractive for ionic electroactive polymer (EAP) devices.16–18 For example, the vapor pressure of ionic liquids is negligibly low and as a result they will not evaporate out of the EAP devices when operated in ambient condition. It has been demonstrated that compared with water the use of ILs as solvent for EAP actuators can dramatically increase the lifetime of the transducer.19–21 Their high mobility leads to the potentially fast response of EAP devices while the wide electro-chemical window (~ 4 V) allows it for higher applied voltages.1–3, 16–18 Two ILs, [C4mim][PF6] and [C2mim] [TfO], were examined as electrolytes, where 1-butyl-3-methylimidazolium ([C4mim]+) and 1-ethyl-3-methylimidazolium ([C2mim]+) served as the cations and hexafluorophosphate ([PF6]−) and trifluoromethanesulfonate ([TfO]−) served as the anions. Both cations and anions are present in ionic liquids. Because of high concentration of these ions in ILs compared with that of the side chain SO3−, it is these cations and anions in ILs contribute to the ion transport here.14 Moreover, the interaction among these cations and anions would cause the mobile charges to form clusters which consist of cation and anion binding together dynamically as described in recent publications.10, 22, 23 For the study here it is assumed n+ = n− and μ+ = μ− (the subscripts + and − indicate positive and negative charges).
The experimental results reveal that over a broad thickness range and voltage range (< 4 V), the initial charge dynamics can be well described by the RC circuit model (figure 1(b)) where the resistance R is determined by the bulk conductivity of the ionic conductors and CD is determined by the Debye length, which does not change with the membrane thickness d. On the other hand, the later stage charge responses display both voltage dependence and thickness d dependence. By analyzing the data with a reduced time constant t/τdiff (τdiff = d2/(4D)), it was found that the later stage charging process becomes progressively faster with increased voltage. That is, for voltage ~ 0.1 V, the charging process seems to follow d2 dependence. However, for higher voltages (> 0.5 V), the later stage charging time becomes much shorter than τdiff (= d2/(4D)), suggesting that the ion diffusion distance is shorter than d/2 for thick films.
II. EXPERIMENTAL
The charge dynamics of a pure IL, 1-butyl-3-methylimidazolium hexafluorophosphate ([C4mim][PF6]), at different thicknesses sandwiched between the electrodes was studied. Pure ILs provide an attractive ionic system in which to study charge dynamics with different electrode gap thicknesses as many electrolytes are investigated in supercapacitors.24, 25 [C4mim][PF6] is chosen for the pure IL study due to its relatively low conductivity and proper viscosity (1.4 × 10⁻³ S/cm and 450 cP at room temperature), which makes sample preparation and electrical characterization easier. A very high conductivity will cause high currents and very short τDL in thin MIM cells which can be beyond the measurement range of the experiment’s set-up. It was also found that it was necessary to carry out the experiment at −20 °C to further lower the conductivity to (~3 × 10⁻⁵ S/cm) so that τDL for thin MIM cells is larger than the time resolution (~ 1 µs) of the experiment’s set-up.
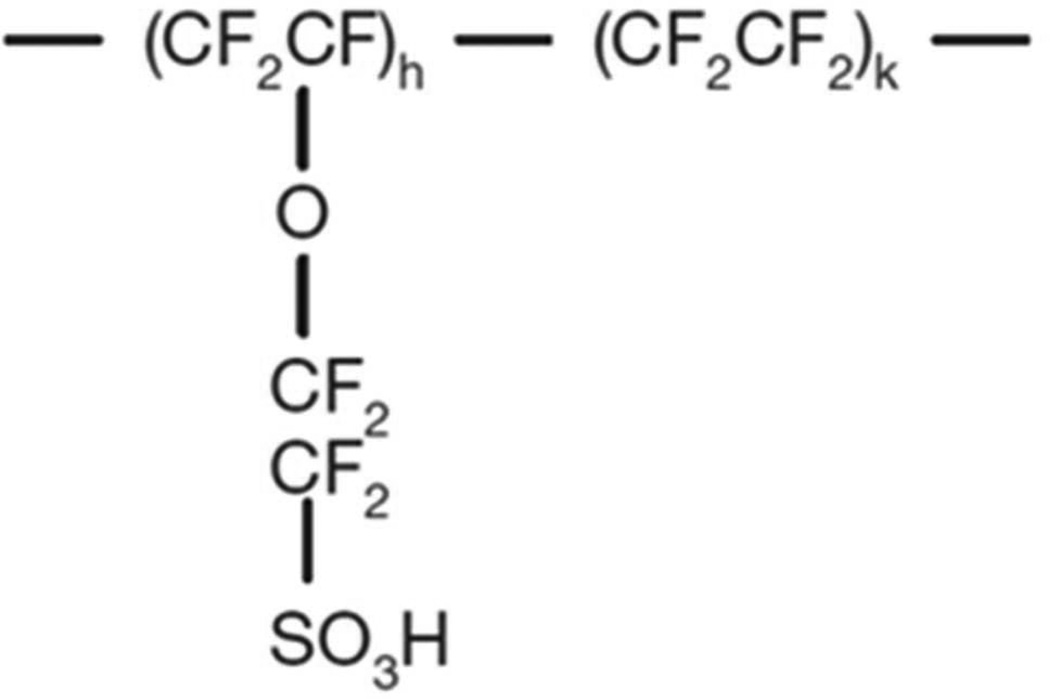
The ionomer of Aquivion with 40 wt% uptake of 1-ethyl-3-methylimidazolium trifluoromethanesulfonat ([C2mim][TfO]) is chosen for the ionomer system to investigate the influence of the ionomer matrix and more specifically the membrane thickness d on the charge dynamic of the IL electrolyte. This MIM material system has also been investigated for the ionic electroactive polymer actuators. Aquivion (Hyflon) is chosen for the ionomer membrane since it is known in the literature as a short side chain ionomer that may be more desirable than the normally used Nafion (indicated as a long side chain ionomer) for ionic EAP actuators.14, 20, 21, 26–29 These perfluorosulfonate ionomers consist of a polytetrafluoroethylene (PTFE) backbone and ether-linked tetrafluoroethylene side chains terminating in a sulfonic acid group as illustrated in figure 2. [C2mim][TfO] is chosen because of its high conductivity (8.6 × 10⁻³ S/cm) which ensures that the membrane with ILs has a high enough conductivity to be characterized, low viscosity (45 cP at 298 K) and a large electrochemical window (4.1 V). [C2mim][TfO] is one of the commonly used ionic liquids in ionic EAP actuators.14, 19, 21, 26, 30, 31 Our earlier studies have shown that 40 wt% [C2mim][TfO] uptake is above the critical IL uptake where the conductivity of the ionomer/IL membrane exhibits much higher conductivity (~ 9 × 10⁻⁶ S/cm) than that of the pure ionomer.14, 32, 33 It should also be noted that the Aquivion membrane without ILs exhibits very low ionic conductivity which makes it unsuitable for studying the charge dynamics here.
Figure 2.
Molecular structure of short side chain Aquivion ionomer (EW830)
Aquivion (EW830) solution, 1-butyl-3-methylimidazolium hexafluorophosphate ([C4mim][PF6]) and 1-ethyl-3-methylimidazolium trifluoromethanesulfonate ([C2mim][TfO]) were purchased from Solvay Solexis and Aldrich, respectively. All the materials were dried in a vacuum at 80 °C to remove moisture before processing and characterization. Pure ionic liquid was sandwiched between two Si/Ti/Au electrodes with a 1 mm2 electrode surface area to form metal-ionic conductor-metal sample systems. 3 µm Mylar and 20, 60 µm thick Kapton films are employed as the spacers for different thicknesses of the ionic conductors. The distance between electrodes was calibrated by measuring the capacitance C = ε0*S/d where S is the surface area of electrode and vacuum permittivity ε0 = 8.854 × 10⁻¹² Fm–1. The measured thickness of the gap is 4, 23 and 64 µm, respectively, for the MIM systems with these spacers. To infiltrate the ionic liquid into the gap between the two electrodes, [C4mim][PF6] was dropped on the gap and heated at 90 °C in a vacuum overnight. The capillary force drives the [C4mim][PF6] from one end to the other to fill the whole gap between the electrodes.
Aquivion solution blended with 40 wt% uptake of [C2mim][TfO] was prepared and then diluted by N-Methyl-2-pyrrolidone (NMP) solvent with a ratio of 1 : 3 for thicker films (11 and 20 µm thick) and 1 : 8 for thinner films (0.8 and 1.9 µm thick). Films were solution cast on metalized Si substrates. In this study, Si/Ti/Au substrate is prepared by e-beam evaporator with an electrode area of 1 mm2. Film thickness is controlled by the amount of mixture cast on the substrate. After drying at 96 °C for 10 hrs, the film is annealed at 150 °C for 2 hrs following. To form a metal-ionic conductor-metal (MIM) sample system, a 30 nm thick gold film is deposited as the top electrode.
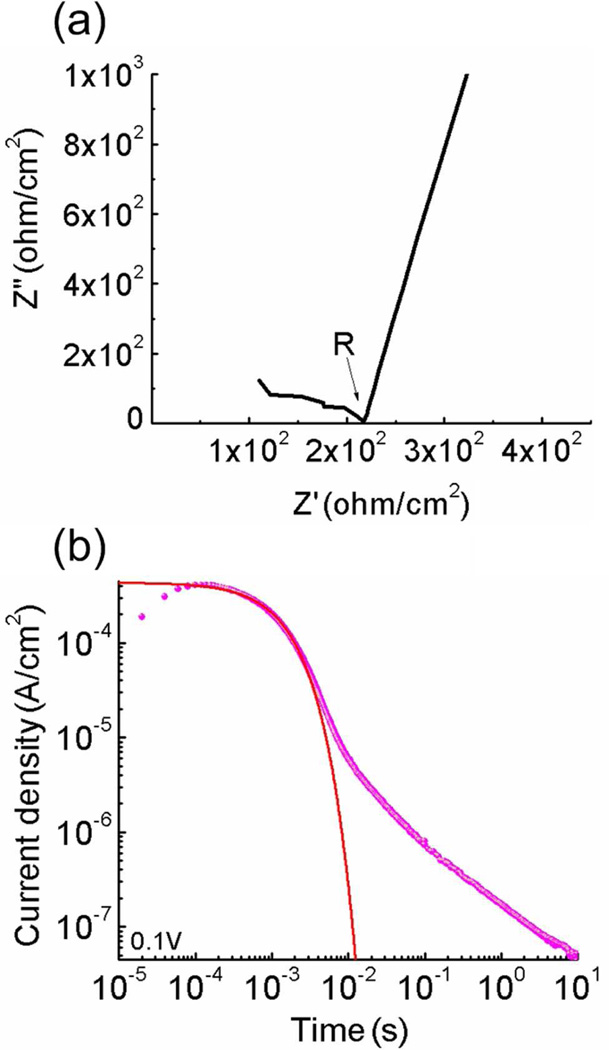
The electrical measurement was carried out in a sealed metal box with desiccant inside to prevent the absorption of moisture. The box was equipped with a thermocouple to monitor the temperature during the measurement. The impedance spectroscopy was measured by a potentiostat Princeton 2237. The dc conductivity was calculated from the impedance data by σ = d/RS, where R is determined from the Nyquist plot (see figure 3(a)). 14, 26 To obtain the dielectric constant of the membranes, the samples were cooled in an environment chamber (Versa Tenn III) to reduce the conductivity of the MIM system so that the dielectric constant can be measured within the frequency window of the set-up (which is below 1 MHz) before the screening of the applied field occurs, at frequencies ≫ 1/τDL. In contrast to the conductivity which decreases with temperature the dielectric constant of the ionomers is only very weakly temperature dependent and the value thus acquired can be used for room temperature.34–36 The transient current vs. time was acquired by a potentiostat (Princeton 2237) whose output was connected to a high sampling rate oscilloscope (< 1 µs) in order to capture charge response during the fast charging process. The accumulation of blocked charges on membrane electrodes and the charge imbalance in the membrane may affect the electrical measurement. Therefore, several cycles of Cyclic Voltammetry (CV) scan with a low voltage (< 1 V) and high scan rate were performed to help clean the electrode surface. The samples were shorted for at least 30 minutes to ensure that the charges redistributed to the equilibrium state as possible. 37
Figure 3.
(a) The Nyquist plot used to determine the membrane resistance R and (b) the current density (dots) and fitting (solid curve) to Eq. (1) of the 20 µm thick Aquivion membrane with 40 wt% uptake of [C2mim][TfO] under 0.1 V step voltage.
By fitting the experimental transient current I(t) under a step voltage with eq. (1), as illustrated in figure 3(b), and using the ε of the ionomer membrane (with ILs) or pure IL acquired from the impedance measurement, σ, μ, and n can be obtained by Eq. 3(a–c), respectively.6, 7, 38 All the time domain data presented in the figures of the paper are acquired directly experimently using the fast oscillacope interfaced with the potentiostat.
| (3a) |
| (3b) |
| (3c) |
Besides the time domain study, impedance spectroscope (frequency domain study) is also employed to study the capacitance and resistance changes with thickness d.
III. RESULTS AND DISCUSSION
3.1. Charge dynamics of pure ionic liquid of [C4mim][PF6] at different thicknesses between electrodes
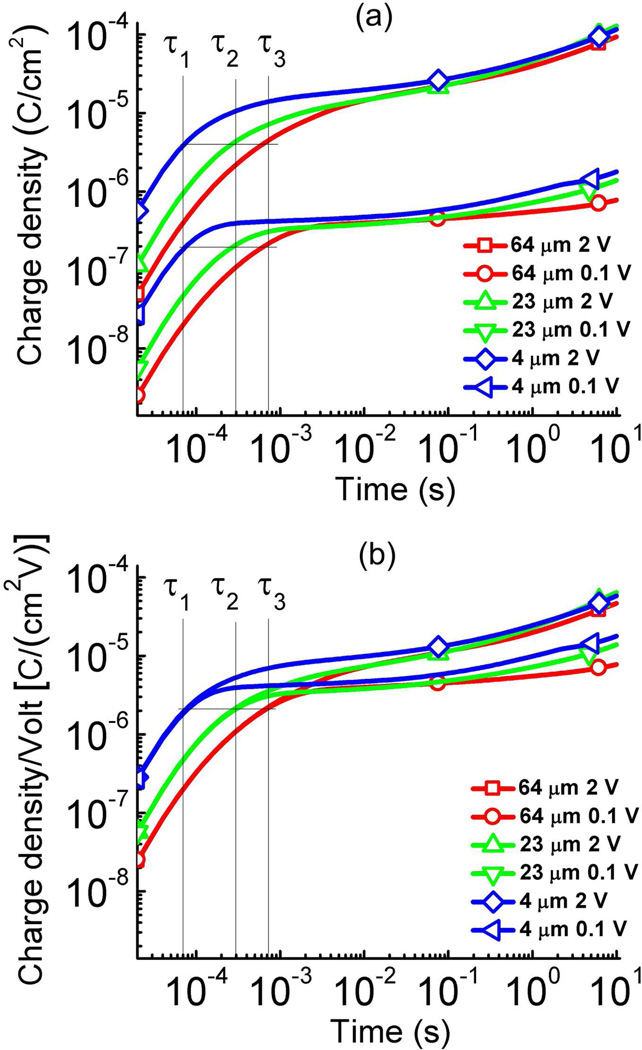
ILs provide a convenient system to study the thickness dependence of charge dynamics of MIM systems. For a MIM system with pure IL of [C4mim][PF6], the thinnest d for which we can fabricate the MIM cell is 4 µm. By fitting the transient current data for various gap thickness samples as illustrated in figure 3, σ, μ, τDL, λD are deduced for charging data under voltages < 1 V (see Table I). The charge response under a step voltage of 0.1 V for various gap thicknesses d is presented in figure 4. For [C4mim][PF6], there is no obvious change of σ and μ with thickness and within the experimental error the data obtained from 4 µm thick IL is the same as that from 64 µm thick IL. The charge response time τDL (which was obtained by fitting the transient current with Eq. (1)) for films of 4 µm, 23 µm, and 64 µm thick is also indicated in the figure and are presented in figure 4 as τ1 (7.05 × 10⁻⁵ s), τ2 (2.73 × 10⁻⁴ s), and, τ3 (8.09 × 10⁻⁴ s) respectively. These data indicate that the charge dynamics at a short time scale are controlled by the charging of the electrical double layer. Figure 4(b) presents the capacitance (charge density/voltage) under the stepped voltage vs. time. The data reveals that the double layer capacitances (at t = τDL) do not change with voltage. However, the capacitance corresponding to the later stage charging process increases with voltage, which is consistent with earlier studies.14, 20
Table I.
Summary of σ, μ, λD, τDL and τdiff for pure [C4mim][PF6] ionic liquid films with different thicknesses (d) under 0.1 V step voltage at −20 °C.
| Electrodes distance (d) | 64 µm | 23 µm | 4 µm |
|---|---|---|---|
| Conductivity σ (S/cm) | 3.01×10⁻⁵ | 3.15×10⁻⁵ | 3.34×10⁻⁵ |
| Mobility μ (cm2 V−1s−1) | 2.31×10⁻⁵ | 2.52×10⁻⁵ | 2.48×10⁻⁵ |
| Debye length λD (nm) | 1.28 | 1.32 | 0.825 |
| Double layer τDL (s) | 8.09×10⁻⁴ | 2.73×10⁻⁴ | 7.05×10⁻⁵ |
| Diffusion τdiff (s) | 20.22 | 2.41 | 0.17 |
Figure 4.
(a) The charge density as a function of time for the ionic liquid [C4mim][PF6] under 0.1 V and 2 V at the membrane thickness of d = 4 µm, 23 µm, and 64 µm. The data error is indicated by the size of the symbols at each data curve. τ1, τ2, and τ3 are τDL for 4, 23, 64 µm thick ionic systems. As indicated by Eq. (1), the charge density at t = τDL does not change with thickness d. (b) the charge density/voltage as a function of time for the data in (a) to show nonlinear capacitance response in these ionic systems. The error bar is indicated by the size of the symbols in the figure (the error bar is the same as the symbol size).
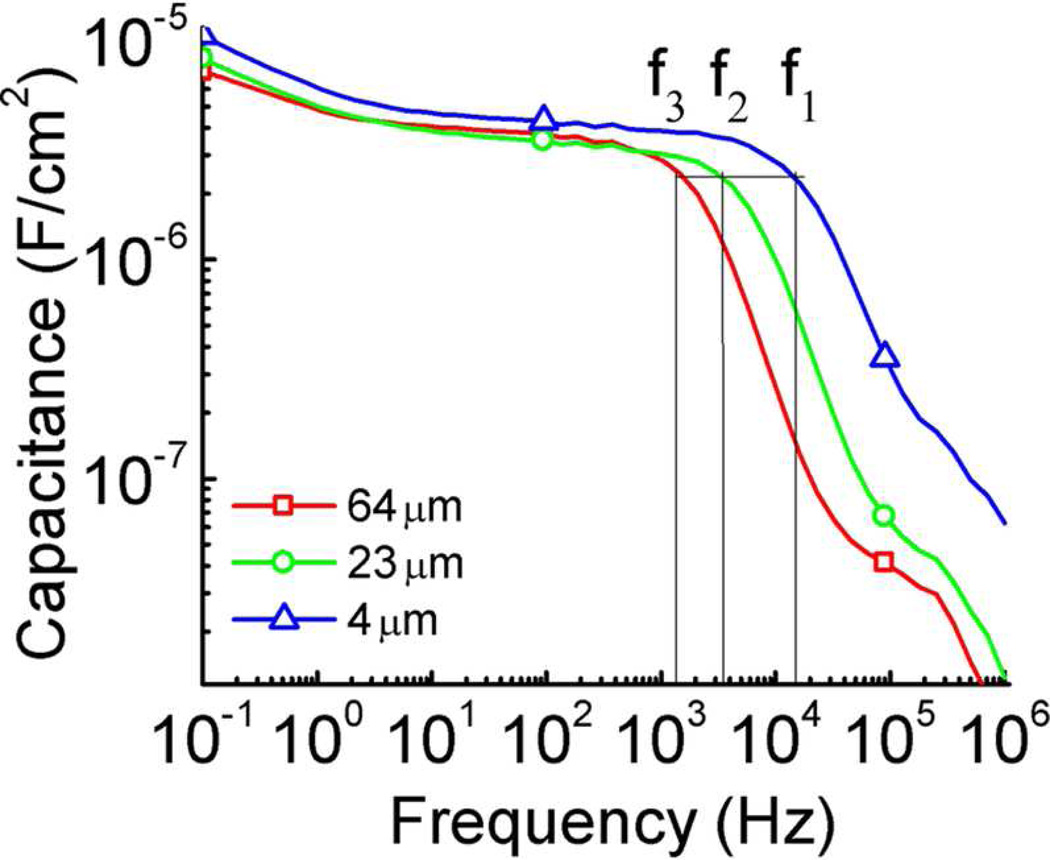
The impedance data (frequency domain data) for this MIM system is presented in figure 5. In figure 5(a), the capacitance C of the complex impedance Z = C exp (jδ) where δ is the phase angle is presented which shows that capacitance at fi = 1/τDL does not change with the gap thickness d between the electrodes, which is consistent with the data observed from the time domain responses in figure 4. Here the frequency f1 = 1/τ1, f2 = 1/τ2, and f3 = 1/τ3. The result is also consistent with the commonly used electrode polarization model where the electrode polarization time constant is τEP = 1/(fi).11 Table I lists σ, μ, λD, τDL and τdiff (= d2/4D) deduced for films with different thickness d. The Einstein equation, which is valid for dilute ionic systems, is used as an estimation to deduce D and hence τdiff. Because of high ion concentration and hence strong interaction, the D values deduced here might be higher than that measured directly from NMR.10, 17 Nevertheless, the results show that τdiff is much larger than τDL and electrical response of the electroactive devices is mainly controlled by this later stage ion diffusion process.
Figure 5.
The capacitance as a function of frequency for ionic liquid [C4mim][PF6] at the electrodes distance of d = 4 µm, 23 µm, and 64 µm under 0.1 V step voltage. The capacitance C at the characteristic frequency fi = 1/τDL for electrodes distance of 4 µm, 23 µm, and 64 µm thick is also indicated in the figure, as f1 (1.4 × 10⁴ Hz for 4 µm), f2 (3.66 × 10³ Hz for 23 µm), and f3 (1.23 × 10³ Hz for 64 µm), respectively. The data show that the C at fi does not change with electrodes distance d. The error bar is indicated by the size of the symbols in the figure.
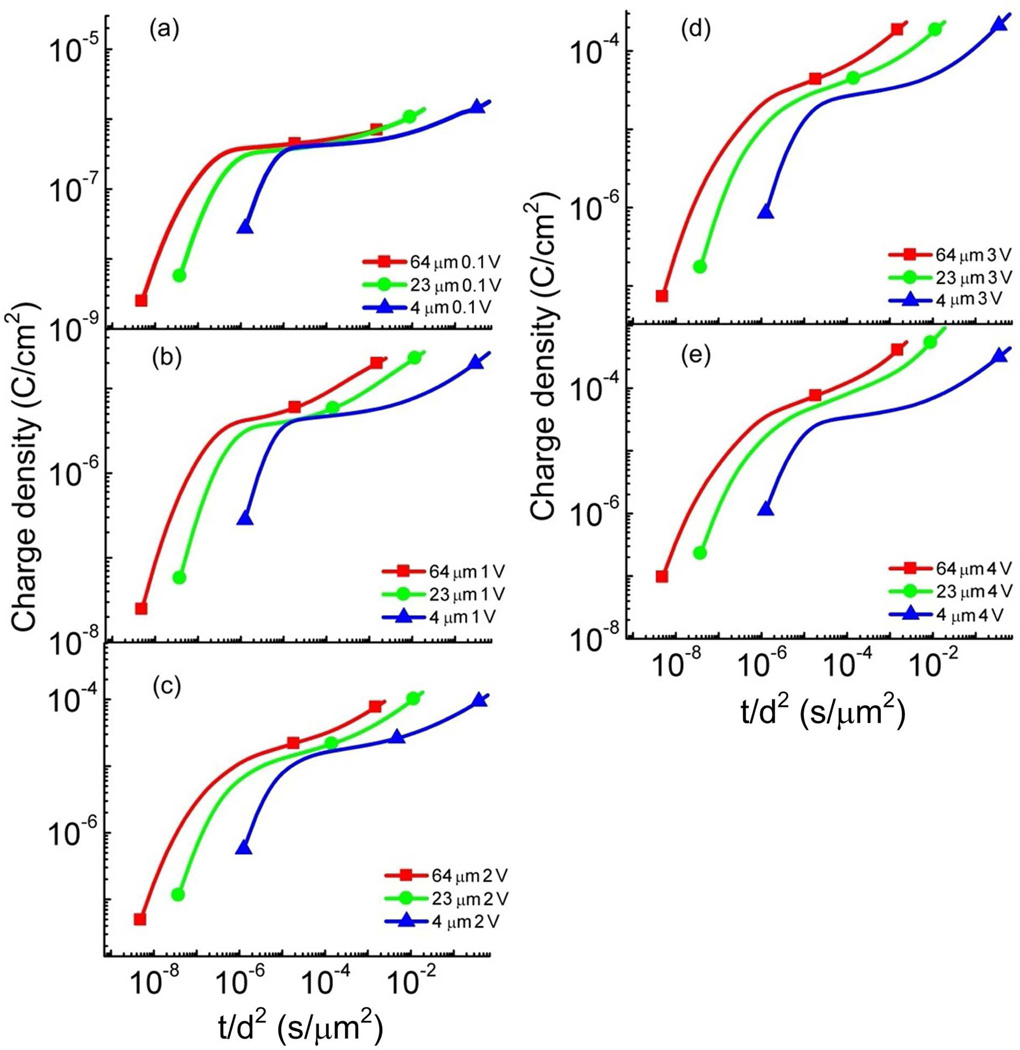
As revealed in figure 4, the current responses at longer times beyond τDL (between 10−1 s and 10 seconds, for example) under 2 V do not show significant changes with thickness that is different from that at 0.1 V. To further illustrate this difference, figure 6 presents the charge response data versus the reduced time t/d2. The charging time obtained under 0.1 V seems to follow approximately d2 thickness dependence at reduced time interval between 10−5 to 10−2 (s/µm2) showing approximately the same charging responses. For higher voltages (> 0.5 V), the deviation of the charging time from the d2 dependence becomes progressively stronger. In fact, for data under 2 V or higher applied voltage, the later stage charging process seems not to show much change with thickness (see figure 4). As shown in figure 6 the charging response of 64 and 23 µm films show a much higher charge density than that of the 4 µm sample at the reduced time interval between 10−5 to 10−2 (s/µm2), implying that at high voltages the charge diffusion distance for the MIM systems studied here is mainly from the regions near the electrodes (< d/2) rather than from the bulk of the films.
Figure 6.
The charge density as a function of t/d2 for the ionic liquid [C4mim][PF6] under (a) 0.1 V, (b) 1 V, (c) 2 V, (d) 3 V, and (e) 4 V step voltages at the film thicknesses d = 4 µm, 23 µm, and 64 µm, respectively. The error bar is indicated by the size of the symbols in the figure. The unit for the reduced time axis (x-axis, t/d2) is s/µm2.
3.2 Charge dynamics of Aquivion membranes with 40 wt% [C2mim][TfO] uptake at different membrane thicknesses
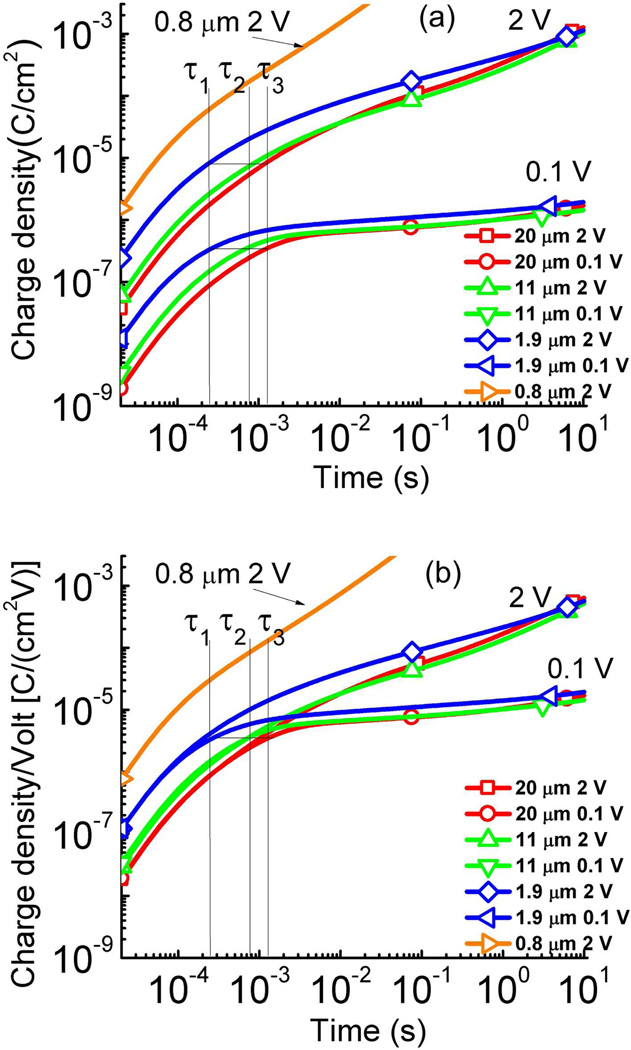
The current responses of Aquivion with 40 wt% [C2mim][TfO] uptake under various step voltages (from 0.1 V to 4 V) were characterized for membranes of 0.8 µm, 1.9 µm, 11 µm, and 20 µm thick to investigate the influence of the membrane thickness d on the charge dynamics of this MIM system. Figure 7 presents the charge density with time acquired under a 0.1 V step voltage for membranes of different thicknesses. Fitting of the transient current data (as illustrated in figure 3) yields σ, μ, λD, and τDL for this MIM system (summarized in Table II for data acquired under 0.1 V). The charge response time τDL (see Eq. (1)) for films of 1.9 µm, 11 µm, and 20 µm thick is also indicated in the figure 7 and is labeled as τ1 (2.49 × 10⁻⁴ s for 1.9 µm), τ2 (7.25 × 10⁻⁴ s for 11 µm), and τ3 (1.29 × 10⁻³ s for 20 µm), respectively. The data show that the charge dynamic at a short time scale is controlled by the charging of the electrical double layer and CD does not change with film thickness and voltage studied here.
Figure 7.
(a) The charge density as a function of time for the Aquivion film with 40 wt% uptake of [C2mim][TfO] under 0.1 V and 2 V at the membrane thickness of d = 0.8 µm, 1.9 µm, 11 µm, and 20 µm. The abnormal high charge response of 0.8 µm sample may be a result of the high conduction current due to the reduction of the bulk thickness. τ1, τ2, and τ3 are τDL for membranes of 1.9, 11, and 20 µm. As indicated by Eq. (1), the charge density at t = τDL does not change with thickness d. (b) the charge density/voltage as a function of time for the data in (a) to show nonlinear capacitance in these ionic systems. The error bar is indicated by the size of the symbols in the figure.
Table II.
Summary of σ, μ, λD, τDL and τdiff for the Aquivion membranes with 40 wt% [C2mim][TfO] with different thicknesses (d) under 0.1 V step voltage at 25 °C.
| Membrane thickness (d) | 20 µm | 11 µm | 1.9 µm |
|---|---|---|---|
| Conductivity σ (S/cm) | 9.1×10⁻⁶ | 9.0×10⁻⁶ | 8.6×10⁻⁶ |
| Mobility μ (cm2 V−1s−1) | 2.45×10⁻⁶ | 2.37×10⁻⁶ | 2.23×10⁻⁶ |
| Debye length λD (nm) | 0.82 | 0.81 | 0.79 |
| Double layer τDL (s) | 1.29×10⁻³ | 7.25×10⁻⁴ | 2.49×10⁻⁴ |
| Diffusion τdiff (s) | 15.60 | 4.86 | 0.15 |
The data for the 0.8 µm thick membranes display a very different behavior where the current becomes much larger than that in other films. It is likely that there is a significant conduction current (where the current cannot be blocked by the electrodes) in such a thin film, which superimposes on the regular diffusion and drifting currents. As illustrated in figure 1(a), due to the electric double layer, most voltage drop occurs within the Debye length near the electrodes, which is about 1 nm for the MIM systems studied here. Hence, the field level in the interface region can reach ~ 1 GV/m, which could induce strong charge injection from the electrodes. For thick membranes, the bulk resistance limits the current flow, resulting in low conduction current (the current flow is bulk limited). For thin membranes, this bulk resistance becomes small (the currents due to diffusion and drifting in the bulk region also become large) and consequently the current flow is interface limited, causing high conduction current as observed. The high conduction current in 0.8 µm thick membranes makes it difficult to perform quantitative data analysis and to deduce μ, τDL, λD, etc.
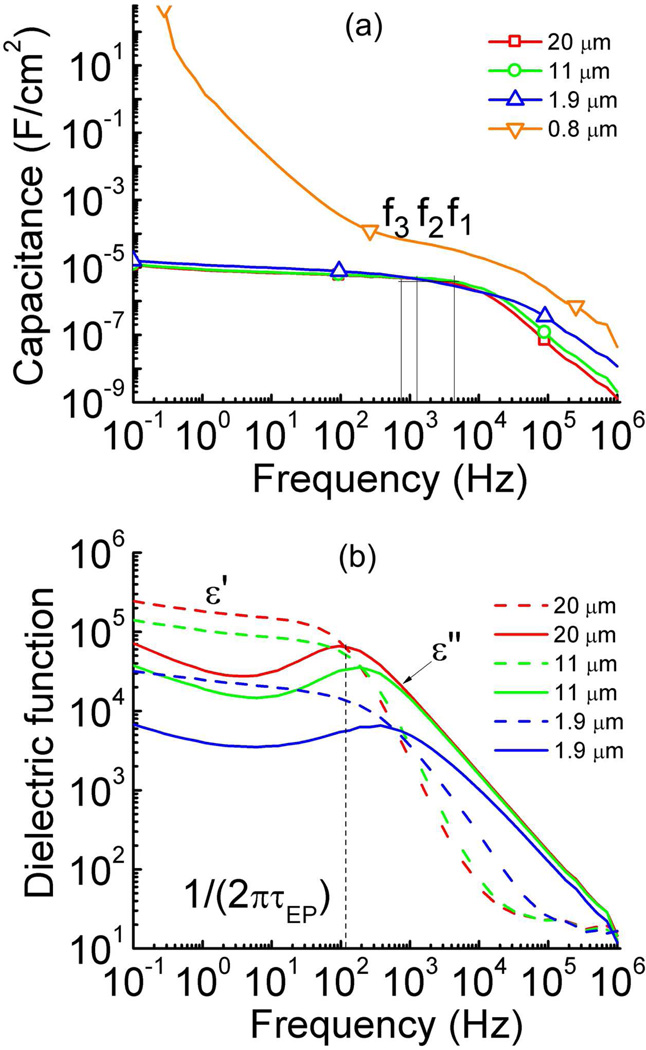
The impedance data (Z = C exp (jδ)), measured under 0.1 V, for the membranes with various thicknesses as a function of frequency are shown in figure 8. As can be seen, the capacitance C at the frequencies below that for the charging of the Debye layer (fi = 1/τDL) are nearly the same for membranes of 1.9 µm, 11 µm, and 20 µm, which is consistent with the transient current data in figure 7. At low frequencies (< fi), CD dominates the capacitance C while at higher frequencies (> fi), the contribution from Rbulk (see figure 1(b)) to C becomes dominating, causing observed change of C with film thickness d since Rbulk is directly proportional to d. For membranes of 0.8 µm thick, the high conduction current causes a very large apparent capacitance which increases with reduced frequency and is typical for the capacitance due to the space charge effect. Figure 8(b) presents the data in figure 8(a) in terms of the dielectric permittivity ε* = ε’ − jε”.
Figure 8.
(a) The capacitance and (b) dielectric permittivity (ε’ dash line and ε” solid line) as a function of frequency for the Aquivion film with 40 wt% uptake of [C2mim][TfO] under 0.1 V AC voltage. The capacitance C at the characteristic frequency fi = 1/τDL for films of 1.9 µm, 11 µm, and 20 µm thick is labeled at f1 (4.03 × 10³ Hz), f2 (1.37 × 10³ Hz) and f3 (7.75 × 10² Hz) respectively. The data reveals that the C at fi does not change with film thickness d for 1.9 µm, 11 µm, and 20 µm thick films. The observed abnormal high capacitance response of the 0.8 µm sample may be attributed to its high conduction current. The error bar is indicated by the size of the symbols in the figure.
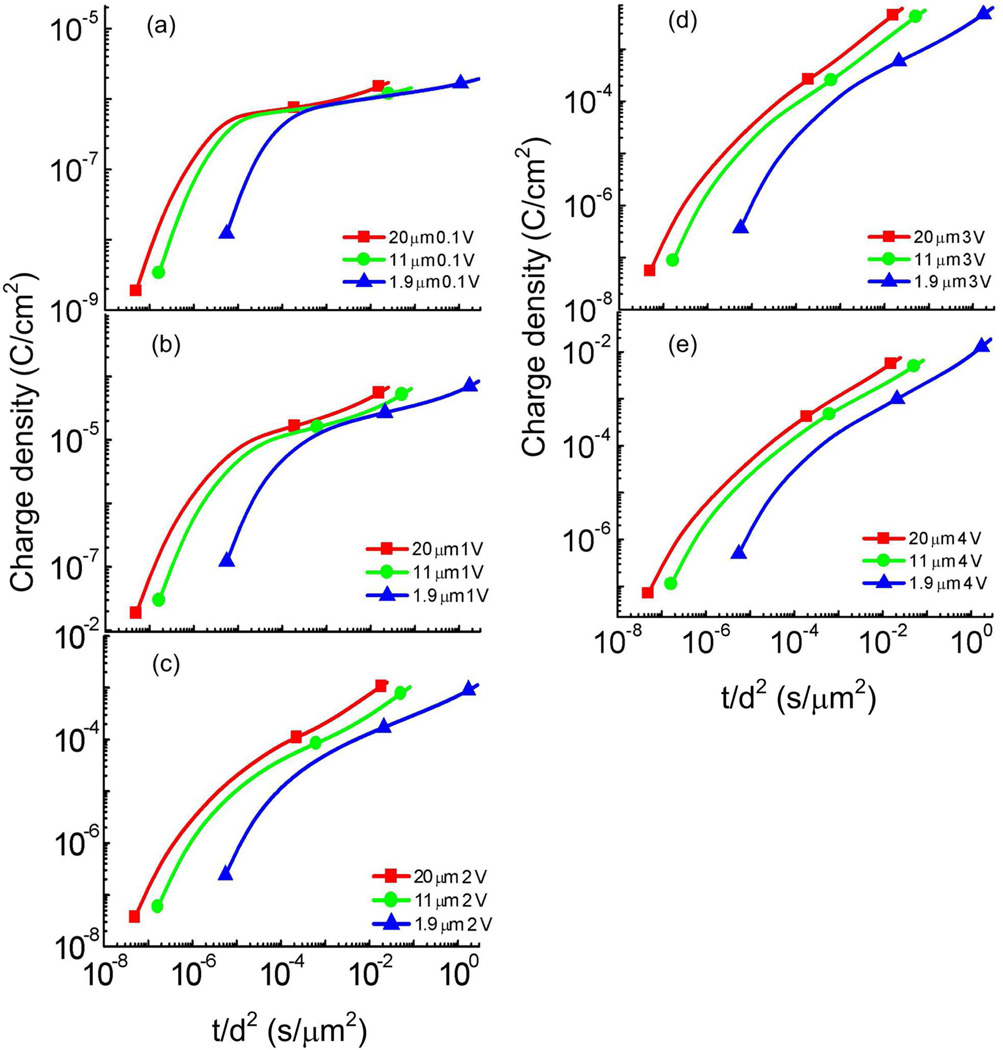
We now examine the current and charge responses at a longer time beyond τDL which is the time domain for most practical ionic electroactive devices to display large responses.14, 19, 20, 30, 31 As revealed in figure 7, in contrast to the strong thickness dependence observed for τDL, the later stage current responses do not seem to exhibit significant change with the membrane thickness when the membrane thickness d is reduced from 20 µm to 1.9 µm (except for the membranes of 0.8 µm thick). In Table II, τdiff = d2/(4D) is also listed which is 0.15 seconds for 1.9 µm thick film and increases to 15.6 seconds for 20 µm thick film. In order to display data more clearly and compare them with τdiff directly, the charge density of these films is plotted against t/d2 as presented in figure 9. The data show that under 0.1 V, the later stage charging process seems not to deviate significantly from the d2 dependence at the reduced time interval between 10−4 and 10−1 (t/d2), which is similar to that observed in the pure IL MIM system as presented in the preceding section. However, for higher voltages, the data deviate from the d2 dependence markedly. At applied voltage > 1 V, the data show that the charging time for films of 11 µm and 20 µm becomes much shorter than the d2 dependence, compared with films with a 1.9 µm thick membrane.
Figure 9.
The charge density as a function of t/d2 for the Aquivion film with 40 wt% uptake of [C2mim][TfO] under (a) 0.1 V, (b) 1 V, (c) 2 V, (d) 3 V, and (e) 4 V at the membrane thickness of d = 1.9 µm, 11 µm, and 20 µm. The error bar is indicated by the size of the symbols in the figure.
IV. CONCLUSION
We investigated the influence of the gap thickness d between the electrodes on the charge dynamics of a pure IL, [C4mim][PF6], when d is varied from 4 µm to 63 µm. The experimental results indicate that for all the thicknesses studied, the charge dynamics at the initial time follow the charging of interfacial capacitors CD in series with a bulk resistor. For the charge dynamics at times ≫ τDL, the charge dynamics display both applied voltage and thickness d dependence. That is, for the data obtained under 0.1 V, the later stage charging process that is dominated by ion diffusion process seems not to deviate markedly from the d2 dependence. For voltages > 0.5 V, this later stage charging response does not show d2 thickness dependence as the gap between the electrodes varies from 4 µm to 63 µm. Instead, the films with large d can be charged much faster than that predicted from τdiff = d2/(4D), compared with 4 µm thick films.
The influence of the ionic liquid containing film thickness on the ionic charge dynamics of the Aquivion/[C2mim][TfO] with Au electrodes was also investigated. The results of initial charge response (at a short time) are very similar to that observed in the pure IL films. For charging responses at times ≫ τDL which are the time domains where most electrical and electromechanical actions occur for ionic electroactive devices, experimental data reveal that charge dynamics depend on the applied voltage and film thicknesses, very similar to that observed in the pure IL films. These results also indicate that the IL containing ionomer membranes and pure IL films exhibit similar charge dynamics, when considering the influence of the voltage and film thickness dependence on ion transport and storage in these MIM systems.
The observed nonlinear charge dynamics with applied voltage is likely caused by the very high electric fields near the blocking electrode regions. The electric field generated by an ion in a medium with dielectric constant of 10 is ~ 100 MV/m when 1 nm away from the ion. In contrast, for an electric double layer of 1 nm thick, 1 volt applied will generate an electric field ~ 1 GV/m, which is much higher than the field generated from ions and will generate nonlinear effect (for example, capacitance changes with applied voltage) as observed in the paper.
Supplementary Material
ACKNOWLEDGEMENT
The material is based upon work supported in part by the U.S. Army Research Office under Grant No. W911NF-07-1-0452 IonicLiquids in Electro-Active Devices (ILEAD) MURI, NIH under Grant No. R01-EY018387-02 and NSF under Grant No. CMMI 0709333. The authors thank Ralph Colby and Shih-Wa Wang for many stimulating discussions regarding the research works reported here.
Footnotes
Supporting Information Available: Time domain measurement set-up, charge and capacitance responses under step voltage, and differential capacitance as a function of time. This information is available free of charge via the Internet at http://pubs.acs.org
REFERENCES
- 1.Lu W, Fadeev AG, Qi BH, Smela E, Mattes BR, Ding J, Spinks GM, Mazurkiewicz J, Zhou DZ, Wallace GG, MacFarlane DR, Forsyth SA, Forsyth M. Science. 2002;297(5583):983–987. doi: 10.1126/science.1072651. [DOI] [PubMed] [Google Scholar]
- 2.McEwen AB, Ngo HL, LeCompte K, Goldman JL. Journal of the Electrochemical Society. 1999;146(5):1687–1695. [Google Scholar]
- 3.Ue M, Takeda M, Toriumi A, Kominato A, Hagiwara R, Ito Y. Journal of the Electrochemical Society. 2003;150(4):A499–A502. [Google Scholar]
- 4.Duncan AJ, Leo DJ, Long TE. Macromolecules. 2008;41(21):7765–7775. [Google Scholar]
- 5.Chen L, Hallinan DT, Elabd YA, Hillmyer MA. Macromolecules. 2009;42(16):6075–6085. [Google Scholar]
- 6.Beunis F, Strubbe F, Marescaux M, Beeckman J, Neyts K, Verschueren ARM. Physical Review E. 2008;78(1):011502-1–011502-15. doi: 10.1103/PhysRevE.78.011502. [DOI] [PubMed] [Google Scholar]
- 7.Beunis F, Strubbe F, Marescaux M, Neyts K, Verschueren ARM. Applied Physics Letters. 2007;91(18):182911-1–182911-3. [Google Scholar]
- 8.Marescaux M, Beunis F, Strubbe F, Verboven B, Neyts K. Physical Review E. 2009;79(1):011502-1–011502-4. doi: 10.1103/PhysRevE.79.011502. [DOI] [PubMed] [Google Scholar]
- 9.Bazant MZ, Thornton K, Ajdari A. Physical Review E. 2004;70(2) doi: 10.1103/PhysRevE.70.021506. [DOI] [PubMed] [Google Scholar]
- 10.Hou JB, Zhang ZY, Madsen LA. Journal of Physical Chemistry B. 2011;115(16):4576–4582. doi: 10.1021/jp1110899. [DOI] [PubMed] [Google Scholar]
- 11.Klein RJ, Zhang SH, Dou S, Jones BH, Colby RH, Runt J. Journal of Chemical Physics. 2006;124(14) doi: 10.1063/1.2186638. [DOI] [PubMed] [Google Scholar]
- 12.Macdonald JR. Physical Review. 1953;92(1):4–17. [Google Scholar]
- 13.Coelho R. Revue De Physique Appliquee. 1983;18(3):137–146. [Google Scholar]
- 14.Lin JH, Liu Y, Zhang QM. Polymer. 2011;52(2):540–546. doi: 10.1016/j.polymer.2010.11.030. [DOI] [PMC free article] [PubMed] [Google Scholar]
- 15.Kilic MS, Bazant MZ, Ajdari A. Physical Review E. 2007;75(2):021502–021514. doi: 10.1103/PhysRevE.75.021502. [DOI] [PubMed] [Google Scholar]
- 16.Fukumoto K, Yoshizawa M, Ohno H. Journal of the American Chemical Society. 2005;127(8):2398–2399. doi: 10.1021/ja043451i. [DOI] [PubMed] [Google Scholar]
- 17.Huddleston JG, Visser AE, Reichert WM, Willauer HD, Broker GA, Rogers RD. Green Chemistry. 2001;3(4):156–164. [Google Scholar]
- 18.Tokuda H, Hayamizu K, Ishii K, Abu Bin Hasan Susan M, Watanabe M. Journal of Physical Chemistry B. 2004;108(42):16593–16600. [Google Scholar]
- 19.Liu Y, Liu S, Lin JH, Wang D, Jain V, Montazami R, Heflin JR, Li J, Madsen L, Zhang QM. Applied Physics Letters. 2010;96(22):223503-1–223503-3. [Google Scholar]
- 20.Liu S, Liu WJ, Liu Y, Lin JH, Zhou X, Janik MJ, Colby RH, Zhang QM. Polymer International. 2010;59(3):321–328. [Google Scholar]
- 21.Bennett MD, Leo DJ. Sensors and Actuators a-Physical. 2004;115(1):79–90. [Google Scholar]
- 22.Kornyshev AA. Journal of Physical Chemistry B. 2007;111(20):5545–5557. doi: 10.1021/jp067857o. [DOI] [PubMed] [Google Scholar]
- 23.Liu Y, Liu S, Lin JH, Wang D, Jain V, Montazami R, Heflin JR, Li J, Madsen L, Zhang QM. Applied Physics Letters. 2010;96(22) [Google Scholar]
- 24.Balducci A, Bardi U, Caporali S, Mastragostino M, Soavi F. Electrochemistry Communications. 2004;6(6):566–570. [Google Scholar]
- 25.Garcia B, Lavallee S, Perron G, Michot C, Armand M. Electrochimica Acta. 2004;49(26):4583–4588. [Google Scholar]
- 26.Bennett MD, Leo DJ, Wilkes GL, Beyer FL, Pechar TW. Polymer. 2006;47(19):6782–6796. [Google Scholar]
- 27.Hsu WY, Gierke TD. Journal of Membrane Science. 1983;13(3):307–326. [Google Scholar]
- 28.Ghielmi A, Vaccarono P, Troglia C, Arcella V. Journal of Power Sources. 2005;145(2):108–115. [Google Scholar]
- 29.Kreuer KD, Schuster M, Obliers B, Diat O, Traub U, Fuchs A, Klock U, Paddison SJ, Maier J. Journal of Power Sources. 2008;178(2):499–509. [Google Scholar]
- 30.Liu S, Liu Y, Cebeci H, de Villoria RG, Lin JH, Wardle BL, Zhang QM. Advanced Functional Materials. 2010;20(19):3266–3271. doi: 10.1002/adfm.201000570. [DOI] [PMC free article] [PubMed] [Google Scholar]
- 31.Liu S, Montazami R, Liu Y, Jain V, Lin MR, Heflin JR, Zhang QM. Applied Physics Letters. 2009;95(2):023505-1–023505-3. [Google Scholar]
- 32.Weber RL, Ye YS, Schmitt AL, Banik SM, Elabd YA, Mahanthappa MK. Macromolecules. 2011;44(14):5727–5735. [Google Scholar]
- 33.Hallinan DT, De Angelis MG, Baschetti MG, Sarti GC, Elabd YA. Macromolecules. 2010;43(10):4667–4678. [Google Scholar]
- 34.Serghei A, Tress M, Sangoro JR, Kremer F. Physical Review B. 2009;80(18):184301-1–184301-5. [Google Scholar]
- 35.Krause C, Sangoro JR, Iacob C, Kremer F. Journal of Physical Chemistry B. 2010;114(1):382–386. doi: 10.1021/jp908519u. [DOI] [PubMed] [Google Scholar]
- 36.Wakai C, Oleinikova A, Ott M, Weingartner H. Journal of Physical Chemistry B. 2005;109(36):17028–17030. doi: 10.1021/jp053946+. [DOI] [PubMed] [Google Scholar]
- 37.Lockett V, Sedev R, Ralston J, Horne M, Rodopoulos T. Journal of Physical Chemistry C. 2008;112(19):7486–7495. [Google Scholar]
- 38.Strubbe F, Verschueren ARM, Schlangen LJM, Beunis F, Neyts K. Journal of Colloid and Interface Science. 2006;300(1):396–403. doi: 10.1016/j.jcis.2006.03.050. [DOI] [PubMed] [Google Scholar]
Associated Data
This section collects any data citations, data availability statements, or supplementary materials included in this article.


