Abstract
High speed atomic force microscopy can provide the possibility of many new scientific observations and applications ranging from nano-manufacturing to the study of biological processes. However, the limited imaging speed has been an imperative drawback of the atomic force microscopes. One of the main reasons behind this limitation is the excitation of the AFM dynamics at high scan speeds, severely undermining the reliability of the acquired images. In this research, we propose a piezo based, feedforward controlled, counter actuation mechanism to compensate for the excited out-of-plane scanner dynamics. For this purpose, the AFM controller output is properly filtered via a linear compensator and then applied to a counter actuating piezo. An effective algorithm for estimating the compensator parameters is developed. The information required for compensator design is extracted from the cantilever deflection signal, hence eliminating the need for any additional sensors. The proposed approach is implemented and experimentally evaluated on the dynamic response of a custom made AFM. It is further assessed by comparing the imaging performance of the AFM with and without the application of the proposed technique and in comparison with the conventional counterbalancing methodology. The experimental results substantiate the effectiveness of the method in significantly improving the imaging performance of AFM at high scan speeds.
INTRODUCTION
The ability to image nano-scale features at high imaging rates using AFMs will open many new opportunities by providing the possibility of novel scientific observations. Nano-manufacturing and semiconductor industry would also greatly benefit from such a technology, as it provides the means for online quality control and process refinement. However, these applications have been limited due to the significantly slow speed of the current atomic force microscopes. The typical imaging rate of the current commercial AFMs is in the order of minutes, limiting their application to static or quasi-static observations. The operation of AFM is based on the movement of a probe with respect to sample where an image of the sample surface is obtained on serial-point-collection bases.1 As such, higher imaging speed necessitates faster movement of the probe/sample. Higher scan speed leads to the excitation of unwanted lateral dynamics of the microscope. In addition, faster movement of the probe with respect to sample requires faster out of plane motion of the sample/probe in order to achieve a constant interaction force between the two, leading to the excitation of the out of plane dynamics of the microscope. The vibrations associated with such dynamics appear as shadows and ripples in the acquired images, severely undermining their reliability. Furthermore, the out of plane dynamics adversely affect the AFM control performance, possibly leading to the instability of AFM scanner movement. To avoid such phenomenon, AFM users are forced to settle with lower controller gains (in the case of commonly used PI controllers) and hence compromise the intended constant interaction force between the probe and the sample.
During the past decade a considerable amount of research effort has focused on the improvement of the AFM imaging speed.2, 3, 4, 5, 6 An important thrust towards the design of faster AFMs has been to capture dynamic processes of biological macromolecules,2, 3, 4 mineral dissolution and growth5 and polymer crystallization6 in real time. These efforts have mainly focused on scanner bandwidth enhancement for faster in-plane (referred to as x and y directions),7, 8, 9, 10, 11 and out of plane (referred to as z direction) movement2, 12 of the sample/probe. Probe enhancement for improved sensitivity and speed has also been under investigation.3, 4, 13, 14, 15 The advancements of the scanner speed in x, y, and z directions have been brought about through improvements in both the scanner mechanical design and the scanner control.
The research on the controls approach to improved imaging speed has led to the development of various techniques.16 To improve the z control Schitter et al.12 proposed H∞ feedforward and feedback control schemes. In another effort,2 Kodera et al. applied active damping to lower the Q factor of the first z piezo resonance. As reported, through this technique the bandwidth of the z scanner could be extended to the first resonance of the z piezo-actuator. Although, the controls approach to high speed atomic force microscopy has shown to be effective, it also suffers from some limitations. In atomic force microscopy, the topography data are derived from the control signal which imposes constraints on the design of the z control scheme. For high order z-controllers where the dynamics of the AFM structure and the actuator in the z direction are compensated, the topography can no longer be directly derived from the control signal.17, 18 In addition, control techniques are unable to extend the bandwidth of AFM scanners beyond their natural mechanical bandwidth. As such, modifying the mechanical design of the scanner is another important approach which should be undertaken in parallel with control methodologies.
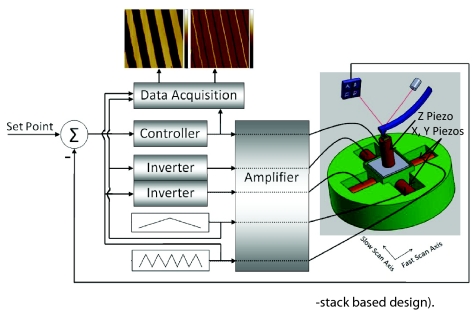
A major boost in the scanning bandwidth has been realized through improving the mechanical design of the AFMs. This is achieved by replacing the conventional piezo tubes having relatively low-frequency resonances with piezo stacks3, 8, 14, 19 (Figs. 18). In these designs, independent piezo stack actuators move the sample in the x, y, and z directions. In one approach, independent actuators are stacked on top of each other. In this design, the actuations in different directions are completely decoupled, however, the fast scan axis is predefined.3, 20 In another class, referred to as rigid scanners,19, 21 the three sets of piezo stack actuators for three scan directions (x, y, and z) are implemented on a flexure based nano-positioner.14, 19, 21 In this design, the actuators are to a large extent decoupled while operating in a parallel fashion. Hence, the fast scan axis can be chosen freely. Schematic of the piezo stack based rigid scanner design is illustrated in Fig. 1. In this research we build upon the improvements obtained through the piezo stack based rigid scanner designs and propose a technique to further improve the imaging bandwidth. The proposed technique is based on a feed-forward controlled counter actuation (CA) mechanism.
Figure 1.
Schematics of AFM operation (rigid, piezo-stack based design).
Figure 8.
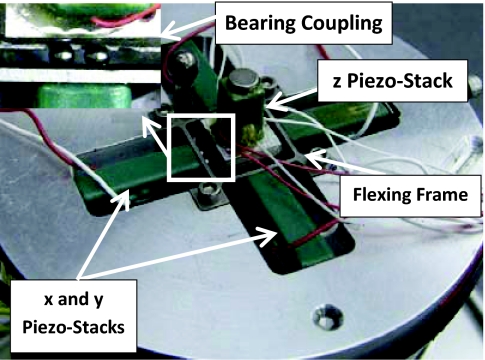
AFM Scanner used in the experiments.
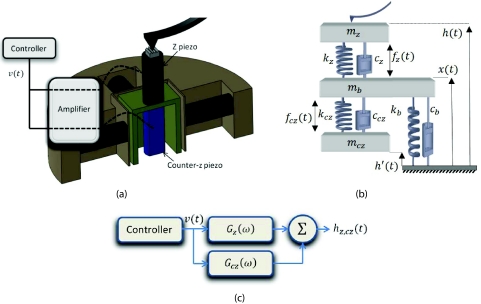
As observed by Ando et al.3 in these scanner designs, the structural resonance in the z direction occurs at a lower frequency compared to the resonance of the z piezo stack itself. Consequently, further improvements in the imaging bandwidth could be obtained by properly compensating for such resonances. A simple approach to suppress the structural vibrations is to use a counterbalancing piezo-actuator.2, 3, 21 As shown in Fig. 2a, in this approach, an additional piezo actuator is installed on the opposite side of the z-piezo platform, actuated by the same control signal driving the z-piezo. The role of the additional piezo actuator (hereafter referred to as counter-z or cz piezo) is to counteract the momentum transferred to the base (where the z piezo is mounted, see Fig. 2a) by the z piezo and hence keep the structure stationary.
Figure 2.
(a) A section view of the scanner demonstrating the conventional counterbalancing methodology, (b) a 3 DOF model of the z piezo, counter-z piezo and the base, and (c) block diagram corresponding to part (a).
Although, the counterbalancing technique has proven to be effective, it suffers from some limitations. The main objective of the counterbalancing is to suppress the structural vibrations, i.e., corresponding to the base where the z-piezo sits. However, a more robust approach would be to aim for the compensation of dynamics observed on top of the z-piezo where the sample rests. The counterbalancing technique is not only unable to compensate for the dynamics associated with the z-piezo but also intensifies the corresponding vibrations, potentially leading to the deterioration of imaging performance. Furthermore, the differences between the dynamic properties of z and counter-z piezos, e.g., damping, spring constant, carried masses, etc. would limit the effective cancellation of structural vibrations. This is especially important in practice, as for example, it is not easily possible to alter the mass carried by the cz piezo in accord with the variations of the sample and the sample stage.
This research aims to devise a technique to compensate for these limitations. In the proposed methodology, the signal driving the cz piezo is not the same as the one driving the z piezo. The cz actuation signal is obtained by properly filtering the AFM controller output via a linear filter, hereafter referred to as CA compensator. The CA compensator parameters are estimated through an optimization step.
The paper hereafter is organized as follows. The counterbalancing method is investigated and the corresponding limitations are elaborated in Sec. 2. The proposed feed-forward controlled counter actuation technique is introduced in Sec. 3. This section also presents the CA compensator parameter estimation methodology and the corresponding algorithmic steps. The proposed method is experimentally evaluated in Sec. 4. Concluding remarks are given in Sec. 5.
CONVENTIONAL COUNTERBALANCING: PRINCIPLE OF OPERATION AND LIMITATIONS
Figure 1 schematically presents the basic components of our rigid, piezo stack-based AFM. The x and y piezos move the sample in the lateral (in plane) direction while the z piezo moves the sample in the vertical (out of plane) direction. A complete description on the AFM operation and the corresponding modes can be found in Ref. 22. Figure 2a presents a section view of the rigid scanner where the counter z piezo can also be observed. As explained earlier and as shown in this figure, in the conventional counterbalancing technique both the z and counter z (cz) piezos are driven by the AFM controller output.
Figure 2b demonstrates a 3 DOF model of the counterbalancing mechanism where, (mb, mz, and mcz), (kb, kz, and kcz), and (cb, cz, and ccz), represent the equivalent point masses, spring and damping constants of the base, z piezo and the counter-z piezo (cz piezo), respectively. A block diagram representation of Fig. 2a is shown in Fig. 2c, where Gz(ω) and Gcz(ω) represent the transfer functions from the excitation voltage to the response on top of the z piezo corresponding to the actuation of z and cz piezos, respectively. To give a heuristic explanation on the operation and the limitations of the counter balancing technique we evaluate three transfer functions, (a) Qz(s) from fz(t) to h(t) = hz(t), (b) Qcz(s) from fcz(t) to h(t) = hcz(t), and (c) Qz, cz(s) corresponding to the simultaneous actuation of z and cz piezos, i.e., from fz(t) = fcz(t) = f(t) to h(t) = hz, cz(t). The subscripts denote the excited piezo (e.g., z, cz, or both) and the response is always considered on top of the z piezo where the sample rests unless otherwise noted. We have
| (1a) |
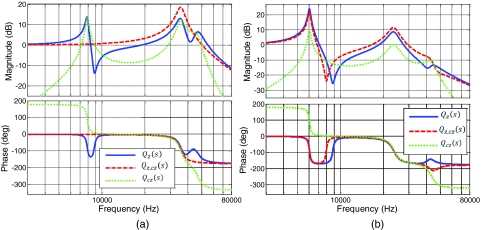
Figure 3a shows the Bode plot of this transfer function (blue, solid line) for tentative values of dynamic pro- perties, mb = 6 g, mcz = mz = 2g, kb = 2.5 × 10⁷ N/m, kz = kcz = 1 × 10⁸ N/m, ζb = 0.03, ζz = ζcz = 0.06, where ζ denotes the damping ratio. This transfer function features three pairs of complex poles, at 8 kHz, 35 kHz, and 46 kHz, and two pairs of complex zeros at 9 kHz and 41 kHz. The characteristics of the poles and zeros, respectively, at 8 kHz and 9 kHz are mainly ruled by the total mass (mb + mz + mcz) and the base structural properties. The pair of complex poles at 35 kHz is associated with the dynamics of the z piezo and the pairs of zeros and poles, respectively, at 41 kHz and 46 kHz are associated with the addition of the counter-z piezo to the opposite side of the base.
Figure 3.
Bode plot of the transfer functions Qz(s) (solid blue line), Qz, cz(s) (red dashed line) and Qcz(s) (green dotted line), corresponding to two cases where (a) the dynamic properties of the z and cz piezos perfectly match, and (b) the dynamic properties of the z piezo are deviated from those of the cz piezo.
For the case where the counter-z piezo is actuated by the same signal as that driving the z-piezo, the transfer function, Qz, cz(s), from the actuation force fz(t) = fcz(t) = f(t), to the response of the z piezo h(t) = hz, cz(t), can be written as (for details of Eqs. 1a, 1b see Appendix A.):
| (1b) |
As noted above, both the transfer functions Qz(s) and Qz, cz(s) have a common denominator, D(s). In other words, actuation of the counter-z piezo does not affect the location of the poles. Furthermore, the numerator of both Qz(s) and Qz, cz(s)are independent of the mass carried by the z piezo, i.e., zero locations are not affected by the mass of the z-piezo. The operation of the conventional counterbalancing technique can be explained based on the above-mentioned properties and the Bode plots of Fig. 3. For the case where the dynamic properties of the z and the cz piezos are similar (balanced case), the simultaneous actuation of the cz piezo moves the two pairs of zeros to match the pairs of poles at 8 kHz and 46 kHz, cancelling both pairs. Now consider a case where the equivalent point mass of the z piezo is deviated from that of cz piezo (unbalanced case). According to the above, although changing the z piezo mass shifts the poles of Qz, cz(s) away from their original locations, the zeros of Qz, cz(s) remain intact. As such, the pole-zero cancellation does not take place and hence counterbalancing loses effectiveness. Though interpreting the effect of deviating the spring constant and the damping characteristics of the z piezo from those of the cz piezo is not as straightforward, a similar argument applies. To demonstrate the effect of mass unbalance, the mass of the z piezo is deviated from that of the cz piezo, = 4g. Considering the small weight of the piezo stack actuators used in high speed rigid scanners, the sample and sample stage masses are comparable to the z piezo mass. Hence, the given deviation is realistic. The Bode plots associated with balanced and unbalanced cases corresponding to Qz(s) and Qz, cz(s) (solid blue and dashed red lines, respectively) are shown in Figs. 3a, 3b, respectively.
Another limitation of the counterbalancing approach is the intensification of the vibrations associated with the z piezo dynamics. This is true even when the dynamic propertied of the z and cz piezos are similar. This phenomenon can be observed from the Bode plot of Qz, cz(s) in both Figs. 3a, 3b (red dashed line) where the magnitude of the peak associated with the poles at 35 kHz (corresponding to the z-piezo dynamics) is increased. The Bode plots of Qcz(s) corresponding to the balanced and unbalanced cases are also shown in Figs. 3a, 3b (green dotted line). As evident from these Bode plots, on a frequency range bounded by the zeros of Qz(s), Qcz(s) is in phase with Qz(s). As such, on this frequency range the dynamics induced by the actuation of z and cz piezos are superposed leading to the intensification of the corresponding vibrations. This phenomenon may lead to inferior AFM performance, especially when the dynamic properties of the z and the counter-z piezos do not match. In this case, the counterbalancing technique is not only unable to properly suppress the base structural vibrations but also intensifies the dynamics associated with the z piezo.
THE NOTION OF COUNTER ACTUATION COMPENSATOR
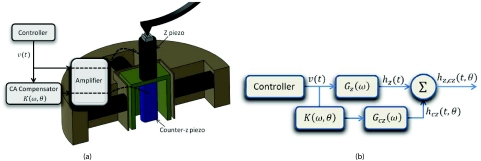
In the following, we propose a method to compensate for the limitations of the conventional counterbalancing explained in Sec. 2. The method consists of generating a more effective control signal for the counter piezo actuator. This is shown in Fig. 4a. The output signal from the controller is processed through a compensator that generates the proper input for the cz piezo. This filtering step aims to compensate for the adverse effect of the unbalance between the mechanical properties of the z and cz piezos in suppressing the base structural vibrations. Furthermore, the proposed compensator effectuates the suppression of the dynamics associated with the z piezo actuator. Figure 4b demonstrates a block diagram representation of this technique.
Figure 4.
(a) Schematics of the proposed counter actuation based on CA compensator, and (b) the corresponding block diagram.
CA compensator structure and design strategy
Consider a filter structure k(q, θ) = B(q, θb)/A(q, θa), a discrete representation of k(ω, θ), with θ a p-parameter vector, θ = {θa, θb}, θa = {a1, a2, …, an}, θb = {b1, b2, …, bm}, and p = m + n, where A(q) = 1 + a1q−1 + ⋅⋅⋅ + anq−n and B(q) = b1 + b2q−1 + ⋅⋅⋅ + bmq−m. q is a forward shift operator such that for a discrete time signal x(n + 1) = qx(n) and similarly x(n + 1) = qx(n). Also denote the discrete equivalents of Gz, cz(ω), Gz(ω), and Gcz(ω) byGz, cz(q), Gz(q), and Gcz(q), respectively.
The discrete frequency response of the system shown in Fig. 4b is
where Hz, cz(ejω, θ) and V(ejω) denote the frequency domain representations of discrete data hz, cz(n, θ) and ν(n), respectively. ν(n) is a discrete actuation voltage band-limited to [0, ω0] and hz, cz(n, θ) is the z piezo response measured via the cantilever deflection when both z and cz piezos are active. Obviously, this transfer function is dependent on the parameter vector θ. To emphasize this, we have included θ as an argument in Gz, cz(q, θ). We can write
| (2) |
Also consider the ideal response of the scanner when the z piezo is actuated with the voltage, v(n), (when the cz piezo is inactive) as β* v(n), and the associated transfer function as
where β* is an unknown scaling parameter. Furthermore, let us define a transfer function, , hereafter referred to as ideal deviation transfer function, representing the deviation of the z piezo transfer function Gz(q) from a uniform frequency response over [0, ω0] as
| (3) |
or equivalently
| (4) |
Substituting Eq. 4 into Eq. 2 gives
| (5) |
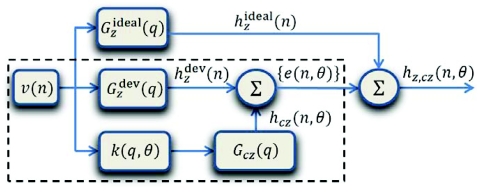
A block diagram representation of this equation is given in Fig. 5. As evident from this figure, for a compensator parameter vector, θ = θ*, selected in such a way that hcz(n, θ*) can suppress , then hz, cz(n, θ*) would represent the ideal response, . By extracting the portion of Fig. 5 enclosed by dashed line and rearranging the transfer functions k and Gcz, the process of compensator parameter estimation can be schematically stated as shown in Fig. 6.
Figure 5.
Block diagram representation of Eq. 5.
Figure 6.
CA compensator parameter estimation by minimizing {e(n, θ)} representing the deviation of the z piezo response from ideal when both z and cz piezos are actuated.
In other words, given two datasets {hcz(n); n = 1, …, N} and and with
| (6) |
| (7) |
we have
| (8) |
where denotes the estimated CA compensator parameter vector, hcz(n) is the z piezo response to counter-z piezo actuation, and is the deviation of the z piezo response from the ideal response (ideal deviation response) in the absence of cz actuation. hcz(n) can be measured directly by exciting the cz piezo and measuring the cantilever deflection response. However, should be extracted from hz(n). The process of extracting the ideal deviation response is given in Appendix B. The order of the compensator can be selected by comparing the minimum obtainable cost function as given by Eq. 7 for various orders while taking into account the imposed hardware limitations.
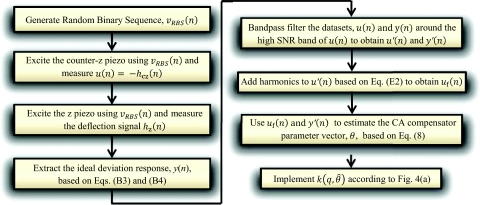
Denoting and u(n) = −hcz(n), the objective is to estimate y(n) in the least square error sense (LS) by properly filtering u(n). Hence, the CA compensator parameter estimation methodology given by Eqs. 6, 7, 8, can be interpreted as an output-error system identification problem.23 As such, hereafter we refer to the datasets u(n) and y(n) as virtual input and virtual output, respectively. The flowchart of the proposed compensator design technique is given in Fig. 7.
Figure 7.
Flowchart of the proposed compensator design technique.
Pre-processing the virtual input, u(n), and virtual output, y(n)
The CA compensator design based on the raw datasets u(n) and y(n) is not an appropriate strategy and proper pre-processing steps are required to assure acceptable performance. A frequency domain interpretation of the LS based compensator design (Eq. 8) can help us to design necessary pre-processing steps. Let us assume that there exists an objective transfer function k(q, θ*), such that
| (9) |
leading to zero cost function, i.e., V(θ) = 0. We can show that23 (Appendix C):
| (10) |
According to Eq. 10, minimizing (Eq. 8) the sum square error given by Eq. 7 is approximately equivalent to the minimization of the weighted sum of the squared error between the estimated transfer function and the objective transfer function k(2πn/N, θ*). The weight given to each frequency is determined by the energy of u(n), i.e., |U(2πn/N)|2 at that specific frequency. The above result has a very important implication on the performance of the CA compensator.
Firstly, the Y(2πn/N)/U(2πn/N) ratio would be of unlimited bandwidth as the compensator aims to achieve ideal response in the output. According to Eq. 10, this will result in infinite bandwidth of the resulting compensator leading to increased image noise. Furthermore, the weighting function, |U(2πn/N)|2, needs to be modified to further suppress the low SNR (signal to noise ratio) frequency bands of the acquired data. Assuming that both the datasets, u(n) and y(n), are corrupted by additive white noise, the Y(2πn/N)/U(2πn/N) ratio has a higher SNR over the frequency range where the virtual input has a higher energy. The factors that determine the spectral energy distribution of u(n) are twofold, (a) the frequency content of the excitation voltage, ν(n), and (b) the frequency range on which the transfer function, Gcz(q), has dominant response. As shown in Appendix D, Gcz(q) has bandpass characteristics. The passband of this transfer function is [ωb, ωz], where and are the natural frequencies associated with the z piezo and the base structure, respectively. This result matches the simulation results of Fig. 3 (green dotted line). As such, assuming a wideband actuation signal ν(n), the high energy frequency range of the virtual input, u(n), falls in [ωb, ωz].
The weighting function modification can be implemented via a bandpass filtering step. Bandpass filtering the u(n) and y(n) by an identical filter F(2πn/N), will not affect the ratio Y(2πn/N)/U(2πn/N).23 As such, it can be observed that via filtering, the frequency weighting function is modified to |U′(2πn/N)|2 = |U(2πn/N)F(2πn/N)|2. The lower and upper cutoff frequencies of the bandpass filter can be roughly selected based on the prior knowledge about the resonance frequencies of the base structure and the z piezo, i.e., ([ωb, ωz]) or by directly inspecting the spectral content of u(n). As such, through bandpass filtering, the weighting function can be decreased to a small value out of the band [ωb, ωz] forcing the compensator to match only the in-band behavior of the objective transfer function. However, one should note that following the bandpass filtering step the out-of-band behavior of the compensator is still unknown. This may lead to unacceptable practical results. For example a high gain at low frequency range may lead to the saturation of the digital filter. This can be avoided by penalizing the out of band compensator gain as given below:
where λn is the penalizing gain for frequency 2πn/N. The penalizing term forces roll off of the compensator towards higher, ω > ωz, and lower, ω < ωb, frequencies. A time domain interpretation of the penalizing term and a schematic of the proposed compensator design technique are given in Appendix E.
EXPERIMENTAL EVALUATION
In this section, we evaluate the effectiveness of the proposed method via experiments. This evaluation is in terms of dynamic performance behavior of the scanner and imaging capability.
Experimental setup
The AFM used in this research is described in Ref. 21 and is shown in Fig. 8. The sample movement in the x, y, and z directions is provided by piezo stack actuators. As shown in the figure, the scanner motion in each one of the x and y directions is achieved by two piezos in a pull-push configuration. This is primarily because the piezo stacks are able to provide force when expanding. In this scanner design, ball bearings are used to decouple the motion between the x and y piezos. Furthermore, the scanner center stage, which hosts the z and counter-z piezos, is enclosed by a flexing frame in order to limit the out of plane vibrations. The counter z piezo is directly underneath the z piezo platform. In these experiments, a micro-cantilever, model TM300-A from SensaProbes, with 300 kHz resonance frequency is brought in contact with a mica sample. The cantilever deflection is the only measured signal through an optical system, hence eliminating the need for any additional sensors. This characteristic of the proposed technique makes it quite versatile and implementable on the AFM scanners without any modifications. To observe the effectiveness of the proposed scheme, in the following experiments the dynamic unbalance between the z and the counter piezos is increased by resting a mass of 1 g on the sample holder.
CA compensator design
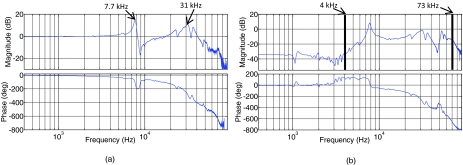
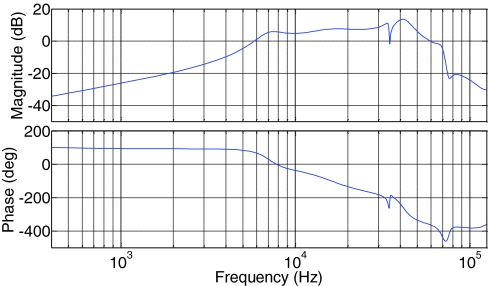
The z and counter-z piezos are excited independently with a wideband random binary sequence excitation voltage. The resulting deflection signal is acquired at 250 kHz sampling rate to measure hz(n) and u(n) = −hcz(n), respectively. The empirical transfer function estimate (ETFE) of the measured data, hz(n) and u(n), are presented in Figs. 9a, 9b, respectively. The scaling parameter β* is then estimated and the ideal deviation response y(n) is extracted from the deflection signal hz(n)using Eqs. B3, B4 (Appendix B). From Fig. 9b the high SNR frequency band of u(n) is detected to be around 4–73 kHz (enclosed by vertical lines). As such, both y(n) and u(n) are bandpass filtered using an FIR filter designed based on Parks-McClellan filter design algorithm,24 with a passband of 4 kHz–73 kHz to obtain y′(n), u′(n). Harmonics are then added to u′(n) to obtain uf(n) as suggested by Eq. E2 (Appendix E) to force the out of band roll-off of the compensator. The datasets y′(n) and uf(n) are then used to estimate a 10th order linear compensator via Eq. 8. The designed compensator is then implemented on a NI PXI-7851R FPGA in transposed, direct-form II, second order sections format.25 The Bode plot of the designed CA compensator is illustrated in Fig. 10.
Figure 9.
Smoothed empirical transfer function estimates with the excitation voltage to (a) z piezo, and (b) cz piezo, as input and the measured deflection signal as output.
Figure 10.
Bode plot of the designed CA compensator.
Dynamic performance
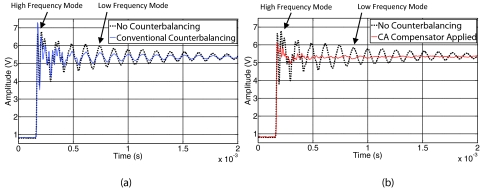
In this subsection, the dynamic performance of the scanner, in the presence of the compensator, is evaluated. To assess the performance of the compensator, the z piezo is excited by step inputs and the deflection signal is measured for two separate cases as shown in Figs. 11a, 11b. Figure 11a shows the difference in performance between the conventional counterbalancing method in blue (solid line) and no-balancing in black (dotted line). The figure shows that there are two dominant modes of vibration as predicted by the ETFE of Fig. 9a. One mode is at 31 kHz, due to the z piezo dynamics, and the other at 7.7 kHz which is related to the base structure dynamics. The response with no balancing, in black (dotted line), shows the worst performance. As shown in Fig. 11a (blue, solid line), with the application of counterbalancing although there is a slight reduction on the level of vibrations associated with the lower frequency mode (base structural dynamics), the higher frequency mode (z piezo dynamics) of oscillations are intensified. On the other hand, Fig. 11b shows in red (solid line), the response corresponding to the case where the CA compensator is applied. A significant decrease in the level of vibrations is observed. This improvement in performance is attributed to the cancellation of the vibrations associated with the base (7.7 kHz) as well as significant reduction in the z piezo dynamics (31 kHz).
Figure 11.
Deflection signal in response to an step signal actuating the z piezo, (a) black, dotted line: no counter-balancing is used; blue, solid line: the cz piezo is driven by the same signal as that driving the z piezo, and (b) black, dotted line: no counter-balancing is used; red, solid line: the CA compensator is applied.
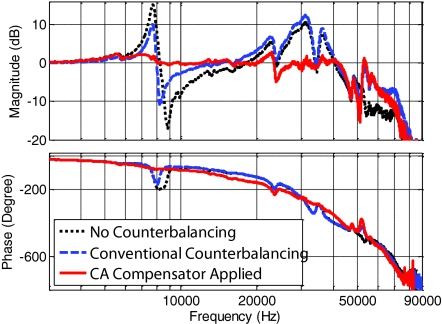
Figure 12 presents the empirical transfer function estimates associated with the cases described in Fig. 11. One can observe that the conventional counter balancing approach, in blue (dashed line), reduces slightly the peaks associated with the low frequency resonance and anti-resonance. However, the higher frequency modes are intensified. These behaviors of the conventional counter balancing approach were predicted analytically in Sec. 2. The same figure shows a significant improvement in performance due to the CA compensator, in red (solid line). This is characterized by a much higher bandwidth and proper compensation for the induced vibrations due to z piezo and the scanner base.
Figure 12.
Empirical transfer function estimates associated with the three cases represented in Fig. 11, black dotted line: the cz piezo is not active, blue dashed line: the cz piezo is driven by the same signal as that driving the z piezo (conventional counterbalancing), red solid line: the CA compensator is applied.
Imaging performance
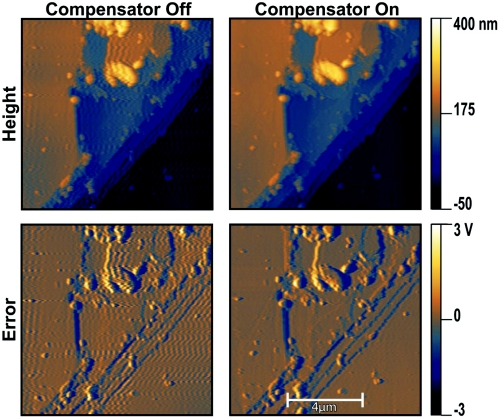
In this section, the performance of the proposed method is evaluated by using the AFM to image several samples of freshly cleaved and sanded mica. Figure 13 show a typical result of the topography and the deflection images taken at 60 lines/sec when the conventional counterbalancing (left) and the designed CA compensator (right) are applied. One can see from Fig. 13 (right) that with the application of the CA compensator the shadows and ripples appearing in the left-side, error and height images, are completely removed, significantly improving the quality of the images.
Figure 13.
Topography (top) and deflection (bottom) AFM images, taken from freshly cleaved and sanded mica at 60 lines/sec with conventional counterbalancing technique (left), and CA compensator applied (right), for similar PID gains.
CONCLUSION
The nanoscale resolution and versatility of atomic force microscope makes it an ideal candidate for real-time observation of nanoscale processes. However, to this end the limited imaging speed of these devices needs to be improved. The new generation of rigid nano-positioners has shown great capabilities for high speed AFM imaging. The counterbalancing technique, currently implemented in these scanners, aims to suppress the structural vibrations and hence improve the image quality at high speeds. However, this technique is built upon the assumption of similar mechanical properties of the z and counter-z piezos. This requirement is difficult to maintain in practice. Furthermore, even at its highest performance capabilities, the counterbalancing technique not only fails to compensate for the z piezo dynamics but also can intensify such vibrations, potentially leading to inferior imaging performance. In this research we illustrated that by proper actuation of the counter-z piezo one can compensate for these limitations. This was achieved by modifying the AFM controller output via a CA compensator. The compensator parameters were estimated based on the measured deflection signals, eliminating the need for any additional sensors. The proposed technique was evaluated on the dynamic response of the z piezo as well as the images obtained from several samples of freshly cleaved and sanded mica featuring sharp profile edges. These results corroborated the effectiveness of the proposed technique in significantly improving the image quality at high scan speeds.
ACKNOWLEDGMENTS
This work was supported by Samsung Electronics and the Singapore-MIT Alliance, National Institutes of Health under Award No. RO1 GM65354, The Swiss National Science Foundation (205321_134786) and the Schrödinger foundation.
APPENDIX A: DETAILS ON EQS. 1a, 1b
where,
and
where,
APPENDIX B: EXTRACTION OF THE IDEAL DEVIATION RESPONSE, y(n) FROM THE MEASURED DEFLECTION SIGNAL, hz(n)
As mentioned in Sec. 3 the ideal response of the z piezo can be written as a scaled version of the input voltage, i.e., β* v(n). Hence, for a given scaling parameter β* and the excitation voltage v(n), the ideal deviation response of the z piezo can be obtained as
As such, to extract the ideal deviation response the scaling parameter β* should be calculated. This can be done by evaluating the mean of the truncated impulse response associated with Gz(q). We denote the truncated impulse response associated with the transfer function Gz(q) by an L × 1 vector gz. Then we can write:
| (B1) |
where * reflects the convolution operation. From the above equation23 for the given dataset hz(n) and RBS excitation signal v(n), n = 1, …, N, the impulse response, gz, can be obtained through the following:
| (B2) |
where Rv is the autocorrelation matrix for the dataset v(n) and Rhv the cross correlation matrix for v(n) and hz(n). Then we can write:
| (B3) |
where is an estimate of the scaling parameter. Hence, we have
| (B4) |
APPENDIX C: FREQUENCY DOMAIN INTERPRETATION OF THE LEAST SQUARES BASED COMPENSATOR PARAMETER ESTIMATION
In the following we give a frequency domain interpretation of the CA compensator parameter estimation based on Eq. 8. Given two datasets {u(n); n = 1, …, N} and {y(n); n = 1, …, N}, with {eθ(n); n = 1, …, N} given by Eq. 6, we can write:
| (C1) |
Then from the Parseval's theorem23 we have
| (C2) |
On the other hand, denoting , one can show23
| (C3) |
where W and U are the DFT representations of u(n) and w(n), given by and , respectively, and where c is a constant. From Eqs. 6, C3, for large datasets, i.e., N ≫ 1 Eq. C1 can be written as
| (C4) |
Substituting Eq. C4 into Eq. C2, we have
| (C5) |
On the other hand, similar to Eq. C3, for Eq. 9 we can write23
which for large N can be written as
| (C6) |
Using Eq. C6 in Eq. C5, we have
| (C7) |
APPENDIX D: THE BANDWIDTH OF THE TRANSFER FUNCTION FROM THE cz ACTUATION TO z PIEZO RESPONSE
In the following we provide an approximate evaluation of the bandwidth of the transfer function, P(s) = Hcz(s)/Dcz(s), from the counter z piezo elongation to the vibration response of the z piezo, hcz(t), where (see Fig. 2b) and fz(t) = 0. As such, it is inherently assumed that the counter-z piezo has a bandwidth on the same order or wider than that of the z-piezo.
Referring to the 3 DOF model of Fig. 2b, we can write
| (D1) |
| (D2) |
| (D3) |
where fcz(t) represents the internal expansion force generated by the counter-z piezo.
| (D4) |
where X(s), Hcz(s), and Dcz(s) are the Laplace transformations of x, hcz, and dcz, respectively.
| (D5) |
where in the above approximation, it is assumed that mb ≫ mcz, mz.
According to Eq. D5, the transfer function, P(s), from the elongation excitation of the counter-z piezo to the vibration response measured on top of the z-piezo, has bandpass characteristics. The passband of this transfer function is [ωb, ωz], where and are the natural frequencies associated with the z piezo and the base structure, respectively.
APPENDIX E: TIME DOMAIN INTERPRETATION OF THE OUT-OF-BAND COMPENSATOR GAIN PENALIZATION
Following the bandpass filtering pre-processing step, the sum square error V(θ) can be approximated by
where 2πnL/N = ωL and 2πnH/N = ωH, are the lower and upper cutoff frequencies of the bandpass filter, respectively. and represent the out of band frequency content of the bandpass filtered y(n) and u(n), (denoted by y′(n) and u′(n), respectively), and as a result . By adding a constant to for {n ∈ {[1, …, nL − 1] ∪ [N − nL + 1, …, N] ∪ [nH + 1, N − nH − 1]}}, we can write:
| (E1) |
Through the minimization of the cost function given by Eq. E1 the squared out of band gain of the estimated compensator is penalized with weight |λn|2. As such, the out of band roll off of the compensator is forced. In the time domain, for , this can be implemented by adding harmonics to u′(n) as given below:
| (E2) |
where * denotes complex conjugate, Q = (N − 1)/2, λ′ = 0 for N odd and Q = N/2 − 1, λ′ = λN/2 for N even.
A larger λn would lead to a steeper out-of-band roll-off of the compensator. Selection of penalizing weight function is quite flexible and may vary depending on the system noise and required roll off. However, as a rule of thumb λn may be selected according to the following:
| (E3) |
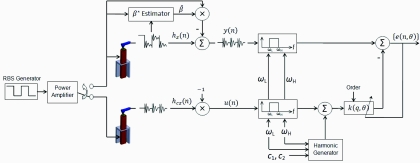
A schematic summary of the steps in the proposed compensator design technique is given in Fig. 14.
Figure 14.
Schematic representation of the proposed compensator design technique.
References
- Binnig G., Quate C. F., and Gerber C., Phys. Rev. Lett. 56(9), 930 (1986). 10.1103/PhysRevLett.56.930 [DOI] [PubMed] [Google Scholar]
- Kodera N., Yamashita H., and Ando T., Rev. Sci. Instrum. 76(5), 053708 (2005). 10.1063/1.1903123 [DOI] [Google Scholar]
- Ando T., Kodera N., Naito Y., Kinoshita T., Furuta K., and Toyoshima Y. Y., Chemphyschem 4(11), 1196 (2003). 10.1002/cphc.200300795 [DOI] [PubMed] [Google Scholar]
- Viani M. B., Pietrasanta L. I., Thompson J. B., Chand A., Gebeshuber I. C., Kindt J. H., Richter M., Hansma H. G., and Hansma P. K., Nat. Struct. Biol. 7(8), 644 (2000). 10.1038/77936 [DOI] [PubMed] [Google Scholar]
- Hillner P. E., Gratz A. J., Manne S., and Hansma P. K., Geology 20(4), 359 (1992). [DOI] [Google Scholar]
- Hobbs J. K., Humphris A. D. L., and Miles M. J., Macromolecules 34(16), 5508 (2001). 10.1021/ma0104478 [DOI] [Google Scholar]
- Burns D. J., Youcef-Toumi K., and Fantner G. E., Nanotechnology 22(31), 315701 (2011). 10.1088/0957-4484/22/31/315701 [DOI] [PubMed] [Google Scholar]
- Salapaka S., Sebastian A., Cleveland J. P., and Salapaka M. V., Rev. Sci. Instrum. 73(9), 3232 (2002). 10.1063/1.1499533 [DOI] [Google Scholar]
- Daniele A., Salapaka S., Salapaka M. V., and Dahleh M., Proceedings of the American Control Conference, San Diego, California, 2–4 June 1999, pp. 253–257.
- Leang K. K. and Devasia S., The 2nd IFAC Conference on Mechatronic Systems, Berkeley, CA, 9–11 December 2002, pp. 283–289.
- Schitter G. and Stemmer A., Microelectron. Eng. 67–68, 938 (2003). 10.1016/S0167-9317(03)00157-6 [DOI] [Google Scholar]
- Schitter G., Allgower F. and Stemmer A., Nanotechnology 15(1), 108 (2004). 10.1088/0957-4484/15/1/021 [DOI] [Google Scholar]
- Viani M. B., Schaffer T. E., Paloczi G. T., Pietrasanta L. I., Smith B. L., Thompson J. B., Richter M., Rief M., Gaub H. E., Plaxco K. W., Cleland A. N., Hansma H. G., and Hansma P. K., Rev. Sci. Instrum. 70(11), 4300 (1999). 10.1063/1.1150069 [DOI] [Google Scholar]
- Fantner G. E., Schitter G., Kindt J. H., Ivanov T., Ivanova K., Patel R., Holten-Andersen N., Adams J., Thurner P. J., Rangelow I. W., and Hansma P. K., Ultramicroscopy 106(8–9), 881 (2006). 10.1016/j.ultramic.2006.01.015 [DOI] [PubMed] [Google Scholar]
- Sulchek T., Hsieh R., Adams J. D., Yaralioglu G. G., Minne S. C., Quate C. F., Cleveland J. P., Atalar A., and Adderton D. M., Appl. Phys. Lett. 76(11), 1473 (2000). 10.1063/1.126071 [DOI] [Google Scholar]
- Pao L. Y., Butterworth J. A., and Abramovitch D. Y., Proceedings of the American Control Conference, New York, NY, 9–13 July 2007, pp. 3509–3515.
- El Rifai K., El Rifai O., and Youcef-Toumi K., “On dual actuation in atomic force microscopes,” Proceedings of the 2004 American Control Conference, Boston, MA, 30 June–2 July 2004, pp. 3128–3133.
- Salapaka S., De T., and Sebastian A., Appl. Phys. Lett. 87(5), 053112 (2005). 10.1063/1.2006213 [DOI] [Google Scholar]
- Kindt J. H., Fantner G. E., Cutroni J. A., and Hansma P. K., Ultramicroscopy 100(3–4), 259 (2004). 10.1016/j.ultramic.2003.11.009 [DOI] [PubMed] [Google Scholar]
- Sebastian A. and Salapaka S. M., IEEE Trans. Control Syst. Technol. 13(6), 868 (2005). 10.1109/TCST.2005.854336 [DOI] [Google Scholar]
- Hansma P. K., Fantner G. E., and Kindt J. H., U.S. Patent 7,278,298 November 30, 2004.
- Abramovitch D. Y., Andersson S. B., Pao L. Y., and Schitter G., “A tutorial on the mechanisms, dynamics, and control of atomic force microscopes,” Proceedings of the American Control Conference, New York, NY, 9–13 July 2007, pp. 3488–3502.
- Ljung L., System Identification: Theory for the user, 2nd ed. (Prentice Hall, Upper Saddle River, NJ, 1999). [Google Scholar]
- The MathWorks, “MATLAB User's Manual” (2009).
- Oppenheim A. V., Schafer R. W., and Buck J. R., Discrete-Time Signal Processing, 2nd ed. (Prentice Hall, Upper Saddle River, NJ, 1998). [Google Scholar]


