Abstract
Purpose: In current computed tomography (CT) examinations, the associated x-ray radiation dose is of a significant concern to patients and operators. A simple and cost-effective means to perform the examinations is to lower the milliampere-seconds (mAs) or kVp parameter (or delivering less x-ray energy to the body) as low as reasonably achievable in data acquisition. However, lowering the mAs parameter will unavoidably increase data noise and the noise would propagate into the CT image if no adequate noise control is applied during image reconstruction. Since a normal-dose high diagnostic CT image scanned previously may be available in some clinical applications, such as CT perfusion imaging and CT angiography (CTA), this paper presents an innovative way to utilize the normal-dose scan as a priori information to induce signal restoration of the current low-dose CT image series.Methods: Unlike conventional local operations on neighboring image voxels, nonlocal means (NLM) algorithm utilizes the redundancy of information across the whole image. This paper adapts the NLM to utilize the redundancy of information in the previous normal-dose scan and further exploits ways to optimize the nonlocal weights for low-dose image restoration in the NLM framework. The resulting algorithm is called the previous normal-dose scan induced nonlocal means (ndiNLM). Because of the optimized nature of nonlocal weights calculation, the ndiNLM algorithm does not depend heavily on image registration between the current low-dose and the previous normal-dose CT scans. Furthermore, the smoothing parameter involved in the ndiNLM algorithm can be adaptively estimated based on the image noise relationship between the current low-dose and the previous normal-dose scanning protocols.Results: Qualitative and quantitative evaluations were carried out on a physical phantom as well as clinical abdominal and brain perfusion CT scans in terms of accuracy and resolution properties. The gain by the use of the previous normal-dose scan via the presented ndiNLM algorithm is noticeable as compared to a similar approach without using the previous normal-dose scan.Conclusions: For low-dose CT image restoration, the presented ndiNLM method is robust in preserving the spatial resolution and identifying the low-contrast structure. The authors can draw the conclusion that the presented ndiNLM algorithm may be useful for some clinical applications such as in perfusion imaging, radiotherapy, tumor surveillance, etc.
Keywords: computed tomography, low-dose, normal-dose, previous scan, nonlocal means, image restoration
INTRODUCTION
The radiation dosage associated with x-ray exposure in current computed tomography (CT) examinations is of a significant concern to patients and operators, especially in screening and monitoring high-risk cancer population.1, 2 Methods to minimize the x-ray exposure have been one of the major endeavors in CT fields.3 A simple and cost-effective means to perform low-dose CT examinations is to lower the milliampere-seconds (mAs) or kVp parameter (or delivering less x-ray energy to the body) as low as reasonably achievable in data acquisition. However, lowering the parameters will unavoidably increase the data noise. The noise would propagate into the CT image if no adequate noise control is applied during image reconstruction.
At present, various techniques in optimizing CT imaging protocols for dose reduction have been explored, e.g., auto exposure control4, 5, 6 and many image reconstruction algorithms with noise suppression have been reported.7, 8 Notably, for low-dose noisy data,9, 10, 11 statistical iterative reconstruction (SIR) methods, which model the noise properties of the measurements and impose adequate regularization on the reconstruction, have shown the potential to achieve a superior noise-resolution tradeoff as compared to analytical reconstruction techniques such as the conventional filtered back-projection (FBP) reconstruction algorithm. A major drawback of SIR is the computational burden associated with the multiple reprojection and back-projection operation cycles through the image domain. One way to mitigate this drawback while maintaining the advantage of noise modeling and regularization is to estimate the ideal sinogram from acquired noisy one and to reconstruct the CT image from the estimated ideal sinogram without the multiple reprojection and back-projection operations through the image domain.12, 13, 14, 15 The gain in efficiency is at the cost of losing more physical modeling information in the reprojection operation through the image domain. As an alternative to the above statistical noise modeling and regularization framework, many sophisticated linear and nonlinear noise filtering techniques for sinogram noise reduction have also been investigated.16, 17, 18, 19 Although most of the linear and nonlinear noise filtering techniques are computationally efficient and can suppress the noise and streak artifacts along the highly attenuated projection, they often sacrifice structural details because of a lack of noise modeling over all projections.
Recently, several structure-preserving filters in the image domain have also been investigated for low-dose CT image restoration. For example, Schaap et al.20 proposed the anisotropic diffusion filter based edge-preserving noise reduction technique, which adaptively tunes the control parameters to obtain noise reduction, edge enhancement, and structure preservation in the images. Borsdorf et al.21 presented a wavelet based structure-preserving filter for CT image noise reduction based on the assumption that the image data can be decomposed into information and temporally uncorrelated noise. In reality, the noise in low-dose CT images is nonstationary and its distribution is usually unknown. Therefore, designing a structure-preserving filter in the image domain is difficult.
To reduce the difficulty in designing a structure-preserving filter, a previously scanned high-quality diagnostic CT image may be used as a priori information. For example, Yu et al.22 proposed a regularized reconstruction strategy, named PSRR, where the previous scans of the patient are used to recover the details in the reconstruction of the current low-dose noisy images. The key idea behind the PSRR is to recognize the substantially changed regions in the low-dose scan and replace the other regions with corresponding features from the previous normal-dose scan. To realize the idea, the PSRR procedure needs accurate image registration. Any residual error in the image registration due to interfractional variation in treatment positions and deformation of the tissues/organs may cause significant error in the image reconstruction. In other words, dedicated or accurate registration algorithms are necessary for PSRR.
To relieve these requirements, this paper presents a method to utilize the previous normal-dose CT scan of the patient as a priori information to restore the signal from the current low-dose CT images. The presented method does not need accurate image registration and can effectively improve the image quality of the low-dose CT scan. The innovation is the use of nonlocal means (NLM),23, 24, 25 which differs from the conventional local operations on neighboring image voxel where accurate registration is needed. NLM can extract the redundancy information from the previous normal-dose CT images. In addition to the innovation, this paper further exploits ways to optimize the nonlocal weights in the NLM framework. The resulting algorithm is called the previous normal-dose scan induced nonlocal means (ndiNLM). Two major contributions of this work are as follows: First, due to the optimized nature of nonlocal weights calculation, the ndiNLM algorithm does not need accurate image registration between the current low-dose and the previous normal-dose CT images. Second, automatic tuning of the smoothing parameter is designed based on the image noise relationship between the current low-dose and the previous normal-dose scan protocols. Qualitative and quantitative evaluations were carried out on both a physical phantom and clinical patients scans in terms of accuracy and resolution properties.
The remaining part of this paper is organized as follows. In Sec. 2, the NLM terminology and ndiNLM algorithm will be presented, and then the evaluation designs will be described. In Sec. 3, experimental results will be reported. Finally, a discussion and conclusion will be given in Sec. 4.
METHODS AND MATERIALS
Brief review of nonlocal means terminology
The NLM concept was originally proposed by Buades et al.23, 24, 25 The discrete version of their NLM algorithm can be expressed as follows. Let B be a discrete grid of voxels and be a noisy image. The restored intensity NLM(μ)(xi) of the voxel xi is the weighted average of all the voxel intensities in the image μ and can be expressed as
| (1) |
where μ(xj) is the original image intensity of voxel xj and w(xi, xj) is the weight assigned to μ(xj) in the intensity restoration for voxel xi. The weight values w(xi, xj) depend on the similarity between the voxels xi and xj, and satisfy the conditions of 0 ≤ w(xi, xj) ≤ 1 and (see Fig. 1a). It can be expressed as
| (2) |
where Z(xi) is a normalizing factor, . The terms Vi and Vj denote two local similarity neighborhoods (named patch-windows) centered at the voxels xi and xj, respectively. The term denotes the vector of neighborhood voxel values restricted in patch-window Vi. The notation ||·||2,a denotes a Gaussian-weighted Euclidean distance between two similarity patch-windows, where a is the standard deviation of the Gaussian function.23 In Eq. 2, h is a parameter which controls the decay of the exponential function. Obviously, when h is small, the weight w(xi, xj) will tend to be small, thus the corresponding restored value NLM(μ)(xi) will tend to be weakly smoothed. When h is large, the restored value NLM(μ)(xi) will be strongly smoothed. Typically, as a smoothing parameter, h depends on the standard deviation of the image noise.
Figure 1.
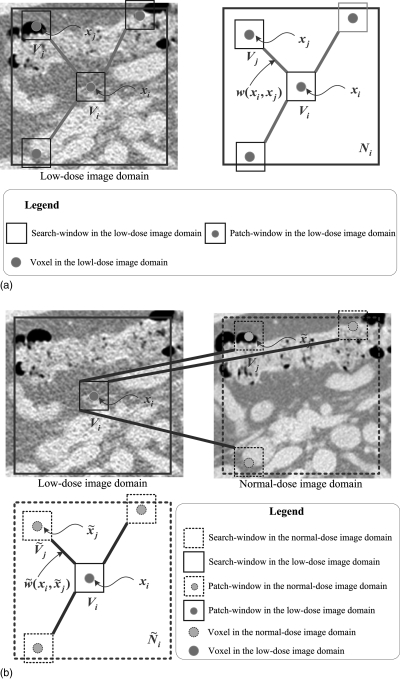
Presentations of the NLM and ndiNLM algorithms. (a) A 2D presentation of the NLM algorithm. The restored value of voxel xi is the weighted average of all intensities of voxels xj in the search-window Ni based on the similarity of two patch-windows Vi and Vj; (b) a 2D presentation of the ndiNLM algorithm. Restored value of voxel xi is the weighted average of all intensities of voxels in the search-window based on the similarity of two patch-windows Vi and . Ni and represent the search-window in the low-dose image domain and the normal-dose image domain, respectively. Vi and represent the patch-window in the low-dose image domain and the normal-dose image domain, respectively.
The NLM algorithm of Eqs. 1, 2 exploits the high degree of information redundancy within the image itself. It indicates that each voxel can systematically employ the global self-prediction configuration information across the whole image. However, in reality, the search of the information across the whole image is computationally prohibitive. To reduce the computational burden, the search will be confined to an appropriate neighborhood Ni(<B) (named search-window) centered at the current voxel xi.
Description of the ndiNLM algorithm
Our proposed ndiNLM algorithm adapts the NLM concept to exploit the high degree of information redundancy in the previous normal-dose scan, instead of the low-dose image itself. The ndiNLM algorithm is still performed in the image domain and contains three major steps: (a) rough image registration between the current low-dose CT image volume μld and the previous normal-dose CT image volume μnd; (b) optimal nonlocal weights construction using rough registered μld and μnd; and (c) NLM weighted average using the optimal nonlocal weights. In the following sections, we describe each step in detail.
Rough registration of two image volumes
In order to utilize the information from both the previous normal-dose and the current low-dose scans, we expect that these two scans are somehow spatially aligned. However, because the two scans are often not acquired simultaneously or even from the same scanner, the two image volumes frequently contain nonrigid organ motion and are not perfectly aligned. Despite this, there is no doubt that the normal-dose image volume contains a huge amount of redundant information regarding the low-dose image volume. As in the work in video sequence restoration,25 if we have two roughly registered volumes, the rich redundant information in the roughly registered normal-dose volume can be effectively utilized to induce the ndiNLM weighted average or signal restoration from the low-dose volume more effectively.
Nonlocal weights construction
Due to the redundancy of information in the previous normal-dose image and in the current low-dose image, an optimal nonlocal weights may be determined from the previous normal-dose images, instead of the low-dose image itself, to improve the NLM weighted average. If the previous normal-dose image volume has been roughly registered, , with the current low-dose image volume μld, then an optimal nonlocal weights construction, see Fig. 1b, can be constructed using the NLM terminology as follows:
| (3) |
where is a normalizing factor, . The subsets Vi and denote two similar patch-windows centered at voxel xi in the image volume μld and at voxel in the image volume , respectively. represents the search-window in the image volume .
NLM weighted average
Based on the constructed nonlocal weights , a weighted average operation can be performed similar to Eq. 1. Our proposed ndiNLM algorithm, using the new nonlocal weights derived from the previous normal-dose scan as a priori information, can be described as follows:
| (4) |
From the weighted average of Eq. 4, we can see that the restored intensity values for the restored low-dose images are from the registered normal-dose images. As a result, the noise induced artifacts in the current low-dose CT image will be greatly suppressed in the restored low-dose CT image due to the registered normal-dose image as a reference, which provides redundancy of information for the restoration operation.
Algorithm implementation
Rough registration
An equivalent meridian plane (EMP) based fast three-dimensional (3D) medical image registration algorithm26 was adapted in implementing the ndiNLM algorithm. The accuracy and robustness of the EMP registration has been validated by many registration experiments. When the low-dose image volume μld is selected as the reference, the EMP algorithm registers the normal-dose image volume μnd to the low-dose image volume μld through the following five steps: (1) performing binarization on the two image volumes to form 3D vectors and producing the vector coordinate representation of the two image volumes; (2) obtaining the centroid and covariance matrices of the two volumes; (3) performing a principal component analysis (PCA) on the two volumes; (4) setting the two volumes into a canonical coordinate frame by the PCA transform; and (5) refining the registration by maximizing the mutual information between EMP in the normal-dose image volume and the coordinate plane in the low-dose image volume.
Nonlocal weights construction
For the proposed nonlocal weights construction by Eq. 3, three parameters will be determined: the sizes of the search-window, the patch-window, and the value of the smoothing parameter h.
Selection of the search- and patch-windows.
To fully exploit the redundant information for the ndiNLM restoration from the roughly registered normal-dose image volume , the size of the search-window should be large enough to acquire more similarity information while minimizing the influence of the rough 3D registration. However, an increase of the search-window size increases the computational demands of the algorithm. Thus, to obtain an adequate size for the search-window , an empirical strategy was adapted as follows: First, we selected a slice of interest to be restored from the low-dose image volume. Then the corresponding or associated slice was determined from the registered normal-dose image volume to perform an optimal nonlocal weights construction. Through extensive experiments by visual inspection for eye-appealing results with comparison to the normal-dose scans, we found that a 41 × 41 search-window is adequate for effective noise and artifacts suppression while retaining computational efficiency. In selecting the size of the patch-windows Vj and , the similarity of two patch-windows was measured by the conventional Euclidean distance ||·||2, which has been proven to be very effective in our experiments and a 5 × 5 similarity patch-window was found adequate.
Tuning of the smoothing parameter.
According to the previous studies,23 the smoothing parameter h is a function of the standard deviation σ of the image noise (or low-dose image noise in our case), and h = ασ is a good choice in the two-dimensional (2D) image domain where α is a scalar. For the ndiNLM algorithm, because the noise distribution of the low-dose images is not stationary and usually unknown, determining the standard deviation σ of the low-dose images is not a trivial task. On the other hand, progress has been made on the simulation of low-dose CT image noise from normal-dose CT scans.27, 28 For example, if the mAs value is doubled in the data acquisition, the noise level in the data will be reduced by a factor of . Based on this observation, and the work of Coupé et al.,29 the smoothing parameter h can be determined as for the ndiNLM algorithm, where is the standard deviation of the normal-dose image. The term can be estimated via a robust median estimator, i.e., , where W(i, j) represents the (i, j)th coefficient of wavelets subband HH.30 The quantity ρ is the ratio of mAs values of the normal-dose scan and the low-dose scan. represents the size of the search-window as defined before. The scalar α is determined by visual inspection on the restoration of the low-dose image with comparison to the normal-dose image.
NLM weighted average
After the construction of the nonlocal weights, the NLM weighted average in the ndiNLM algorithm can be performed effectively using Eq. 4.
For comparison purpose, we adapted the NLM algorithm of Eq. 1 with a modification on its nonlocal weight, h2 = 2τσ2|Ni| rather than h = ασ, in order to consider the size of the search window |Ni|, centered at voxel i. Here, σ is the standard deviation of the low-dose scans and it can be estimated via a robust median estimator,30 and τ, similar to α, is a scalar (to be determined by experiments). By this modification, the nonlocal weight in the NLM algorithm is comparable to the weight in the ndiNLM algorithm, i.e., .
In implementing both the NLM and ndiNLM algorithms, Ni = 41 × 41 and Vi = 5 × 5 were chosen for the roughly registered two image volumes. The parameters τ for the NLM algorithm and α for the ndiNLM algorithm were determined by a trial-and-error fashion for a visually appealing result in comparison to normal-dose scans. With such an implementation, we can see the performance of the NLM algorithm for low-dose CT image restoration and also observe the gain obtained by the use of the previous normal-dose scan.
Data acquisition
Experimental data were acquired from a physical phantom and two patients using three different CT scanners: a 16-row MDCT scanner from GE (LightSpeed VCT; GE Co., Ltd., Tianjing, China), a 16-row MDCT scanner from Siemens (Siemens Emotion CT 2007E; Siemens Co., Ltd., Guangzhou, China), and 64-row MDCT scanner from Siemens (Siemens SOMATOM Definition Dual Source CT; Siemens Co., Ltd., Guangzhou, China). All CT images were downloaded to personal computers using the DICOM (Digital Imaging and Communications in Medicine) file format with a matrix size of 512 × 512 and a gray level of 16-bits.
Physical phantom imaging
The physical phantom was scanned by the GE LightSpeed VCT scanner without table movement. The scanning parameters were as follows: 16 × 5.0 mm detector collimation, 0.5 s per gantry rotation, 5.0 mm slice thickness, tube voltage of 120 kVp, tube currents of 50 mA and 250 mA, and a standard reconstruction kernel.
Patient abdominal imaging
The patient scan was scheduled for an abdominal normal-dose CT study for medical reasons and an additional low-dose scan was undergone by patient consent. The normal-dose scan was performed first. Then, the low-dose scan was performed after 20 min. All abdominal CT images were acquired with the Siemens Emotion CT scanner in a spiral mode. The scanning parameters were as follows: 16 × 1.2 mm detector collimation, pitch of 0.8 mm, 0.6 s per gantry rotation, 1.5 mm slice thickness, tube voltage of 130 kVp, tube currents of 50 mA and 333 mA, and reconstruct kernel of B40s. The CT dose indexes (CTDIvol) for the normal- and low-dose scans are 22.29 mGy and 3.35 mGy, respectively.
Patient brain perfusion imaging
Another patient with an old infarction was scheduled for a brain perfusion CT study. Under written consent, the patient was scanned with the 64-row MDCT scanner from Siemens without table movement. First, an unenhanced noncontrast CT scan of the whole brain was performed with a tube current of 240 mA, tube voltage of 80 kVp, as the previous normal-dose scan in this study. Then, 50 ml of Iopromide 370 (Ultravist, Schering, Germany) was injected at a rate of 5.0 ml/s, followed by contrast-enhanced image acquisition from three adjacent sections, including the level of the basal ganglia, of the brain volume. The cine (continuous) post-contrast normal-dose scan was performed by the following protocol: 200 mA, 80 kVp, slice thickness 8 mm, 1 s per rotation for a duration of 39 s, and reconstruction kernel of H30s. From the normal-dose enhanced scan, we simulated the low-dose brain perfusion enhanced CT images from the acquired normal-dose enhanced images using a simple CT noise simulator31 according to the Siemens 64-row MDCT imaging geometry, rather than scanned the patient twice, in order to alleviate radiation dose. The CTDIvol for the normal-dose enhanced scan is 380.80 mGy. The CTDIvol for the simulated low-dose contrast-enhanced CT scan is about one-sixth of that from the normal-dose scan.
Evaluation merits
Evaluation by noise reduction
The following metrics were utilized to measure the noise reduction on the restored image from the low-dose image: (1) mean per cent bias (MPB); (2) mean per cent squared error (MPSE); and (3) mean per cent absolute error (MPAE),
| (5) |
| (6) |
| (7) |
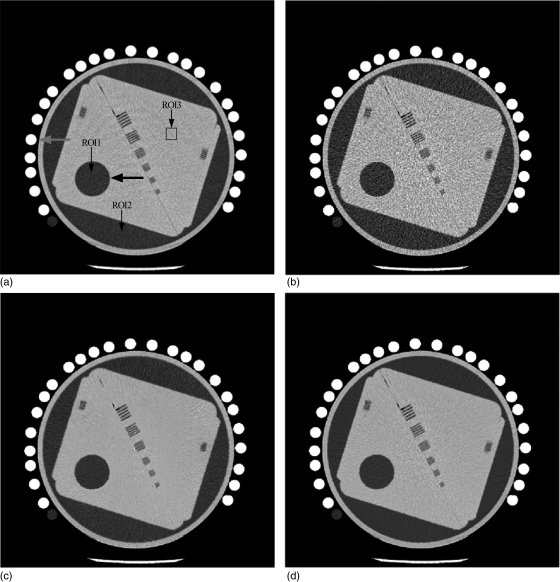
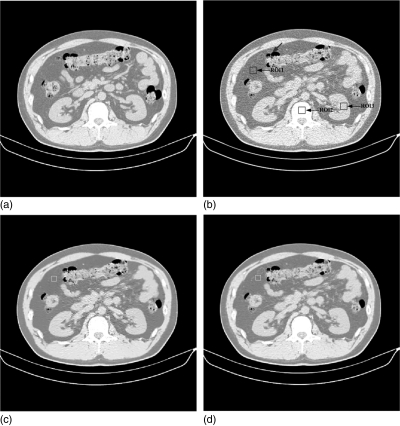
where m indexes the voxels in a region of interest (ROI), S is the number of voxels in the ROI, denotes the registered normal-dose image, denotes the estimated image of low-dose scan, and is the average voxel value in the ROI of the registered normal-dose image. Three ROIs were selected from the phantom and the patient abdominal images, respectively, as shown in Fig. 2a and Fig. 8b and indicated by the squares.
Figure 2.
Examples from physical phantom image restorations: (a) from the normal-dose scan acquired with 120 kVp, 125 mAs protocol; (b) from the low-dose scan acquired with 120 kVp, 25 mAs protocol; (c) the restored image from the low-dose scan by using the NLM algorithm (Ni = 41 × 41, Vi = 5 × 5, τ = 1.2 × 10− 3); and (d) the restored low-dose image by using the ndiNLM algorithm with the normal-dose image in (a) as a reference image (Ni = 41 × 41, Vi = 5 × 5, α = 1.1 × 10− 2). Display window option: width is 300 HU, level is 35 HU.
Figure 8.
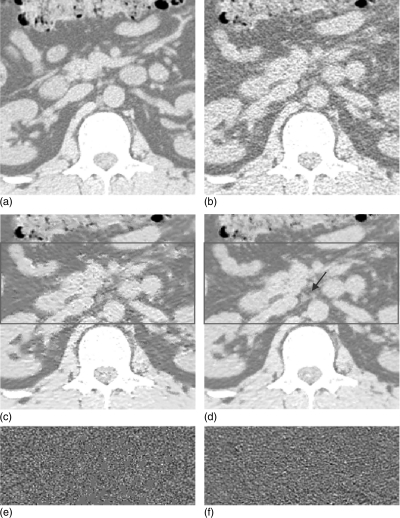
Clinical abdominal CT image restorations: (a) the normal-dose scan acquired with 130 kVp, 200 mAs protocol and a standard B40s reconstruction kernel; (b) the low-dose scan acquired with 130 kVp, 30 mAs protocol and a standard B40s reconstruction kernel; (c) the restored image from the low-dose scan using the NLM algorithm (Ni = 41 × 41, Vi = 5 × 5, τ = 2.44 × 10− 4); and (d) the restored image from the low-dose scan using the ndiNLM algorithm, where the registered reference image from the normal-dose scan (a) was used as a reference image (, α = 1.95 × 10− 4). Display window option: width is 545 HU, level is − 169 HU.
Evaluation by contrast-to-noise ratio
Since a low-contrast region is of interest in the CT imaging, we selected an ROI (indicated by the larger black arrow) in Fig. 2a for the calculation of the contrast-to-noise ratio (CNR),
| (8) |
where μROI is the mean of the voxels inside the ROI, and μBG is the mean of the voxels in the background. The terms σROI and σBG are the standard deviations of the voxel values inside the ROI and the background, respectively.
Evaluation by resolution measure
Resolution is usually measured using the modulation transfer function (MTF). In this study, we used the MTF as our resolution measure. For the MTF computation, an edge spread function (ESF) was first obtained along the central horizontal profile on the left disk as indicated by the red arrow in Fig. 2a. Then a line spread function (LSF) was generated from the derivation of the ESF. By applying the Fourier transformation on the LSF, the MTF was calculated, where a normalization is imposed so that MTF(0) = 1.
Evaluation merits for perfusion CT imaging
The perfusion imaging maps generated from the enhanced CT images have been widely used to evaluate infarctions, including prediction of tissue at risk and patient outcome.32 In our experiments, cerebral blood volume (CBV), cerebral blood flow (CBF), and mean transit time (MTT) maps were generated by using a public domain software program, Perfusion Mismatch Analyzer (PMA).33 As a standardized software, PMA was developed in the activity of Acute Stroke Imaging Standardization group in Japan.34 A standard singular-value decomposition method was used in the PMA.
RESULTS
Phantom study
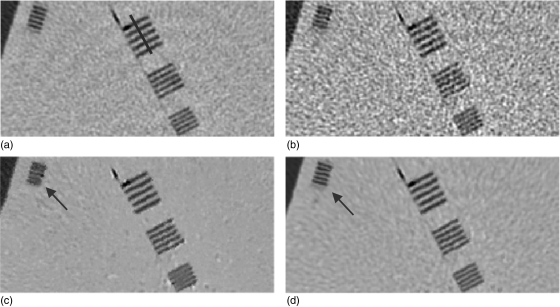
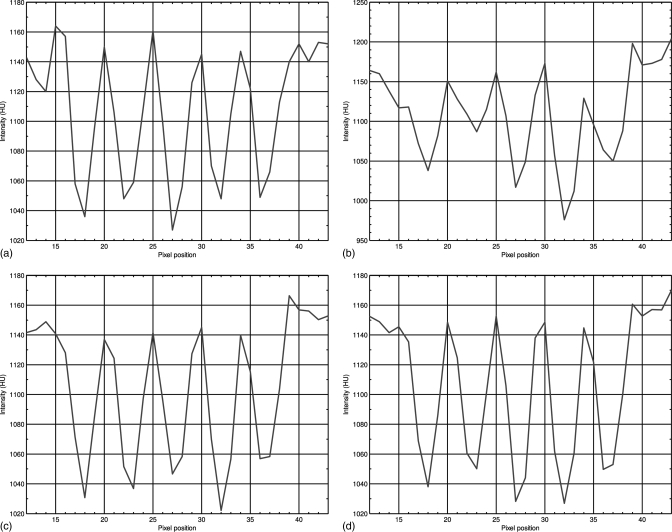
Figure 2 shows one slice of the phantom images with various disks and strip bars. Figure 2a was reconstructed by the conventional FBP method from the normal-dose scan acquired with 120 kVp, 125 mAs protocol. Figure 2b was reconstructed by the conventional FBP method from the low-dose scan acquired with 120 kVp, 25 mAs protocol. It can be observed that the noise level is quite high in the low-dose image. Figure 2c shows the restored image from the low-dose scan by using the NLM algorithm (i.e., without utilizing the previous normal-dose scan), where some texture artifacts are presented. Figure 2d shows the restored image from the low-dose scan by using the presented ndiNLM algorithm, where the normal-dose image corresponding to Fig. 2a was used as the reference image. It can be seen that both the NLM and ndiNLM algorithms suppress the noise-induced artifacts effectively. The ndiNLM algorithm produces a more similar texture to the normal-dose scan than the NLM algorithm. To further illustrate the effectiveness of the NLM and ndiNLM algorithms for signal restoration from the low-dose scan and their difference, zoomed images of the strip bars from the corresponding pictures in Fig. 2 are shown in Fig. 3. It can be observed that the small strip bars are well preserved shown in Fig. 3c and Fig. 3d for the NLM and ndiNLM algorithms. Their difference is noticeable. The result of the ndiNLM algorithm is more similar to the normal-dose scan than that of the NLM algorithm. Figure 4 shows the profiles through the small strips of the pictures in Fig. 3. These profiles show that the intensity values of the restored images by both the NLM and ndiNLM algorithms are well preserved. The gain obtained by using the normal-dose scan is noticeable. In summary, as shown in Figs. 34, the strip bars were well preserved by the NLM and ndiNLM algorithms, whereas some of the strip bars were over-smoothed by the NLM algorithm. To further quantitatively evaluate the NLM and the ndiNLM algorithms, the noise reduction, CNR, and resolution preservation were measured as described in the following sections.
Figure 3.
Zoomed images of the strip bars from the corresponding images in Fig. 2: (a) from the normal-dose scan; (b) from the low-dose scan; (c) from the restored image of the low-dose scan by using the NLM algorithm; and (d) from the restored image of the low-dose scan by using the ndiNLM algorithm. Display window option: width is 300 HU, level is 35 HU.
Figure 4.
Profiles through the small strips of the images in Fig. 3 along the line as indicated by the blue lines in Fig. 3: (a) from the normal-dose scan; (b) from the low-dose scan; (c) from the restored image of the low-dose scan by using the NLM algorithm; and (d) from the restored image of the low-dose scan by using the ndiNLM algorithm.
Noise reduction measure
Table TABLE I. lists the MPB, MPSE, and MPAE measures of the restored image from the low-dose scan by using the NLM and ndiNLM algorithms, respectively. It can be seen that the results from both NLM and ndiNLM algorithms exhibited an average of more than 10% gains over the current low-dose scan in terms of the MPB, MPSE, and MPAE measures on the three different ROIs. The ndiNLM algorithm performed better than the NLM algorithm with more than 10% gains for ROI1 and ROI2 except ROI3 where for MPSE and MPAE metrics the NLM algorithm is about 2% better than the ndiNLM algorithm.
TABLE I.
Image quality metrics on the three ROIs indicated by the squares in Fig. 2a.
| ROI1 | ROI2 | ROI3 | |||||||
|---|---|---|---|---|---|---|---|---|---|
| Methods | MPB | MPSE | MPAE | MPB | MPSE | MPAE | MPB | MPSE | MPAE |
| NLM | − 5.12% | 1.07 | 0.85 | 4.25% | 1.23 | 1.07 | − 2.89% | 1.04 | 0.82 |
| ndiNLM | 3.87% | 0.94 | 0.76 | − 0.40% | 0.86 | 0.70 | 0.22% | 1.07 | 0.83 |
| Low-dose scan | 18.33% | 2.33 | 1.87 | − 0.48% | 2.14 | 1.71 | 4.36% | 2.25 | 1.80 |
CNR measure
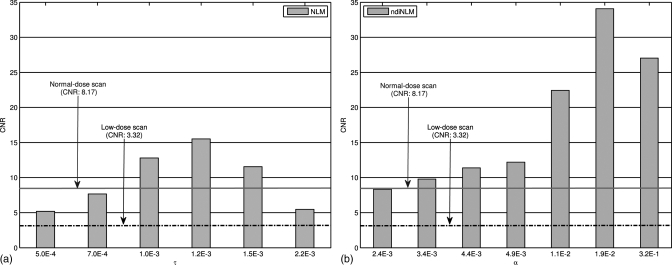
Figure 5 shows the variation of the CNRs of the restored images from the low-dose scan using the NLM and ndiNLM algorithms, respectively, with different scalar parameter values. As can be seen, the CNR from the NLM algorithm increased as the parameter τ increased from 5.0 × 10− 4 to 1.2 × 10− 3, and then it decreased as τ increased from 1.2 × 10− 3 to 2.2 × 10− 3. In contrast, the CNR from the ndiNLM algorithm increased as the parameter α increased from 2.4 × 10− 3 to 1.9 × 10− 2. This reflects the difference between NLM and ndiNLM algorithms for low-contrast region identification. The ndiNLM algorithm performed more consistently than the NLM method for the wide range of the parameter value. Both algorithms can improve the CNR of the low-dose scan (acquired with 120 kVp and 25 mAs) toward that of the normal-dose scan (acquired with 120 kVp and 125 mAs protocol). The CNR of the restored image from the low-dose scan by the ndiNLM algorithm is higher than that of the NLM method in a wide range of the parameter value.
Figure 5.
CNRs of the ROI1 in Fig. 1a with different smoothing parameters: (a) from the NLM algorithm where the scalar parameter τ was selected from 5.0 × 10− 4 to 2.2 × 10− 3; (b) from the ndiNLM algorithm where the scalar parameter α was selected from 2.4 × 10− 3 to 3.2 × 10− 1. The solid and dotted-dashed lines denote the CNRs for the normal-dose scan and the low-dose scan, respectively.
Influence of the scalar parameter on the resolution
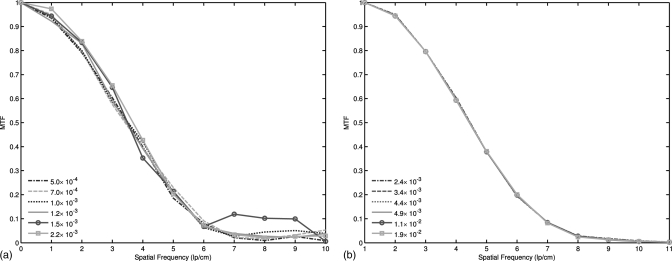
Figure 6 shows the MTFs of the restored images from the low-dose phantom scan by using both the NLM and ndiNLM algorithms with respect to a wide range of the scalar parameters. Figure 6a shows the MTFs of the image restored by the NLM algorithm, while Fig. 6b shows the MTFs of the image restored by the ndiNLM algorithm. It can be observed that the spatial resolution of the restored images by the NLM algorithm fluctuated as the smoothing strength changed from τ = 5.0 × 10− 4 to τ = 2.2 × 10− 3. In contrast, the MTF curves of the restored images by the ndiNLM algorithm were clustered together when the smoothing parameters changed in a large interval from α = 2.4 × 10− 3 to α = 1.9 × 10− 2.
Figure 6.
MTF curves of two NLM-based image restorations with different scalar parameter settings: (a) the results from the restored image by the NLM algorithm and (b) the results from the restored image by the ndiNLM algorithm.
Influence of registration accuracy on the ndiNLM algorithm
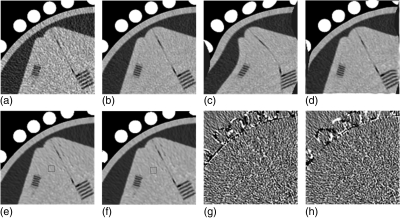
To qualitatively evaluate the influence of image registration on the restoration performance of the ndiNLM algorithm, we first introduced an elastic deformation in a normal-dose phantom image acquired with a 120 kVp and 125 mAs protocol. Then the deformed normal-dose phantom image was used to directly induce the ndiNLM restoration on a low-dose image acquired with a 120 kVp and 25 mAs protocol. Figure 7 shows the influence of the registration accuracy with the normal-dose image on the ndiNLM algorithm in the low-dose image restoration. Figures 7a, 7b show the low-dose image and the normal-dose image, respectively. The normal-dose image with elastic deformation is shown in Fig. 7c. By the use of the EMP registration algorithm on Fig. 7c and Fig. 7a, the registered result is shown in Fig. 7d. From Fig. 7b and Fig. 7c, the deformation between these two images is obvious. Figure 7e shows the low-dose image restored by the ndiNLM algorithm with Fig. 7c as the reference image (the previous normal-dose scan). Figure 7f shows the restored image from the low-dose scan by the ndiNLM algorithm with Fig. 7d as the reference image. The images in Figs. 7e, 7f are very similar. Figure 7g shows the corresponding difference image between Figs. 7e, 7b; and Fig. 7h shows the corresponding difference image between Figs. 7f, 7b. From the difference images of Figs. 7g, 7h, it can be observed that the ndiNLM algorithm is not sensitive to the deformed normal-dose reference image. In other words, the presented ndiNLM method does not heavily depend on the normal-dose image registration accuracy. A rough registration may be sufficient.
Figure 7.
Influence of the normal-dose image registration on the performance of the ndiNLM algorithm for image restoration from the low-dose scan: (a) a low-dose scan acquired with 120 kVp, 25 mAs protocol; (b) a normal-dose scan acquired with 120 kVp, 125 mAs protocol; (c) an elastic deformation of the normal-dose image (b); (d) the registered image between (c) and (a) by using the EMP registration algorithm; (e) the restored image by the ndiNLM algorithm with the normal-dose scan (c) as a reference image; (f) the restored image by the ndiNLM algorithm with the normal-dose scan (d) as a reference image; (g) the corresponding difference image of (e) and (b); and (h) the corresponding difference image of (f) and (b). Display window option: width is 300 HU, level is 35 HU.
By the use of metrics of Eqs. 5, 6, 7 on the ROI indicated by the squares in Figs. 7e, 7f, respectively, we obtained the MPB, MPSE, and MPAE values in Table TABLE II.. It can be observed that the ndiNLM method exhibits similar results in terms of the MPB, MPSE, and MPAE metrics with respect to differently deformed reference images.
TABLE II.
| Methods | MPB | MPSE | MPAE |
|---|---|---|---|
| ndiNLM (registration) | 0.44% | 1.04 | 0.87 |
| ndiNLM (no registration) | 0.59% | 1.22 | 0.91 |
Clinical study
Abdominal CT image restoration
Figure 8 shows the restored results from the patient abdominal low-dose CT images by the NLM and ndiNLM algorithms. Figure 8a shows one slice of the normal-dose image acquired with 130 kVp and 200 mAs protocol and reconstructed by a standard B40s reconstruction kernel. Figure 8b shows one slice of the low-dose scan from the same patient with 130 kVp and 30 mAs protocol and a standard B40f reconstruction kernel. Figure 8c shows the restored image from the low-dose scan by the NLM algorithm with scalar parameter value of τ = 2.44 × 10− 4. Figure 8d shows the restored image from the low-dose scan by the ndiNLM algorithm with scalar parameter value of α = 1.95 × 10− 4, where the normal-dose scan in Fig. 8a registered via the EMP algorithm was used as the reference image. Figure 9 shows the zoomed images corresponding to Fig. 8. It can be observed that noise in the low-dose CT images is effectively suppressed by the use of the NLM and ndiNLM algorithms. The quality of the restored image from the low-dose scan by both algorithms is comparable to that of the normal-dose image. The edges are preserved slightly better in the image restored by the ndiNLM algorithm. In the region indicated by the arrow in Fig. 9d, we can see that the low-contrast structure is well preserved in the image restored by the ndiNLM algorithm. However, some structural details are blurred in the image restored by the NLM algorithm. This observation is consistent with the quantitative evaluation using the physical phantom studies as described above, i.e., both the NLM and ndiNLM algorithms performed well in the image restoration and the gain obtained using the previous normal-dose scan is noticeable. Figures 9e, 9f show the corresponding difference ROI images (indicated by the red squares in Figs. 9c, 9d) between Figs. 9c, 9b and Figs. 9d, 9b, respectively. It can be further observed that the ndiNLM algorithm can preserve well edge information even when some tissue motion exists between the normal- and low-dose images.
Figure 9.
Zoomed abdominal CT images corresponding to Fig. 8: (a) the normal-dose scan; (b) the low-dose scan; (c) the restored image from the low-dose scan by the NLM algorithm; (d) the restored image from the low-dose scan by the ndiNLM algorithm; (e) the corresponding difference ROI image, indicated by the red square in (c), from (c) and (b); and (f) the corresponding difference ROI image, indicated by the square ROI in (d), from (d) and (b). Display window option: width is 545 HU, level is − 169 HU.
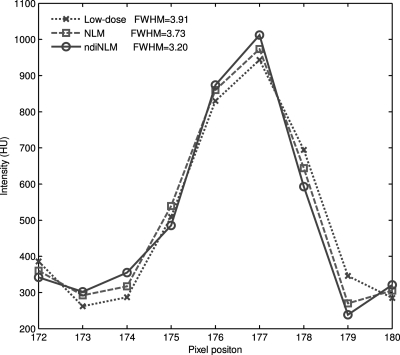
Figure 10 displays the horizontal profiles through a small strip as indicated by the arrow in Fig. 8b. Each profile was fitted to a Gaussian function. The full width at half maximum (FWHM) of the profile is 3.73 voxel units for the NLM method and 3.20 pixels for the presented ndiNLM algorithm. The standard deviation of a uniform region (indicated by the white square in Figs. 8c, 8d, respectively) is 26.59 in Fig. 8c and 26.58 in Fig. 8d. It can be observed that the profile from the ndiNLM algorithm is narrower than that from the NLM method, i.e., a better edge preservation can be obtained by the ndiNLM algorithm. Table TABLE III. lists the image quality metrics on the three ROIs indicated by the blue squares in Fig. 8b. It can be seen that the ndiNLM algorithm can reach a higher restoration accuracy than the NLM method as measured by the three metrics in the three ROIs.
Figure 10.
Horizontal profiles through a small strip as indicated by an arrow in Fig. 8b. The dotted line shows the profile from the low-dose image, the dashed line shows the profile from the restored image of the low-dose scan by the NLM algorithm, and the solid line shows the profile from the restored image of the low-dose scan by the ndiNLM algorithm.
TABLE III.
Image quality metrics on the three ROIs indicated by the blue squares in Fig. 8b.
| ROI1 | ROI2 | ROI3 | |||||||
|---|---|---|---|---|---|---|---|---|---|
| Methods | MPB | MPSE | MPAE | MPB | MPSE | MPAE | MPB | MPSE | MPAE |
| NLM | 5.07% | 1.63 | 1.28 | − 34.29% | 3.67 | 1.93 | − 45.84% | 2.01 | 1.56 |
| ndiNLM | − 3.98% | 1.54 | 1.22 | − 31.71% | 2.94 | 1.28 | − 29.45% | 1.92 | 1.49 |
| Low-dose scan | − 42.05% | 3.44 | 2.75 | − 36.05% | 3.56 | 2.80 | − 57.02% | 3.23 | 2.56 |
Brain perfusion CT image restoration
In this experiment, the normal-dose unenhanced brain CT image μnd was used to induce the low-dose enhanced brain CT image μld restoration. In order to reflect the intensity difference between the enhanced scan and the unenhanced scan images and also to achieve a more reasonable similarity between the two patches, we modified the optimal nonlocal weight construction as follows:
| (9) |
where is a normalizing factor, . The term C is a local enhancement factor used to account for local changes in intensity due to the contrast enhancement, which is defined as , E(·) being the expected value or mean of the intensity in the patch Vi. Based on the insensitivity of the ndiNLM algorithm to image registration, we assumed no large motion between the enhanced and unenhanced scans and, therefore, the EMP registration algorithm was not employed in this experiments.
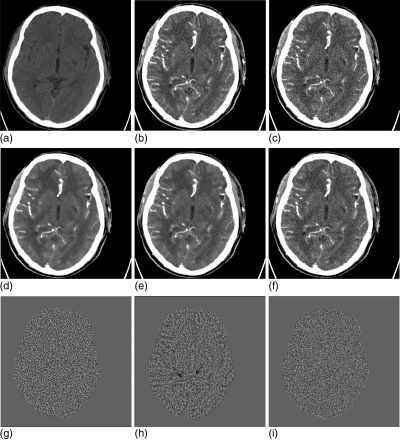
Figure 11 shows the experimental results from the brain perfusion CT imaging by using two different methods. Figure 11a is from the normal-dose unenhanced scan; Fig. 11b is from the normal-dose enhanced scan; Fig. 11c is the simulated low-dose enhanced image from the normal-dose scan (Fig. 11b); Fig. 11d is the restored image from the simulated low-dose enhanced scan by the NLM method with parameter τ = 4.6 × 10− 4; Fig. 11e is the restored image from the simulated low-dose enhanced scan using the NLM method with a different scalar parameter τ = 9.7 × 10− 4, which is visually better than Fig. 11d; and Fig. 11f is the restored image from the simulated low-dose enhanced scan by the ndiNLM algorithm with scalar parameter α = 4.6 × 10− 4. Both the NLM and ndiNLM algorithms achieved excellent restoration results. The gain by the ndiNLM algorithm in terms of noise suppression and edge preservation can be seen by comparing Fig. 11f with Fig. 11e, both of which were obtained using optimal scalar parameter values. The gain can be seen more easily in the difference images from the acquired normal-dose enhanced image of Fig. 11b. Figure 11g shows the difference image between Figs. 11b, 11c, which is set as the baseline. Fig. 11h is the difference image between Figs. 11b, 11c, showing the gain of the NLM algorithm. Figure 11i is the difference image between Figs. 11f, 11c, showing the gain of the ndiNLM algorithm. The skulls in the difference images were removed for display purposes. It can be seen that the difference image Fig. 11i, corresponding to the ndiNLM algorithm, is very similar to the baseline of Fig. 11g, indicating that the restoration by the presented ndiNLM algorithm has similar image texture as the normal-dose enhanced scan. However, the difference image Fig. 11h corresponding to the NLM method contains some enhanced structural information as indicated by the two blue arrows, indicating that some different image texture appeared in NLM restored image. In other words, the image restored by the ndiNLM algorithm has a noticeable gain in preserving the enhanced structures and, therefore, leads to improvement in extraction of the kinetic map information.
Figure 11.
Brain perfusion low-dose CT image restoration study. (a) The normal-dose unenhanced scan; (b) the normal-dose enhanced scan; (c) the simulated low-dose enhanced image (b); (d) the restored image from the simulated low-dose enhanced scan by the NLM algorithm (Ni = 17 × 17, Vi = 3 × 3, τ = 4.6 × 10− 4); (e) the restored image from the simulated low-dose enhanced scan by the NLM algorithm (Ni = 17 × 17, Vi = 3 × 3, τ = 9.4 × 10− 4); (f) the restored image from the simulated low-dose enhanced scan by the ndiNLM algorithm (, α = 4.6 × 10− 4); (g) the difference image between (b) and (c); (h) the difference image between (e) and (c); and (i) the difference image between (f) and (c). The skulls of the difference images were removed in displaying the cerebral tissue display. Display window option: width is 172 HU, level is 65 HU.
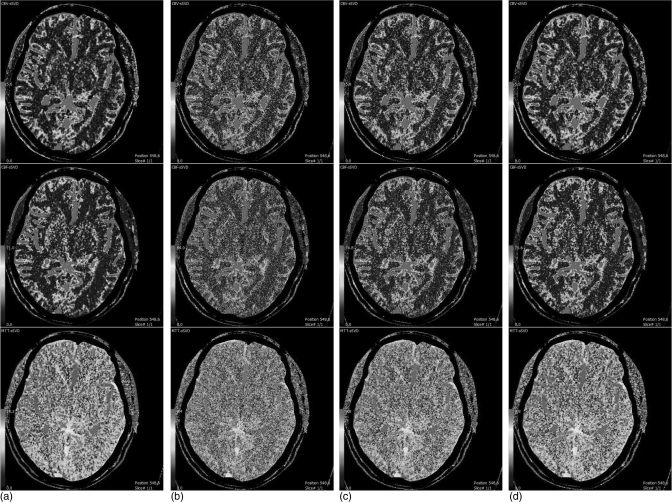
Figure 12 shows the CBV, CBF, and MTT maps generated from the difference cerebral perfusion CT image series. Figure 12a is from the acquired normal-dose enhanced images and Fig. 12b is from the simulated low-dose enhanced images, both of which are set as the baseline for comparison purposes. Figure 12c is from the image restored by the NLM method. Figure 12d is from the image restored by the ndiNLM method. It can be seen that the quality of CBV, CBF, and MTT maps from the restored images of the simulated low-dose enhanced scans by both the NLM and ndiNLM algorithms is comparable to that from the acquired normal-dose enhanced image, indicating the usefulness of NLM-based strategies for the clinical task of perfusion hemodynamics. The gain obtained by using the previous normal-dose scan via the ndiNLM algorithm is made more visible by the following analysis.
Figure 12.
CBV, CBF, and MTT maps generated from the different brain perfusion CT images. Column (a) from the acquired normal-dose enhanced images; column (b) from the simulated low-dose enhanced images; column (c) from the restored images of the simulated low-dose enhanced scans by the NLM algorithm (Ni = 17 × 17, Vi = 3 × 3, τ = 9.7 × 10− 4); and column (d) from the restored images of the simulated low-dose enhanced scan by the ndiNLM algorithm (, α = 4.6 × 10− 4). CBV, CBF, and MTT maps are displayed with same color lookup table, automatic color scale determination, and vascular pixel elimination, respectively.
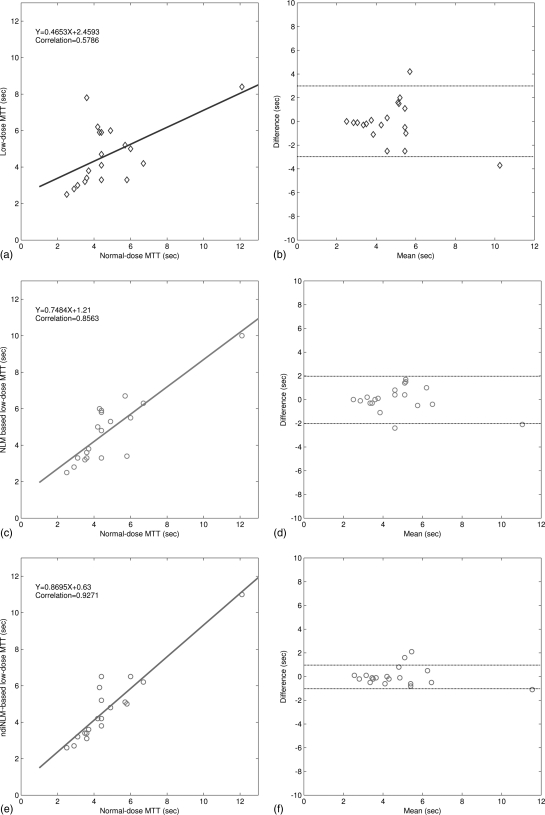
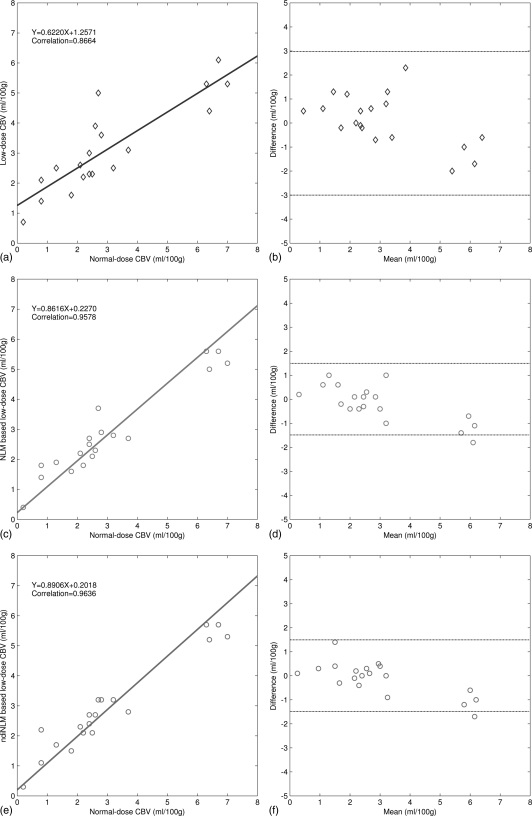
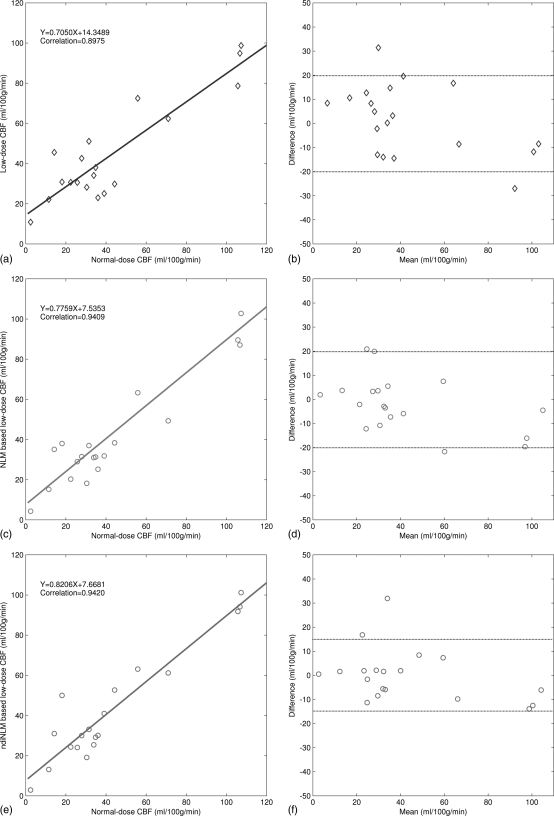
We first generated the color-coded maps of CBF, CBV, and MTT and then manually selected 19 specific ROI in the acquired normal-dose images and the simulated low-dose images, each covering a 5 × 5 square area. Without loss of generality, as shown in Fig. 11b, the ROI locations were chosen at the hemispheres in the grey matter, white matter, and basal ganglia where major blood vessel branches and suspected abnormal signals were excluded. Figure 13 illustrates the correlation coefficients, regression results, and the corresponding Bland–Altman plots of the MTT values in different conditions. As shown in the plots, the correlation coefficient (left column) from the ndiNLM algorithm is larger and difference in the ordinate axis on the Bland–Altman plot (right column) is smaller than that from the NLM method, while both the NLM and ndiNLM algorithms performed very well compared to the plots (a) and (b). Because the MTT tends to be very sensitive to the changes of the tube current and is very useful for the evaluation of the extent of the cerebral perfusion reserve impairment, we may make a conjecture that the ndiNLM algorithm outperforms the NLM algorithm in this perfusion study. Figures 1415 provide similar results for the CBV and CBF maps. These figures demonstrate that the presented ndiNLM method can achieve noticeable performance in low-dose brain perfusion imaging while maintaining the accuracy of quantitative CT measurements for evaluating regional cerebral function.
Figure 13.
The correlation (left column) and Bland–Altman plot (right column) between the MTT map pixel values computed from the normal-dose images and the restored low-dose images. Plots (a) and (b) represent the results obtained from the normal- and low-dose images and are set as the baseline for comparison purpose. Plots (c) and (d) represent the corresponding results obtained from the normal-dose images and the low-dose image restoration by the NLM algorithm. Plots (e) and (f) represent the corresponding results obtained from the normal-dose images and the low-dose image restoration by the ndiNLM algorithm.
Figure 14.
The correlation (left column) and Bland–Altman plot (right column) between the CBV map pixel values computed from the normal-dose images and the restored low-dose images. Plots (a) and (b) represent the results obtained from the normal- and low-dose images and are set as the baseline for comparison purpose. Plots (c) and (d) represent the corresponding results obtained from the normal-dose images and the low-dose image restoration by the NLM algorithm. Plots (e) and (f) represent the corresponding results obtained from the normal-dose images and the low-dose image restoration by the ndiNLM algorithm.
Figure 15.
The correlation (left column) and Bland–Altman plot (right column) between the CBF map pixel values computed from the normal-dose images and the restored low-dose images. Plots (a) and (b) represent the results obtained from the normal- and low-dose images and are set as the baseline for comparison purpose. Plots (c) and (d) represent the corresponding results obtained from the normal-dose images and the low-dose image restoration by the NLM algorithm. Plots (e) and (f) represent the corresponding results obtained from the normal-dose images and the low-dose image restoration by the ndiNLM algorithm.
DISCUSSION AND CONCLUSION
As with most denoising methods, the presented NLM-based strategies restore the intensity of each image voxel by averaging the intensities of its neighboring voxels. However, NLM strategies differ in that the averaging weight is based on the intensity similarity of the patches within the neighborhood of the concerned voxel and does not depend on the spatial proximity to the concerned voxel. Conceptually, the patches can be anywhere, and the averaging weights can be interpreted as a probability distribution with normalization to unity and is always positive. Obviously, optimizing the weights is crucial. Up to now, several NLM-based methods have been proposed, aiming at an optimal weight computation.29, 35, 36, 37, 38 In this paper, we adapted the NLM strategy for low-dose CT imaging.
In addition to the adaption, we further advanced the NLM framework to utilize the redundancy information in the previous normal-dose scans to optimize the weights construction and improve the NLM weighted average. The presented NLM framework, including both the NLM and ndiNLM algorithms, produces excellent results. The gain by the use of the previous normal-dose scans over the low-dose CT itself is noticeable. In many clinical studies, such as radiotherapy, tumor surveillance and perfusion imaging, repeated CT scans are often acquired. In these studies, the presented ndiNLM weights optimization may be useful in reducing the x-ray radiation dose after the first normal dose CT scan.
Due to the tissue deformation, the anatomy of the same patient may differ at two different scan periods. Thus, in order to make use of the previous CT images of the same patient, dedicated image registration techniques are needed,26, 39, 40 which is a very challenging task. However, this challenge may not be a major obstacle for the ndiNLM algorithm, because the algorithm does not heavily depend on the accuracy of the image registration. Figure 7 demonstrates that the ndiNLM algorithm performs very well for preservation of the edges and structural details in the presence of significant normal-dose image deformation. Certainly, an accurate registration between the normal-dose and the low-dose images can reduce the computational burden by allowing use of a smaller search-window and can further improve the image restoration.
Estimation of the parameter h for both the NLM and ndiNLM algorithms has taken both the size of the search-window and the standard deviation of the image noise into account. Figures 56 show the results of these two NLM based low-dose image restorations with different smoothing parameter values h. Both the NLM and ndiNLM algorithms produced excellent results for a wide range of parameter values. The ndiNLM algorithm is more robust than the NLM for preserving the spatial resolution and identifying the low-contrast structure because the standard deviation of the low-dose image is well estimated by the use of the image noise relationship between the low-dose scan and the normal-dose scan protocols.27, 28
A major drawback of the NLM method is its computational burden, especially in the 3D case. For the presented ndiNLM, the computation may be further complicated because a large search-window is needed to cover a wide region for the purpose of reducing the influence from imperfect image registration. Coupé et al.29 have presented several techniques to reduce the computational complexity for the NLM-based strategies including the optimal voxel selection in the search-window, blockwise implementation, and parallel computation. Because of the similarity in the weighted averages between the NLM and ndiNLM methods, the techniques proposed by Coupé et al. for the reduction of the computational burden can be adapted for the presented ndiNLM. This is a topic for future research.
As pointed out by a reviewer of this work, the presented ndiNLM algorithm may potentially suppress the small isolated dot structures. For example, observe that two small black dots located at the vertical center and horizontal right inside the grey near-circular region in Fig. 8b (i.e., the acquired low-dose CT scan). These two small black dots were preserved in the NLM restored image of Fig. 8c, while one of two dots is suppressed in the ndiNLM restored image of Fig. 8d. The suppression is due to the absence of the small dot in the normal-dose scan of Fig. 8a. Since the ndiNLM algorithm assumes the previous normal-dose scan as a priori known information and adds the information into the weighted average, a small dot presence in the low-dose scan but absence in the previous normal scan will likely be suppressed. In clinic, if a small dot in the low-dose CT scan reflects a true signal, then a measure for the signal shall be included in the ndiNLM weighted average. Thus, an advanced nonlocal weights construction by combining the currently scanned low-dose scan and the previously scanned normal-dose scan together should be explored in future research.
In this work, our aim was focused on the low-dose image restoration using a previously scanned normal-dose image. To test the presented ndiNLM algorithm, all the experiments were based on the same CT scanning protocol, except for the mAs parameter setting. In general, the ndiNLM algorithm utilizes a previously scanned normal-dose image as a reference, and this reference could be acquired by different CT scanning protocols, including variations in kVp, mAs, slice collimation, and reconstruction kernels. Optimizing the scanning protocol parameter settings (i.e., kVp, mAs, etc.) for the normal-dose and low-dose scans may further improve the ndiNLM image restoration, which will be another topic for future research.
ACKNOWLEDGMENTS
This work was supported by the 973 Program of China under Grant No. 2010CB732503, the National Natural Science Foundation of China under Grant Nos. 81000613 and 81101046, and the National Key Technology Research and Development Program of the Ministry of Science and Technology of China under Grant No. 2011BAI12B03. Z.L. and J.M. were partially supported by NIH Grant #CA143111 and #CA082402 of the National Cancer Institute of the United States. H.L. was supported by the National Nature Science Foundation of China under Grant No. 60772020. The authors would like to thank Dr. Baige Li for her discussions on this topic and providing the brain perfusion CT data. The authors would appreciate Professor Gene Gindi for editing this work. The authors are also grateful for constructive comments from the anonymous reviewers.
References
- Brenner D. J. and Hall E. J., “Computed tomography-an increasing source of radiation exposure,” N. Engl. J. Med. 357, 2277–2284 (2007). 10.1056/NEJMra072149 [DOI] [PubMed] [Google Scholar]
- Einstein A. J., Henzlova M. J., and Rajagopalan S., “Estimating risk of cancer associated with radiation exposure from 64-slice computed tomography coronary angiography,” JAMA 298, 317–323 (2007). 10.1001/jama.298.3.317 [DOI] [PubMed] [Google Scholar]
- Linton O. W. and Mettler F. A., “National conference on dose reduction in CT, with an emphasis on pediatric patients,” Am. J. Roentgenol. 181, 321–329 (2003), available at http://www.ncbi.nlm.nih.gov/pubmed/12876005. [DOI] [PubMed] [Google Scholar]
- Kopka L., Funke M., Breiter N., Hermann K. P., Vosshenrich R., and Grabbe E., “An anatomically adapted variation of the tube current in CT. Studies on radiation dosage reduction and image quality,” Rofo 163, 383–387 (1995), available at http://www.ncbi.nlm.nih.gov/pubmed/8527750. [DOI] [PubMed] [Google Scholar]
- Kalender W. A., Wolf H., Suess C., Gies M., Greess H., and Bautz W. A., “Dose reduction in CT by on-line tube current control: Principles and validation on phantoms and cadavers,” Eur. Radiol. 9, 323–328 (1999). 10.1007/s003300050674 [DOI] [PubMed] [Google Scholar]
- McCollough C. H., Bruesewitz M. R., and Kofler J. M., “CT dose reduction and dose management tools: Overview of available options,” Radiographics 26, 503–512 (2006). 10.1148/rg.262055138 [DOI] [PubMed] [Google Scholar]
- Kalra M. K., Maher M. M., Toth T. L., Hamberg L. M., Blake M. A., Shepard J. A., and Saini S., “Strategies for CT radiation dose optimization,” Radiology 230, 619–628 (2004). 10.1148/radiol.2303021726 [DOI] [PubMed] [Google Scholar]
- Yu L., “Radiation dose reduction in computed tomography: Techniques and future perspective,” Imaging Med. 1, 65–84 (2009). 10.2217/iim.09.5 [DOI] [PMC free article] [PubMed] [Google Scholar]
- Sukovic P. and Clinthorne N. H., “Penalized weighted least-squares image reconstruction for dual energy x-ray transmission tomography,” IEEE Trans. Med. Imaging 19, 1075–1081 (2000). 10.1109/42.896783 [DOI] [PubMed] [Google Scholar]
- Elbakri L. A. and Fessler J. A., “Efficient and accurate likelihood for iterative image reconstruction in x-ray computed tomography,” Proc. SPIE 5032, 1839–1850 (2003). 10.1117/12.480302 [DOI] [Google Scholar]
- Wang J., Li T., and Xing L., “Iterative image reconstruction for CBCT using edge-preserving prior,” Med. Phys. 36, 252–260 (2009). 10.1118/1.3036112 [DOI] [PMC free article] [PubMed] [Google Scholar]
- Li T., Li X., Wang J., Wen J., Lu H., Hsieh J., and Liang Z., “ Nonlinear sinogram smoothing for low-dose x-ray CT,” IEEE Trans. Nucl. Sci. 51, 2505–2513 (2004). 10.1109/TNS.2004.834824 [DOI] [Google Scholar]
- La Riviere P. J., Bian J., and Vargas P. A., “Penalized-likelihood sinogram restoration for computed tomography,” IEEE Trans. Med. Imaging 25, 1022–1036 (2006). 10.1109/TMI.2006.875429 [DOI] [PubMed] [Google Scholar]
- Wang J., Li T., Lu H., and Liang Z., “Penalized weighted least-squares approach to sinogram noise reduction and image reconstruction for low-dose x-ray computed tomography,” IEEE Trans. Med. Imaging 25, 1272–1283 (2006). 10.1109/TMI.2006.882141 [DOI] [PMC free article] [PubMed] [Google Scholar]
- Wang J., Li T., Liang Z., and Xing L., “Dose reduction for kilovoltage cone-beam computed tomography in radiation therapy,” Phys. Med. Biol. 53, 2897–2909 (2008). 10.1088/0031-9155/53/11/009 [DOI] [PubMed] [Google Scholar]
- Hsieh J., “Adaptive streak artifact reduction in computed tomography resulting from excessive x-ray photon noise,” Med. Phys. 25, 2139–2147 (1998). 10.1118/1.598410 [DOI] [PubMed] [Google Scholar]
- Kachelriess M., Watzke O., and Kalender W. A., “Generalized multi-dimensional adaptive filtering for conventional and spiral single-slice, multi-slice, and cone-beam CT,” Med. Phys. 28, 475–490 (2001). 10.1118/1.1358303 [DOI] [PubMed] [Google Scholar]
- Lu H., Li X., Li L., Chen D., Xing Y., Hsieh J., and Liang Z., “Adaptive noise reduction toward low-dose computed tomography,” Proc. SPIE 5030, 759–766 (2003). 10.1117/12.480374 [DOI] [Google Scholar]
- Manduca A., Yu L., Trzasko J. D., Khaylova N., Kofler J. M., McCollough C. M., and Fletcher J. G., “Projection space denoising with bilateral filtering and CT noise modeling for dose reduction in CT,” Med. Phys. 36, 4911–4919 (2009). 10.1118/1.3232004 [DOI] [PMC free article] [PubMed] [Google Scholar]
- Schaap M., Schilham A. M., Zuiderveld K. J., Prokop M., Vonken E. J., and Niessen W. J., “Fast noise reduction in computed tomography for improved 3-D visualization,” IEEE Trans. Med. Imaging 27, 1120–1129 (2008). 10.1109/TMI.2008.918322 [DOI] [PubMed] [Google Scholar]
- Borsdorf A., Raupach R., Flohr T., and Hornegger J., “Wavelet based noise reduction in CT-images using correlation analysis,” IEEE Trans. Med. Imaging 27, 1685–1703 (2008). 10.1109/TMI.2008.923983 [DOI] [PubMed] [Google Scholar]
- Yu H., Zhao S., Hoffman E. A., and Wang G., “Ultra-low dose lung CT perfusion regularized by a previous scan,” Acad. Radiol. 16, 363–373 (2009). 10.1016/j.acra.2008.09.003 [DOI] [PMC free article] [PubMed] [Google Scholar]
- Buades A., Coll B., and Morel M. J., “A review of image denoising algorithms, with a new one,” Multiscale Model. Simul. 4, 490–530 (2005). 10.1137/040616024 [DOI] [Google Scholar]
- Buades A., Coll B., and Morel M. J., “A non-local algorithm for image denoising,” in Proceedings of the Conference Record (IEEE Computer Society Conference on Computer Vision and Pattern Recognition), (San Diego, CA, 2005), pp. 60–65.
- Buades A., Coll B., and Morel M. J., “Nonlocal image and movie denoising,” Int. J. Comput. Vis. 76, 123–139 (2008). 10.1007/s11263-007-0052-1 [DOI] [Google Scholar]
- Lu Z., Feng Q., Shi P., and Chen W., “A fast 3-D medical image registration algorithm based on equivalent meridian plane,” in Proceedings of the Conference Record (IEEE International Conference on Image Processing), (San Antonio, TX, 2007), pp. 357–360.
- Hsieh J., Computed Tomography Principle, Design, Artifacts and Recent Advances (SPIE, Bellingham, WA, 2003). [Google Scholar]
- Buzug T. M., Computed Tomography: From Photon Statistics to Modern Cone-Beam CT (Springer-Verlag, Berlin/Heidelberg, 2008). [Google Scholar]
- Coupé P., Yger P., Prima S., Hellier P., Kervrann C., and Barillot C., “An optimized blockwise nonlocal means denoising filter for 3-D magnetic resonance images,” IEEE Trans. Med. Imaging 27, 425–441 (2008). 10.1109/TMI.2007.906087 [DOI] [PMC free article] [PubMed] [Google Scholar]
- Donoho D. L. and Johnstone I. M., “Ideal spatial adaptation via wavelet shrinkage,” Biometrika 81, 425–455 (1994). 10.1093/biomet/81.3.425 [DOI] [Google Scholar]
- See http://www.imp.uni-erlangen.de/phantoms/noise/noise_sim.htm for “simulation of noise”.
- Kudo K., Sasaki M., Yamada K., Momoshima S., Utsunomiya H., Shirato H., and Ogasawara K., “Differences in CT perfusion maps generated by different commercial software: quantitative analysis by using identical source data of acute stroke patients”, Radiology 254, 200–209 (2010). 10.1148/radiol.254082000 [DOI] [PubMed] [Google Scholar]
- Kudo K., Perfusion Mismatch Analyzer, version 3.0.0.0, available at ASIST-Japan web site, http://asist.umin.jp/index-e.htm (published November 2006, updated February 2009, last accessed February 20, 2009).
- See http://asist.umin.jp/index-e.htm for ASIST-Japan, (published June 2005, updated March 2009, last accessed June 9, 2009).
- Mahmoudi M. and Sapiro G., “Fast image and video denoising via nonlocal means of similar neighborhoods,” IEEE Signal Process. Lett. 12, 839–842 (2005). 10.1109/LSP.2005.859509 [DOI] [Google Scholar]
- Kelm Z. S., Blezek D., Bartholmai B., and Erickson B. J., “Optimizing non-local means for denoising low dose CT,” in Proceedings of the Conference Record (IEEE International Symposium on Biomedical Imaging: From Nano to Macro), (San Antonio, TX, 2007), pp. 662–665.
- Protter M., Elad M., Takeda H., and Milanfar P., “ Generalizing the nonlocal-means to super-resolution reconstruction,” IEEE Trans. Image Process. 18, 36–51 (2009). 10.1109/TIP.2008.2008067 [DOI] [PubMed] [Google Scholar]
- Gal Y., Mehnert A. J., Bradley A. P., McMahon K., Kennedy D., and Crozier S., “Denoising of dynamic contrast-enhanced MR images using dynamic nonlocal means,” IEEE Trans. Med. Imaging 29, 302–310 (2010). 10.1109/TMI.2009.2026575 [DOI] [PubMed] [Google Scholar]
- Maintz J. B. and Viergever M. A., “A survey of medical image registration,” Med. Image. Anal. 2, 1–36 (1998). 10.1016/S1361-8415(01)80026-8 [DOI] [PubMed] [Google Scholar]
- Schreibmann E., Thorndyke B., Li T., Wang J., and Xing L., “Four-dimensional image registration for image-guided radiotherapy,” Int. J. Radiat. Oncol., Biol., Phys. 71, 578–586 (2008). 10.1016/j.ijrobp.2008.01.042 [DOI] [PubMed] [Google Scholar]


