Abstract
Purpose: The purpose of this work was to clarify the interactions between the parameters used in the γ index with the surface-based distance method, which itself can be viewed as a generalized version of the γ index. The examined parameters included the distance to agreement (DTA)/dose difference (DD) criteria, the percentage used as a passing criterion, and the passing percentage for given DTA/DD criteria. The specific aims of our work were (1) to understand the relationships between the parameters used in the γ index, (2) to determine the detection limit, or the minimum detectable error, of the γ index with a given set of parameters, and (3) to establish a procedure to determine parameters that are consistent with the capacity of an IMRT QA system.
Methods: The surface-based distance technique with dose gradient factor was derived, and then the relationship between surface-based distance and γ index was established. The dose gradient factor for plans and measurements of 10 IMRT patients, 10 spine stereotactic radiosurgery (SRS) patients, and 3 Radiological Physics Center (RPC) head and neck phantom were calculated and evaluated. The detection limits of the surface-based distance and γ index methods were examined by introducing known shifts to the 10 IMRT plans.
Results: The means of the dose gradient factors were 0.434 mm/% and 0.956 mm/% for the SRS and IMRT plans, respectively. Key quantities (including the mean and 90th and 99th percentiles of the distance distribution) of the surface-based distance distribution between two dose distributions were linearly proportional to the actual shifts. However, the passing percentage of the γ index for a given set of DTA/DD criteria was not associated with the actual shift. For IMRT, using the standard quality assurance criteria of 3 mm/3% DTA/DD and a 90% passing rate, we found that the detection limit of the γ index in terms of global shift was 4.07 mm/4.07 % without noise.
Conclusions: Surface-based distance is a direct measure of the difference between two dose distributions and can be used to evaluate or determine parameters for use in calculating the γ index. The dose gradient factor represents the weighting between spatial and dose shift and should be determined before DTA/DD criteria are set. The authors also present a procedure to determine γ index parameters from measurements.
Keywords: γ index, surface-based distance, IMRT QA, DTA, DD
INTRODUCTION
With the introduction of advanced radiation therapy techniques such as volumetric modulated arc therapy (VMAT) and intensity-modulated radiation therapy (IMRT), the three-dimensional (3D) dose distribution for radiation therapy has become both more conformal and more complex. These features pose a great challenge for the quality assurance (QA) of the dose distribution, which commonly consists of both point dose and 2D plane dose measurements,1 and an urgent need for 3D dosimetry has also been stated.2 Various techniques have been developed to compare measured dose distributions with those generated by the treatment planning system. The γ index technique,3, 4 which is the standard method for planar dose verification in IMRT QA,5, 6 calculates the quantity γ for each point of interest using preselected dose difference (DD) and distance to agreement (DTA) criteria and then uses the γ value to determine the outcome (pass–fail) of the IMRT QA. The same preselected DD and DTA criteria are also seen in other dose comparison techniques, such as the NAT7 or the δ envelope.8 Moreover, it has become general practice to use the passing percentage of γ (the percentage of γ values ≤ 1 for a set of DTA/DD criteria) to determine whether two dose distributions agree.
However, the selection of DD and DTA criteria and the cut-off percentage (the passing rate criterion) seem to be inconsistent with one another and neither seems to reflect the capacity or quality of the IMRT QA measurements. For example, in some recent studies for which the γ index was used,5, 9, 10, 11, 12 DTA/DD criteria varied from 1 mm/2% for identification of robust beams to 4 mm/7% for Radiological Physics Center (RPC) head and neck (H&N) phantom studies. A survey on planar IMRT QA analysis published in 2007 showed that more than 60% of all responding institutions (total n = 139) had not yet set standards for breast or SBRT IMRT, and that 3% DD and 3 mm DTA dominate as pass/fail criteria; nevertheless, the authors pointed out, “no study qualifies (or disqualifies) these criteria as an apt ‘gold standard’ for planar dose to phantom IMRT QA.”13 Furthermore, the DTA and DD parameters and passing criteria have varied widely between multi-institutional studies in which the γ index was used for IMRT plan evaluation, making it difficult to determine which parameters and criteria are most appropriate.1, 11, 14, 15, 16 Specifically, in the European Society for Radiotherapy and Oncology (ESTRO), study14 the DTA/DD parameters were 3 mm/4%, and the median and 95th percentile of the γ index distribution were examined for their suitability as passing criteria; for the AAPM TG-119 study,1 the DTA/DD parameters were 3 mm/3%, a 90% passing percentage was used as the passing criterion, and the confidence interval (CI) of the passing percentage was also used to analyze the data; and for the RPC phantom studies,11, 15, 16 DTA/DD parameters of 4 mm/7% (selected on the basis of pilot studies) and a passing percentage as low as 85%16 were used as passing criteria.
In the ESTRO and AAPM TG-119 studies, the DTA/DD parameters were predetermined, and the studies were designed to validate these parameters. In the ESTRO study,14 the data clearly indicated that 3 mm/4% were not adequate if the 95th percentile of the γ distribution (γ95) was to be used as the passing criterion, although this conclusion was not noted by the authors. Table IV of the report14 showed γ95 > 1 for 20 of 45 (44%) of PTV slices. Using the data from that study, the upper bound of the 90% CI for γ95 can be calculated as 1.39. Therefore, to ensure the 95% of all films had γ95 ≤ 1, DTA/DD criteria of 3 mm/4% × 1.39 = 4.17 mm/5.56% should have been used instead of 3 mm/4%. In Table XI of the AAPM TG-119 report,1 a significant separation between the C-shape target and other targets in terms of mean passing percentage and standard deviation can be observed, which indicates the necessity of application specific criteria.
In contrast to the wide use of the γ index, there has been, to our knowledge, no discussion of or theories tested for the generation or selection of DD and DTA criteria, and these criteria remain empirically determined; likewise, no studies of the validity and generality of the γ index with respect to any given DD or DTA criteria have been conducted. Consequently, the aims of this work were (1) to understand the parameters used in the γ index namely, the DTA/DD criteria, the passing percentage used as a passing criterion, and the passing percentages for given DTA/DD criteria; (2) to determine the detection limit, or the minimum detectable error, of the γ index with a given set of parameters; and (3) to establish a procedure to determine the proper parameters for an IMRT QA system.
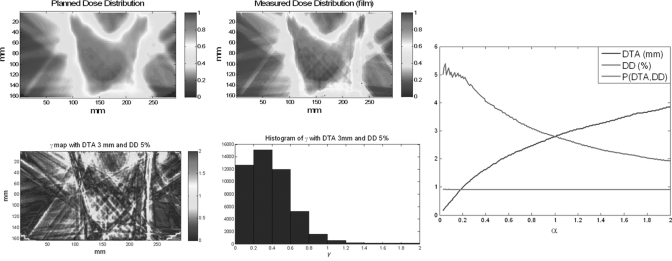
Figure 1 demonstrates the problem of parameter selection for the γ index. Figure 1 shows two planar dose distributions from the treatment planning system [Fig. 1a] and from film measurement [Fig. 1b]; Figs. 1c, 1d show the γ map and histogram, respectively, for DTA/DD parameters of 3 mm/5%, and the passing percentage for this pair of criteria [P(DTA, DD)] is 97.52%. Figure 1e shows the passing percentage with different DD and DTA criteria using the γ index method [P(DTA, DD)] to compare the two dose distributions; the x-axis α is the ratio between DTA and DD. With any combination of DTA and DD criteria on or (because the passing percentage increases with more permissive DTA/DD criteria) above the DTA/DD curve, the passing percentages are all above 90%. Even though multiple sets of criteria could be used, it is unclear how to select a proper criterion for computation of the γ map.
Figure 1.
Example of the γ index and parameter selection of the γ index. (a) Planned planar dose distribution, (b) measured planar dose distribution, (c) γ map with 3 mm/5% criteria, (d) histogram of the γ map, and (e) DTA/DD criteria satisfying P(DTA, DD) ≥90%.
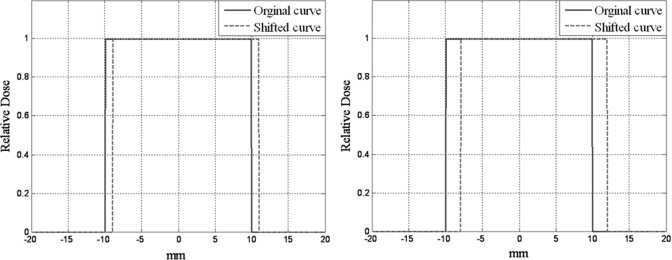
Figure 2 shows the limitation of error detection for a particular combination of DTA/DD and a set passing rate, i.e. 90%. In these figures, the blue curves are the original curves (a 2-cm-wide step function) and the green curves are shifted by 1 mm [Fig. 2a] and 2 mm [Fig. 2b]. In this simple 1D example, if the γ index with a 1-mm DTA criterion, excluding all the zero pixels, were used to test the shifted curves, the passing percentage for the first shifted curve [1-mm shift, Fig. 2a] would be 100% because all of the pixels from the shifted curve could find a corresponding pixel within 1 mm of the DTA in the original curve. The passing percentage for the second shifted curve [2 mm shift, Fig. 2b] would be 90% because only pixels more than 1 mm away from each side of the curve could not find a corresponding pixel within 1 mm on the original curve and hence have a γ value > 1. Therefore, the 1-mm DTA and 90% passing rate criteria failed to detect the 2-mm error in Fig. 2b. The detection limit, or the minimum detectable error, for the γ index with a predetermined set of criteria remains unknown.
Figure 2.
Dose shifting and γ index passing rate. (a) A 2-cm strip curve shifted 1 mm and (b) a 2-cm strip shifted 2 mm.
To address these gaps in current knowledge, we studied a set of clinically relevant dose distributions in plans for and applications of IMRT, stereotactic radiosurgery (SRS), and RPC H&N phantom treatments plans and measurements. Because the γ index is the renormalized distance between two dose distributions3 and the DTA/DD criteria used for normalization are in question, we first derived the surface-based distance between two dose distributions without renormalization to establish a metric for direct comparison between two dose distributions and quantitative study. We established the relationship between DTA and DD criteria was established using the dose gradient factor, or the reciprocal of the mean dose gradient. The surface-based distance method was developed independent of the γ index,17, 18 and the relationship between these methods will be discussed. Simulation with 10 IMRT plans was then used to quantitatively evaluate the performance of the surface-based distance and γ index.
METHODS AND MATERIALS
Surface-based dose comparison
For two surfaces (Sx) in 3D space that are described by and , the distance d from any point on the surface S1(x1, y1) to the other surface S2 is defined as the Euclidean distance from S1(x1, y1) to the closest point on S2, as shown by the following equation:
| (1) |
We can further generalize the distance concept to the 3D dose distribution because a dose distribution can also be viewed as a surface. For two 3D dose distributions D1 and D2 (normalized doses are always used unless otherwise specified), the distance d from a point on D1 (with point dose D1(x1, y1, z1)) to D2 is:
| (2) |
or
| (3) |
where α is the dose gradient factor, which is a function of spatial coordinates, x, y, and z and is defined as
| (4) |
If the variation of α is small in the volume of interest, Eq. 4 can be approximated by a constant of the following form:
| (5) |
The distance between two dose distributions or dose surfaces is a pixel-based direct measurement of the difference between two dose surfaces that requires no predefined parameters; furthermore, because this distance is a well-defined physical quantity, it can be used as a metric to evaluate the performance of the γ index once the distance’s relationship to the γ index and a baseline evaluation system are established.
Relationship between surface-based distance and the γ index
The γ index is a composite quantity of DD and DTA used to compare dose distributions and is defined as follows:4
| (6) |
where
| (7) |
| (8) |
| (9) |
and the passing criterion is . In Eq. 7, is the DTA measurement and is the DD measurement. Thus, Eq. 6 can be rewritten in this form:
| (10) |
By comparing Eqs. 3, 10, we obtain
| (11) |
| (12) |
Any pixels that satisfy the passing criterion always satisfy , which means the distance from this point to the other dose surface is always less than the DTA criterion of the γ index method.
As shown in Eq. 10, the calculation of γ index minimizes a quadratic cost function with weighting between spatial distance and dose difference implied by the ratio between the DTA and DD criteria, that is, the dose gradient factor α. The surface-based distance can therefore be viewed as the generalized form of the γ index, and they are interchangeable if α is a constant, as shown in Eq. 5. With α constant, several observations arise from Eqs. 3, 10: (1) once the DTA and DD criteria ( and , respectively) are set, the map of the distance distribution with is identical to the γ map except for a scaling factor of ; (2) the γ maps obtained using different DTA and DD criteria that share the same (e.g., 3 mm/3%, 2 mm/2%, and 1 mm/1%) are identical except for a scaling factor of ; and (3) the IMRT QA passing criterion statement “at least 90% of pixels should have for a given set of DTA/DD criteria ( and )” is equivalent to “the 90th percentile of the distance distribution with .” Because of these properties, only the constant form of the dose gradient factor was used in this study.
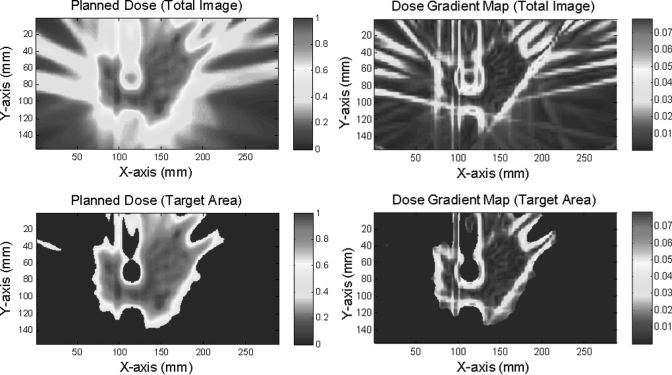
For dose comparison or verification purposes, only the dose gradient in the target area is relevant (the highest dose gradient is likely to occur when an organ at risk is adjacent or very close to the target), and the dose gradient outside of the target is likely to be very small, as shown in Fig. 3b. Also, the mean dose gradient could be different for different applications because of the need for dose fall-off to conform to the target and protect the organ at risk. In this study, we derived the dose gradient factor for 10 IMRT plans, 10 spine SRS plans, and 3 plans for the RPC H&N phantom and analyzed the statistics of the dose gradient factors for these different applications.
Figure 3.
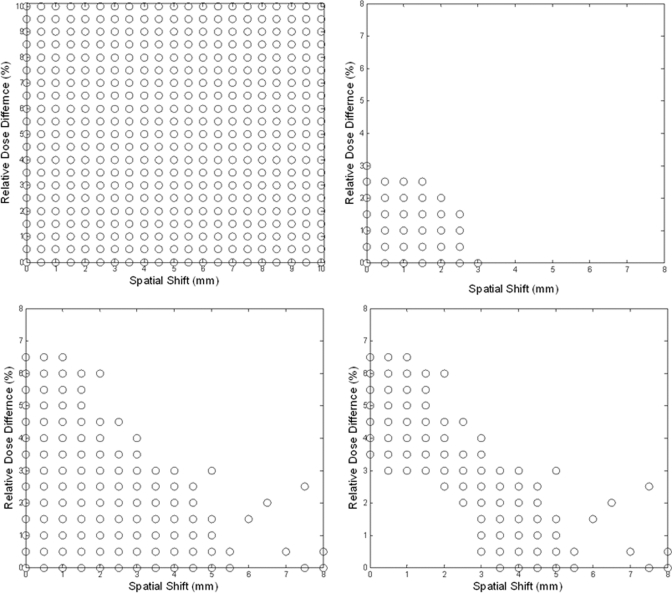
Surface-based dose verification simulation. (a) Shifts on spatial and dose axes (each circle represents a shifted plan), overlay of all 10 plans, showing (b) shifts that satisfy d0 ≤ 3 mm, (c) shifts that satisfy P(3 mm, 3%) ≥ 90%, and (d) shifts that satisfy P(3 mm, 3%) ≥ 90 and d0 > 3 mm, overlay of all 10 plans.
Materials
Although the surface-based distance method was developed for 3D, all dose distributions presented in this article were 2D planar dose distributions for two reasons. First, 3D measurements were not available. Second, 2D measurement (by means of film or detector arrays) is still mainstream for IMRT QA, so it was more clinically relevant to evaluate the technique in 2D before performing 3D evaluations.
The following 2D form of the surface-based distance definition was used in all measurements and simulations:
| (13) |
| (14) |
The k-d tree,19 which is a data structure based on a recursive subdivision of a k-dimension universe into subspaces by disjointed regions, was used to calculate both surface-based distance and γ index.18, 20 By defining the distance between pixels, one can locate the nearest neighbor for each pixel quickly in the tree structure. It should be noted that image resolution can affect the performance of both surface-based distance and the γ index, as discussed in various studies;3, 6 the effect can be even greater with the k-d tree method because it searches through the tree without interpolating values between neighboring pixels.21
Ten regular IMRT and 10 spine SRS plans were randomly selected from among those of patients who underwent radiation therapy between December 2009 and May 2010 at The University of Texas MD Anderson Cancer Center. After the treatment plans were approved, we applied the treatment fields to an I’mRT QA phantom (IBA Dosimetry, Schwarzenbruck, Germany). Axial plane dose distributions were exported from the treatment planning system [Pinnacle 8.0 m, Philips Medical Systems, Fitchburg, WI]. For IMRT and SRS simulations, we measured dose with ion chambers and on radiographic film and then compared the planned dose distribution with the planar dose distribution. All composite film measurements passed the requirement that 90% of all pixels have with 3 mm/5% criteria. In addition, we compared planned and actual dose distributions in three plans generated in compliance with RPC recommendations for the RPC H&N phantom.15, 22 Three repeated TLD and film measurements were made for each of the three plans according to RPC recommendations. All studies presented used the same 20 (10 IMRT and 10 SRS) planned and measured planar dose distributions from the clinic and the same 3 planned and 9 measured axial dose distributions from RPC film validation, all with 1 mm resolution.
Summary of analysis
Dose gradient factors for all planar dose distributions, both planned and measured, were calculated. The means and standard deviations of the dose gradient factors for the IMRT, SRS, and RPC H&N phantom plans and measurements were then calculated. The mean value of the dose gradient factor was used to calculate the surface-based distance in subsequent simulations.
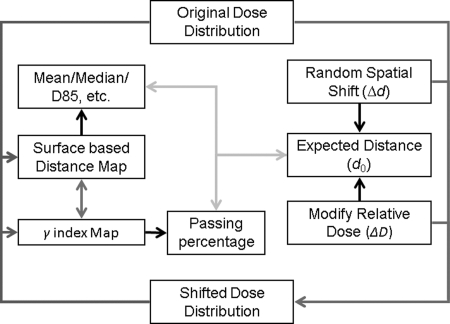
Figure 4 shows the simulation process for the patient plans. Spatial shifts (Δd = 0–10 mm in 0.5 mm increments) and dose shifts (ΔD = 0%–10% in 0.5% increments), as shown in Fig. 3a (only samples up to 10 mm were shown), were applied to the 10 IMRT planned planar dose distributions. Global shifts were applied because the shifts were well controlled. Among errors of the same magnitude, global shifts are the worst errors possible in terms of their effects on the dose distribution but the easiest errors to detect. Therefore, global shifts are well suited for worst-case/best-case scenario analyses. The surface-based distance distributions between the original plan and shifted plans were then calculated. For each original dose distribution, 440 shifted dose distributions were generated, and for each shifted dose distribution, the mean and median distances were calculated, as well as the 85th (D85), 90th (D90), 95th (D95), and 99th (D99) percentiles of dose distribution. As discussed in II.C, these quantities differed from their counterparts in the γ map (γ85, γ90, γ95, and γ99) by a constant value only, when . The Pearson correlations between expected distance (, maximum of 14.1 mm) and each of these quantities were calculated, and the linearity of the relationships between expected distance and these quantities was established by linear regression analysis. It should be noted that the positions of both 2D planes are assumed to be known exactly in simulations, but the same is not true for IMRT QA measurements.
Figure 4.
Surface-based dose verification simulation.
The γ index maps between the original and shifted dose distributions were generated using the 3 mm/3% criteria, and the passing percentages were analyzed with respect to the expected distance d0. The data analysis process was repeated with 2% and 5% Gaussian distributed noise.
RESULTS
Dose gradient factor
An example of the process for calculating the dose gradient factor for a planned dose distribution is shown in Fig. 5. Figure 5a shows a planar planned distribution for a spine SRS plan, and Fig. 5b shows the dose gradient map. High- and low-dose-gradient streaks or bands can be observed in the low-dose or nontarget region, which was not relevant to our purpose. Therefore nontarget or low-dose regions were excluded with simple thresholding at 50% of the maximum dose, as shown in Figs. 5c, 5d.
Figure 5.
Example of dose gradient map and generation of dose gradient factor. (a) Planned planar dose distribution for a patient who underwent spine SRS, (b) dose gradient map calculated for the whole image, (c) target area determined by thresholding at 50%, and (d) dose gradient map for the target area.
The reciprocal of the mean absolute dose gradient in the target area (thresholding at 50%) is the dose gradient factor. Dose gradient factors for IMRT, spine SRS, and RPC H&N phantom plans and axial planar film measurements are listed in Table TABLE I.. The dose gradients in the measurements were always higher than those in the plans, as can be observed in Table TABLE I., a phenomenon that may be caused by measurement noise. The mean dose gradient factors for IMRT plans and measurements were 0.956 mm/% and 0.827 mm/%, respectively. These results are close to the implied dose gradient factor of 1 mm/% from the widely accepted 3 mm/3% criteria [Eq. 12]. Similarly, for the RPC phantom plans and measurements, the mean dose gradient factors were 0.618 mm/% and 0.504 mm/%, respectively, which are consistent with the 4 mm/7% criteria set by RPC (implied dose gradient factor = 0.571 mm/%). For spine SRS patients, in whom sharp dose fall-off is required to protect the spinal cord, the mean dose gradient factors for plans and measurements were 0.434 and 0.337 mm/%, respectively. It can be clearly seen that the dose gradient factor was significantly different for different applications. Because IMRT plans were used in the next simulation, a dose gradient factor of 1 mm/% was used to calculate the surface-based distance, and the 3 mm/3% criteria were used for the γ index calculation in the simulation.
TABLE I.
Dose gradient factors for IMRT, spine SRS, and RPC H&N phantom plans and axial planar film measurements.
| Planned values | Measured values | |||||
|---|---|---|---|---|---|---|
| Application | Mean dose gradient factor | Standard deviation | Range | Mean dose gradient factor | Standard deviation | Range |
| IMRT (10 plans, 10 measurements) | 0.956 | 0.350 | [0.567, 1.690] | 0.827 | 0.354 | [0.504, 1.534] |
| SpineSRS (10 plans, 10 measurements) | 0.434 | 0.080 | [0.330, 0.565] | 0.337 | 0.083 | [0.249, 0.485] |
| RPC H&N phantom (3 plans, 9 measurements) | 0.618 | 0.096 | [0.542, 0.747] | 0.504 | 0.042 | [0.418, 0.528] |
Surface-based distance
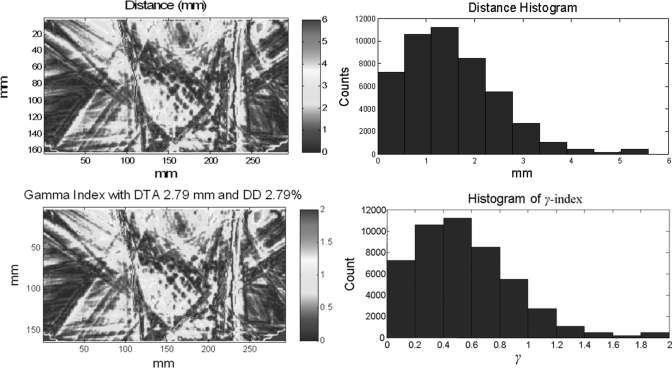
For surface-based distance and γ index calculations, only pixels with >10% maximum dose were included.1 Figure 6 shows an example of surface-based distance and its relationship to the γ index. These results were from planned and measured dose distributions, as shown in Figs. 1a, 1b, respectively. Figure 6a shows the distance map between the two dose distributions with a dose gradient factor of 1 mm/%, and Fig. 6b shows a histogram of the distance distribution, which interestingly, can be modeled with a γ distribution.23 The D90 was 2.79 mm for this case. Figure 6c shows the γ map with 2.79 mm/2.79% criteria. As predicted by Eq. 11, the mapped values in Figs. 6a, 6c differ only by a constant scaling factor. Figure 6d shows the histogram of the γ map obtained with the revised criteria; in this example, the passing percentage for γ < 1 was 90% [P(2.79 mm, 2.79%) = 90%].
Figure 6.
Examples of surface-based distance between two dose distributions and γ index in one IMRT patient plan. (a) Surface-based distance map between dose distributions shown in Figs. 1a, 1b, (b) histogram of surface-based distance distribution in (a), (c) a γ map with 2.79 mm/2.79% criteria, and (d) a histogram of the γ map in (c).
Simulation for IMRT planar dose distribution
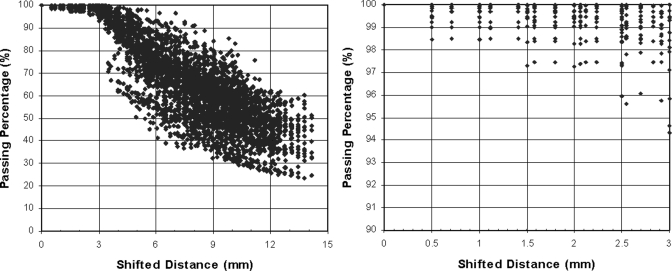
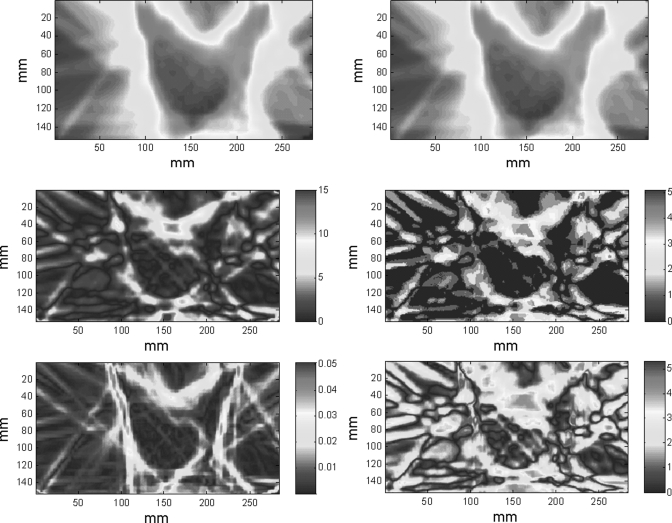
For each of the 10 IMRT planar dose distributions, 440 shifted dose distributions were generated by using combinations of spatial (range, 0–10 mm with a 0.5 mm increment) and dose (range, 0%–10% with a 0.5% increment) shifts, as shown in Fig. 3a. The γ maps of IMRT planar dose distributions with 3 mm/3% criteria were generated between each of the shifted dose distributions, both with and without noise, and the original dose distribution; the passing percentage (percentage of pixels with γ < 1) in relation to the expected distance with = 1 mm/% is plotted in Fig. 7a. A saturated region [Fig. 7b] occurred in which the change in passing percentage was small with shifts of up to 3 mm, after which the passing percentage decreased markedly with increasing distance. Fig. 3b shows the shifts that satisfy d0 ≤ 3 mm, Fig. 3c shows the shifts that satisfy P(3 mm, 3%) ≥ 90% (which is equivalent to D90 ≤ 3 mm), and Fig. 3d shows the shifts that satisfy P(3 mm, 3%) ≥ 90% and d0 > 3 mm (an overlay of 10 cases). There were 678 shifted distributions that satisfied P(3 mm, 3%) ≥ 90%, or “passed” the IMRT QA, but 328 (48%) of them had shifts (d0) > 3 mm. Figure 8 shows an example of the limitations of using passing percentage for IMRT QA. Figure 8a shows the original dose distribution, which is identical to that in Fig. 1a. Figure 8b is the dose distribution with a 4.5 mm spatial shift. Figures 8c, 8d show the absolute DD and DTA, respectively. Figure 8e shows the gradient map of the dose distribution, and Fig. 8f shows the surface-based distance between the original and shifted dose distributions. For this example (spatial shift of 4.5 mm), the D90 was 3 mm and the passing percentage (percentage of pixels with γ < 1) for the 3 mm/3% criteria was 90.01%. This result also indicates that the passing percentage may not reflect the difference between two dose distributions and therefore should not be used for quantitative analysis.
Figure 7.
Scatter plots of passing percentage versus d0 for shifts of (a) 0 to 14.1 mm and the subset of shifts of (b) 0 to 3 mm, for shifted IMRT dose distributions.
Figure 8.
Example showing the limitations of using passing percentage as the passing criterion. (a) Original planar dose distribution for an IMRT plan, (b) dose distribution after a 4.5 mm spatial shift, (c) absolute dose difference between (a) and (b), in percentage, (d) DTA between (a) and (b), in millimeter, (e) dose gradient map of (a), and (f) surface-based distance between (a) and (b) with α = 1 mm/%. The passing rate of this example (4.5 mm shift) with DTA/DD criteria of 3 mm and 3% is 90%.
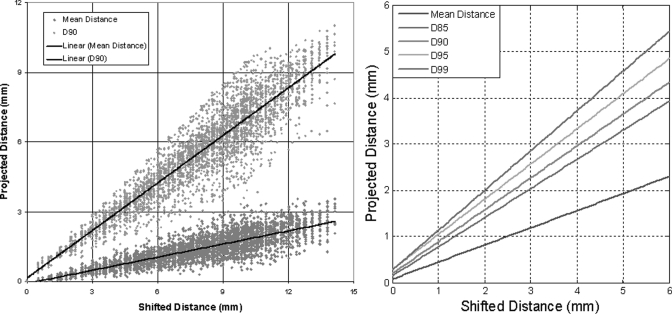
The distance maps between each shifted dose distribution and the original dose distributions were then generated. The mean and median distance, and D85, D90, D95, and D99 values of each distance map were calculated. Figure 9a plots the mean distance and D90 versus the projected (expected) distance for all shifted dose distributions. Linear regression, as shown in Fig. 9a for D90 and mean distance, was performed for the mean distance, D85, D90, D95, and D99, and the results are shown in both Fig. 9b and Table TABLE II.. The same procedure was repeated with 2% and 5% Gaussian noise added to the shifted dose distribution, and the results of the linear regression analysis and the R2 of the fit are also listed in Table TABLE II..
Figure 9.
(a) Scatter maps of shifts in mean distance and D90 vs d0 (expected distance) for shifted IMRT dose distributions and (b) linear regression plots for the mean, D85, D90, D95, and D99 of the distance distributions.
TABLE II.
Correlation and regression coefficients for the mean, median, D85, D90, D95, and D99 values versus d0.
| Noise | |||||||||
|---|---|---|---|---|---|---|---|---|---|
| None | 2% Gaussian | 5% Gaussian | |||||||
| Value | Pearson correlation with d0 | Linear regression coefficients | R2 | Pearson correlation | Linear regression coefficients | R2 | Pearson correlation | Linear regression coefficients | R2 |
| Mean | 0.85 | 0.37, 0.07 | 0.73 | 0.84 | 0.35, 0.31 | 0.70 | 0.77 | 0.30, 1.07 | 0.60 |
| Median | 0.73 | 0.36, 0.02 | 0.54 | 0.76 | 0.33, 0.15 | 0.57 | 0.75 | 0.28, 0.61 | 0.55 |
| D85 | 0.90 | 0.63, 0.14 | 0.81 | 0.87 | 0.60, 0.58 | 0.76 | 0.76 | 0.52, 1.93 | 0.58 |
| D90 | 0.93 | 0.69, 0.19 | 0.86 | 0.89 | 0.65, 0.78 | 0.80 | 0.76 | 0.56, 2.50 | 0.57 |
| D95 | 0.96 | 0.76, 0.28 | 0.93 | 0.92 | 0.71, 1.16 | 0.85 | 0.75 | 0.61, 3.59 | 0.56 |
| D99 | 0.98 | 0.86, 0.27 | 0.96 | 0.93 | 0.771, 2.21 | 0.87 | 0.74 | 0.67, 6.46 | 0.54 |
DISCUSSION
The dose gradient factor has units of mm/% and is the reciprocal of the mean absolute dose gradient. It represents the weighting between spatial and dose shift and can also be viewed as a conversion factor between dose and spatial distance, which have different metrics. The local dose gradient has been used in other dose comparison techniques.24, 25 Efforts have also been made to incorporate local dose gradient into the γ index.21 Although the dose gradient factor was not implemented explicitly when the γ index was developed, it was determined by the ratio of DD and DTA criteria, as shown in Eq. 12. In other words, the mean dose gradient factor would be forced to a fixed value once the DD and DTA criteria were determined, even though there would be no guarantee that this value would represent the true dose gradient of the target dose distribution. Therefore, we recommend determining the dose gradient factor before setting DTA/DD criteria. It should be noted that the dose gradient factor could be calculated once the dose distribution was generated by the planning system. As the mean of the dose gradient over all the pixels in the dose distribution, the constant form of the dose gradient factor represents a global conversion factor between dose difference and spatial shift (i.e., on average, the amount of spatial shift needed to offset a certain amount of dose difference and vice versa). Although the constant form of a dose gradient factor might not be the ideal representation of the sharpness of a local dose gradient, we found significant differences between the dose gradient factors for different applications (e.g., IMRT and spine SRS), suggesting that an application-specific dose gradient factor is needed to reflect the dose distribution overall. The definition of the constant form of the dose gradient factor may cause it to be biased with regard to the field size; a higher mean dose gradient, and hence smaller α, could be expected with smaller fields. The magnitude and implication of the possible bias should be investigated before one calculates the surface distance with one dose gradient factor for hugely different field sizes. Given that, along the large variation in dose gradient factors seen for IMRT (Table TABLE I.), it might be preferable to set application- or field size-specific criteria for IMRT QA. Defining those criteria, along with incorporating local dose gradients, will be the focus of our future projects.
The linear coefficients for all measured quantities (mean and median distance, D85, D90, D95, and D99) were <1; in other words, the γ index could not detect all shifts outside of the DTA/DD criteria if passing criteria were set to be a certain percentage of pixels with γ ≤ 1. Mathematically, this is always true because of the minimize function in the formulas for the γ index [Eq. 6) and distance (Eq. 3]. The detection limit, or the minimum error that a certain set of criteria can detect, can be related to the global shift d0, because the mean and median distances and D85, D90, D95, and D99 are all linear relative to d0, as shown in Table III. For example, in Fig. 9b or Table TABLE II., the detection limit for the γ index with a 90% passing percentage of 3 mm/3% criteria [γ(3 mm, 3%, 90%)] without noise is equivalent to d0 = 4.07 mm. Similarly, γ(2.71 mm, 2.71%, 85%), or γ(3.38 mm, 3.38%, 95%) also has a detection limit of d0 = 4.07 mm, and these criteria are interchangeable if global shifts were used as the evaluation metric.
From the results presented in our work, we can describe a method to determine the passing criteria for γ index as follows: First, determine the dose gradient factor from a number of plans. Next, determine the D90 (or other quantities) from the distance map between each plans and measurements. Finally, set the DTA/DD criteria on the basis of the statistics and distributions of and D90 [Eqs. 11, 12].17 The γ index criteria so determined would be consistent with both the application and the capacity of the QA system, could be easily updated with a change of technology, and would be unbiased.
There are three sources of uncertainty (difference) when comparing a dose distribution from the treatment planning system and actual measurements: (1) uncertainty in phantom setup; (2) uncertainty (quantum noise) in the dosimetry system (e.g., Film in our study); and (3) uncertainty due to mismatch between the modeled photon beam in the treatment planning system and the delivered photon beam. Setup uncertainty on the x-y plane results in a (global) spatial shift, and setup uncertainty in the z-direction results in a (global) dose difference because the plane predicted by the treatment planning system is different from the measurement plane. The dosimetry system’s quantum noise can be viewed as a random shift on the dose axis and therefore also has a global effect. As discussed by Low and Dempsey3 and shown in Tables TABLE II., if the noise level is small (2%), the measured quantities (e.g., mean distance and D90) do not change significantly, but if the noise level is sufficiently high, e.g., 5%, when only 68% of the pixels were expected to fall within the ±5% range, even without any spatial or dose shift. In the latter case, some of the quantities (e.g., D99), are no longer appropriate for use in evaluation. Model mismatching, which is the uncertainty of primary interest for IMRT QA, could be both global (flatness/symmetry/output change) and local (MLC/jaw), and the change could also be on both spatial (jaws/MLC) and dose (flatness/symmetric/output change) axes. The setup uncertainty and noise from the dosimetry system26 should be factored out from the total measured uncertainty if possible, and the model mismatching could then can be grouped with other uncertainties in delivery, such as setup uncertainty, and used to determine treatment margins.
The assumptions made in this study were that (1) the difference between two dose distributions can be represented by the combination of spatial and dose shifts and (2) with increasing spatial and dose shift or a combination of both, the difference between two dose distributions also increases. The validity of these assumptions was shown indirectly in the simulation, that is, the distance measurement was a good representation of the difference between two dose distributions and it increased linearly with shifts. Although the surface-based distance was developed in both 2D and 3D forms, only the 2D form was applied to the measurements and simulations in this work. The results and conclusions drawn from the current analysis may not be fully applicable in 3D, however, and additional studies need to be done.
CONCLUSIONS
The surface-based distance is a direct measurement of the difference between two dose distributions and can be used for evaluation or determination of parameters for the γ index. The dose gradient factor represents the weighting between spatial and dose shifts and should be determined before DTA/DD criteria are set. On the basis of the analyses reported here, we conclude that, first, DTA and DD criteria for γ index are not independent of each other; instead, they are linked by the mean absolute dose gradient, or dose gradient factor. Second, the detection limit of the γ index with a certain set of DTA/DD/passing rate criteria is linear with respect to the global shift of the dose distribution, with linear coefficients always <1. The detection limit for the γ index with criteria of 3 mm/3% and a 90% passing rate is 4.07 mm/4.07% for IMRT without noise. Third, using an unbiased method to determine the DTA/DD criteria for the γ index from plans and measurements yields criteria that is more consistent with the application and the capacity of the IMRT QA system than predetermined criteria.
ACKNOWLEDGMENTS
The authors thank the dosimetrists, graduate students, and physicist assistants who generated the plans, created the planar dose distributions, and made the measurements. Tamara Locke, Kathryn Carnes and Zachary Bohannan of the Department of Scientific Publications at The University of Texas MD Anderson Cancer Center are greatly appreciated for their editorial review of this manuscript. This research is supported in part by the National Institutes of Health through MD Anderson’s Cancer Center Support Grant CA016672.
Notation
- DTA =
distance to agreement
- DD =
(absolute) dose difference
- γ(DTA, DD) =
γ index with DTA and DD criteria
- P(DTA, DD) =
passing percentage of γ(DTA, DD) (percentage of pixels with γ(DTA, DD) ≤ 1)
- γ(DTA, DD, P) =
γ index test passing criteria of P(DTA, DD) ≥P
Partly presented at the 2010 Annual Meeting of the American Association of Physicists in Medicine (AAPM), July 18–22, Philadelphia, PA.17
References
- Ezzell G. A., Burmeister J. W., Dogan N., LoSasso T. J., Mechalakos J. G., Mihailidis D., Molineu A., Palta J. R., Ramsey C. R., Salter B. J., Shi J., Xia P., Yue N. J., and Xiao Y., “IMRT commissioning: multiple institution planning and dosimetry comparisons, a report from AAPM Task Group 119,” Med. Phys. 36, 5359–5373 (2009). 10.1118/1.3238104 [DOI] [PubMed] [Google Scholar]
- Sakhalkar H., Sterling D., Adamovics J., Ibbott G., and Oldham M., “Investigating the Feasibility of 3D Dosimetry in the RPC IMRT H&N Phantom,” J. Phys. 164, 12058 (2009). 10.1088/1742-6596/164/1/012058 [DOI] [PMC free article] [PubMed] [Google Scholar]
- Low D. A. and Dempsey J. F., “Evaluation of the gamma dose distribution comparison method,” Med. Phys. 30, 2455–2464 (2003). 10.1118/1.1598711 [DOI] [PubMed] [Google Scholar]
- Low D. A., Harms W. B., Mutic S., and Purdy J. A., “A technique for the quantitative evaluation of dose distributions,” Med. Phys. 25, 656–661 (1998). 10.1118/1.598248 [DOI] [PubMed] [Google Scholar]
- Winiecki J., Morgas T., Majewska K., and Drzewiecka B., “The gamma evaluation method as a routine QA procedure of IMRT,” Reports of Practic. Oncol. Radiother. 14, 162–168 (2009). 10.1016/S1507-1367(10)60031-4 [DOI] [Google Scholar]
- Stock M., Kroupa B., and Georg D., “Interpretation and evaluation of the gamma index and the gamma index angle for the verification of IMRT hybrid plans,” Phys. Med. Biol. 50, 399–411 (2005). 10.1088/0031-9155/50/3/001 [DOI] [PubMed] [Google Scholar]
- Childress N. L. and Rosen, II, “The design and testing of novel clinical parameters for dose comparison,” Int. J. Radiat. Oncol., Biol., Phys. 56, 1464–1479 (2003). 10.1016/S0360-3016(03)00430-9 [DOI] [PubMed] [Google Scholar]
- Blanpain B. and Mercier D., “The delta envelope: a technique for dose distribution comparison,” Med. Phys. 36, 797–808 (2009). 10.1118/1.3070546 [DOI] [PubMed] [Google Scholar]
- Falk M., af Rosenschold P. M., Keall P., Cattell H., Cho B. C., Poulsen P., Povzner S., Sawant A., Zimmerman J., and Korreman S., “Real-time dynamic MLC tracking for inversely optimized arc radiotherapy,” Radiother. Oncol. 94, 218–223 (2010). 10.1016/j.radonc.2009.12.022 [DOI] [PMC free article] [PubMed] [Google Scholar]
- Haga A., Nakagawa K., Shiraishi K., Itoh S., Terahara A., Yamashita H., Ohtomo K., Saegusa S., Imae T., Yoda K., and Pellegrini R., “Quality assurance of volumetric modulated arc therapy using Elekta Synergy,” Acta Oncol, 48, 1193–1197 (2009). 10.3109/02841860903081905 [DOI] [PubMed] [Google Scholar]
- Ibbott G. S., Followill D. S., Molineu H. A., Lowenstein J. R., Alvarez P. E., and Roll J. E., “Challenges in credentialing institutions and participants in advanced technology multi-institutional clinical trials,” Int. J. Radiat. Oncol., Biol., Phys. 71, S71–S75 (2008). 10.1016/j.ijrobp.2007.08.083 [DOI] [PMC free article] [PubMed] [Google Scholar]
- McNiven A. L., Sharpe M. B. and Purdie T. G., “A new metric for assessing IMRT modulation complexity and plan deliverability,” Med. Phys. 37, 505–515 (2010). 10.1118/1.3276775 [DOI] [PubMed] [Google Scholar]
- Nelms B. E. and Simon J. A., “A survey on planar IMRT QA analysis,” J. Appl. Clin. Med. Phys. 8, 76–90 (2007). [DOI] [PMC free article] [PubMed] [Google Scholar]
- Gillis S., De Wagter C., Bohsung J., Perrin B., Williams P., and Mijnheer B. J., “An inter-centre quality assurance network for IMRT verification: results of the ESTRO QUASIMODO project,” Radiother. Oncol. 76, 340–353 (2005). 10.1016/j.radonc.2005.06.021 [DOI] [PubMed] [Google Scholar]
- Molineu A., Followill D. S., Balter P. A., Hanson W. F., Gillin M. T., Huq M. S., Eisbruch A., and Ibbott G. S., “Design and implementation of an anthropomorphic quality assurance phantom for intensity-modulated radiation therapy for the radiation therapy oncology group,” Int. J. Radiat. Oncol., Biol. Phys. 63, 577–583 (2005). 10.1016/j.ijrobp.2005.05.021 [DOI] [PubMed] [Google Scholar]
- Molineu A., Hernandez N., Alvarez P., Followill D., and Ibbott G., “Results from multiple radiations of an anthropomorphic spine phantom,” Med. Phys. 37, 3400 (2010). 10.1118/1.3469289 [DOI] [Google Scholar]
- Li H., Dong L., Zhang L., Yang J., Gillin M., Mohan R., and Zhu X., “Surface Based Distance Measures with Treatment Technique Specific Gradient Factor for IMRT QA Tolerances Determination,” Med. Phys. 37, 3399 (2010). 10.1118/1.3469284 [DOI] [Google Scholar]
- Li H., Zhang L., Dong L., Sahoo N., Gillin M. T., and Zhu X. R., “A CT-based software tool for evaluating compensator quality in passively scattered proton therapy,” Phys. Med. Biol. 55, 6759–6771 (2010). 10.1088/0031-9155/55/22/010 [DOI] [PubMed] [Google Scholar]
- Bentley J. L., “Multidimensional divide and conquer,” Commun. ACM, 23, 214–229 (1980). 10.1145/358841.358850 [DOI] [Google Scholar]
- Yuan J. and Chen W., “A gamma dose distribution evaluation technique using the k-d tree for nearest neighbor searching,” Med. Phys. 37, 4868–4873 (2010). 10.1118/1.3480964 [DOI] [PubMed] [Google Scholar]
- Bakai A., Alber M. and Nusslin F., “A revision of the gamma-evaluation concept for the comparison of dose distributions,” Phys. Med. Biol. 48, 3543–3553 (2003). 10.1088/0031-9155/48/21/006 [DOI] [PubMed] [Google Scholar]
- Kisling K., Dissertation, University of Texas, 2010. [Google Scholar]
- Jirina M., Technical Report No. 878, Institute of Computer Science, Academy of Sciences of the Czech Republic, 2002.
- Chen Y., Moran J. M., Roberts D. A., El-Mohri Y., Antonuk L. E., and Fraass B. A., “Performance of a direct-detection active matrix flat panel dosimeter (AMFPD) for IMRT measurements,” Med. Phys. 34, 4911–4922 (2007). 10.1118/1.2805993 [DOI] [PubMed] [Google Scholar]
- Moran J. M., Radawski J., and Fraass B. A., “A dose gradient analysis tool for IMRT QA,” J. Appl. Clin. Med. Phys. 6, 62–73 (2005). 10.1120/jacmp.2024.25338 [DOI] [PMC free article] [PubMed] [Google Scholar]
- van Battum L. J., Hoffmans D., Piersma H., and Heukelom S., “Accurate dosimetry with GafChromic EBT film of a 6 MV photon beam in water: what level is achievable?,” Med. Phys. 35, 704–716 (2008). 10.1118/1.2828196 [DOI] [PubMed] [Google Scholar]


