Abstract
The medial olivocochlear reflex (MOCR) has been hypothesized to provide benefit for listening in noise. Strong physiological support for an anti-masking role for the MOCR has come from the observation that auditory nerve (AN) fibers exhibit reduced firing to sustained noise and increased sensitivity to tones when the MOCR is elicited. The present study extended a well-established computational model for normal-hearing and hearing-impaired AN responses to demonstrate that these anti-masking effects can be accounted for by reducing outer hair cell (OHC) gain, which is a primary effect of the MOCR. Tone responses in noise were examined systematically as a function of tone level, noise level, and OHC gain. Signal detection theory was used to predict detection and discrimination for different spontaneous rate fiber groups. Decreasing OHC gain decreased the sustained noise response and increased maximum discharge rate to the tone, thus modeling the ability of the MOCR to decompress AN fiber rate-level functions. Comparing the present modeling results with previous data from AN fibers in decerebrate cats suggests that the ipsilateral masking noise used in the physiological study may have elicited up to 20 dB of OHC gain reduction in addition to that inferred from the contralateral noise effects. Reducing OHC gain in the model also extended the dynamic range for discrimination over a wide range of background noise levels. For each masker level, an optimal OHC gain reduction was predicted (i.e., where maximum discrimination was achieved without increased detection threshold). These optimal gain reductions increased with masker level and were physiologically realistic. Thus, reducing OHC gain can improve tone-in-noise discrimination even though it may produce a “hearing loss” in quiet. Combining MOCR effects with the sensorineural hearing loss effects already captured by this computational AN model will be beneficial for exploring the implications of their interaction for the difficulties hearing-impaired listeners have in noisy situations.
Keywords: computational modeling, dynamic range, outer hair cell, efferent, detection, discrimination
Introduction
The mammalian auditory system is able to code intensity changes over a wide range of sound levels, which facilitates communication in quiet and in varying levels of background noise. This wide range occurs despite the fact that individual auditory neurons can change firing rates only over a limited range of levels. One way in which the auditory system may be able to accomplish this is through dynamic range adaptation (Dean et al. 2005), which effectively shifts the dynamic range of neurons based on preceding acoustic stimulation. Some dynamic range adaptation may be produced by the medial olivocochlear reflex (MOCR) (Kawase et al. 1993). The MOCR is mediated by a feedback loop from the level of the superior olivary complex to the outer hair cells (OHCs) in the cochlea.
The effects of the MOCR have been studied at several levels of the auditory system and with several techniques for activating the MOC bundle. For example, shocking the MOC bundle has been shown to decrease the gain of the basilar membrane (BM) input–output (I/O) function and to raise the tip of the BM tuning curve (Murugasu and Russell 1996). Other studies have elicited the MOCR by presenting contralateral sound, which takes advantage of the fact that the MOCR is a bilateral reflex and has been used to study potential perceptual benefits of the MOCR (Guinan 2006). For example, the MOCR has been reported to produce an anti-masking effect in physiological responses when short signals are presented in noise (Nieder and Nieder 1970; Winslow and Sachs 1987; Dolan and Nuttall 1988; but also see Scharf et al. 1997). Kawase et al. (1993) showed that contralateral noise decreased the response of auditory nerve (AN) fibers to ipsilateral noise, thus reducing adaptation and increasing the maximum firing rate to tones; signal detection theory (SDT) was then used to demonstrate the MOCR benefit for detection and discrimination as produced by contralateral noise.
Eliciting the MOCR by contralateral noise or by shocking the MOC bundle has been fruitful in understanding details about MOCR function; however, these techniques have limitations. For example, neither technique has revealed the relationship between elicitor level and MOCR strength in terms of the amount of gain reduction. In the Kawase et al. (1993) study, the continuous ipsilateral noise likely elicited the MOCR itself; thus, presenting the contralateral noise elicited an increase in MOCR strength relative to the baseline set by the ipsilateral noise. This contralateral increase may underestimate the magnitude of both the ipsilateral and the combined MOCR, since in cats the ipsilateral reflex is two to three times stronger than the contralateral reflex (Guinan 2006).
In the present paper, we used an AN model (Zilany and Bruce 2006) to simulate the effects of the MOCR on tone-in-noise responses. Similar to previous modeling approaches, OHC gain was adjusted to simulate the effect of the MOCR (Ferry and Meddis 2007; Messing et al. 2009; Jennings et al. 2011). The model simulates the output of the BM, as well as responses of AN fibers with different spontaneous rates (SRs). Thus, the AN model combined with SDT provides a means of predicting the relationship between OHC gain and neural coding in a population of AN fibers.
Methods
Auditory nerve model
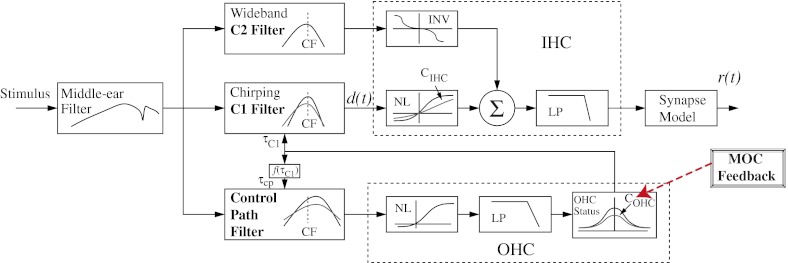
Basilar membrane responses and AN discharge rates were simulated using the AN model described by Zilany and Bruce (2006, 2007). A schematic of the model is shown in Figure 1. This model represents an extension of previous versions of the AN model, each of which has been tested against physiological responses from cats to simple and complex stimuli, including tones, two-tone complexes, broadband noise, and vowels (Carney 1993; Heinz et al. 2001; Zhang et al. 2001; Bruce et al. 2003; Tan and Carney 2003; Zilany and Bruce 2006). The AN model captures many cochlear nonlinearities including compression, suppression, broadened tuning, level-dependent shifts in best frequency, and the C1/C2 transition that occurs at higher sound levels (for a review of other computational models, see Lopez-Poveda 2005). A strength of this model is the ability to manipulate nonlinearities associated with OHCs, including gain, by adjusting a single model parameter (COHC) (Bruce et al. 2003; Heinz 2010). The COHC parameter was originally intended to model OHC damage; however, it may also be used to simulate the gain reduction effects of the MOCR (Jennings et al. 2011). Values for this parameter range from 1 (normal function) to 0 (complete loss of the active process). In the schematic for the model (Fig. 1), the box labeled MOCR and its connection to the COHC parameter represent the approach of simulating the main effect of the MOCR by reducing OHC gain.
FIG. 1.
Schematic diagram of the auditory nerve model. The medial olivocochlear (MOC) reflex was simulated by reducing the gain of the outer hair cells (OHCs) by adjusting the model parameter COHC, as shown by the box marked MOC feedback and the red dashed arrow. Figure modified from Zilany and Bruce (2007) and used with permission from the Journal of the Acoustical Society of America.
Under natural listening conditions, the MOCR may be elicited by sound through both ipsilateral and contralateral pathways (Guinan 2006). Thus, the total amount of gain reduction by the reflex depends on the combination of MOC activity in both pathways. For the purpose of this study, the gain was controlled independently in a single pathway, since the relationship between elicitor level and amount of gain reduction is not known. A similar approach has been taken in several other modeling studies (e.g., Ferry and Meddis 2007; Ghitza et al. 2007; Messing et al. 2009; Brown et al. 2010). Conditions will be labeled by the amount of OHC gain reduction (∆G in dB) associated with the COHC value. Conditions with the COHC value set at 1 (full OHC gain) will be labeled ∆G = 0 dB (i.e., simulating the no-MOCR condition), while those with COHC reduced from 1 (reduced OHC gain) will be labeled by the dB change in gain (∆G).
Comparing physiological and modeling estimates of MOCR gain reduction
The primary objective of the present paper was to model the effects of the MOCR on detection and discrimination of tones in noise. The model provides a useful link between two physiological studies that have measured AN fiber responses to tones in noise in cat and used SDT to analyze the data (see below). In the first study (Young and Barta 1986), responses to tones in background noise were measured for cats anesthetized with sodium pentobarbital. The dose of the anesthetic was adjusted to maintain the animals in an areflexive state, so the MOCR was greatly reduced in these animals (Boyev et al. 2002). Tone bursts with a duration of 200 ms were presented at the AN fiber's characteristic frequency (CF), in quiet and in three levels of background noise. When presented in background noise, the noise was presented for at least 15 s before the tone was presented. Measurements for noise alone were taken from the 200 ms immediately preceding the tone. In the second study (Kawase et al. 1993), AN fiber responses were measured to tone bursts in ipsilateral noise in cats, the majority of which were decerebrate. The MOCR was active in these animals (as measured by compound action potential responses). In their experiments, the effects of the MOCR were studied by comparing AN responses measured with and without contralateral noise. The basic stimulus paradigm consisted of a series of 50-ms tone bursts presented 5 s after the onset of the ipsilateral noise. As noted by Kawase et al., this 5-s delay between the start of the noise and the onset of the tone bursts was sufficiently long to elicit the ipsilateral MOCR. Thus, in the baseline (ipsilateral noise) condition, the MOCR was already elicited, but to an unknown extent. The contralateral noise further elicited the MOCR; however, the contralateral effect is often interpreted as the total MOCR effect.
The stimulus parameters in the present study were chosen to approximate those of Kawase et al. (1993). Using the AN model, the amount of OHC gain reduction was able to be adjusted systematically. This allowed the simulated effects of the MOCR to be studied relative to model responses with full gain, rather than looking at a proportional response (i.e., contralateral effects combined with baseline ipsilateral effects) as was done by Kawase et al. (1993). The present study provides a potential bridge (in theory) between the studies of Young and Barta (1986) and Kawase et al. (1993). Simulations with full gain (i.e., no MOCR) should resemble those of Young and Barta (1986), allowing for small differences in the stimulus paradigms. Model predictions with systematic reductions in OHC gain (i.e., simulating variations in the strength of MOCR effects) will produce results that can be compared to those found by Kawase et al. (1993) for ipsilateral noise alone and with the addition of contralateral noise. Thus, this modeling approach can be used to provide a theoretical estimate of the amount of OHC gain reduced by the MOCR in the ipsilateral-alone and the combined ipsilateral/contralateral noise conditions tested by Kawase et al. Moreover, the “optimal” reduction in gain to maximize detection and discrimination in different levels of noise was also determined through systematic variation of model parameters. A reduction in gain as high as 40 dB has been produced by shocking the crossed MOC bundle (Russell and Murugasu 1997), which controls the ipsilateral reflex. It is not known how shocking the bundle compares to eliciting the MOCR by sound; however, 40 dB was used as the upper limit of physiologically realistic gain change in the present study. A similar approach was taken by Brown et al. (2010) to determine the amount of gain reduction needed to optimize identification of speech in noise, and by Ferry and Meddis (2007) to model physiological data at the level of the BM and for compound action potentials measured to tones in noise. However, this modeling approach has not been used to simulate detection and discrimination of tones in noise based on AN fibers with different SRs.
Stimuli
The input to the model was an acoustic waveform (in Pascals), and the output was the response of the C1 filter (for BM simulations), or the time-varying discharge rate of a single AN fiber (in spikes/s) with a specific CF. The sampling rate used with the stimuli and AN model was 100 kHz. The discharge rate was estimated from the synapse output of the model [r(t) in Fig. 1], which does not include the effects of refractoriness. The model simulations were done for SRs of 50 (high), 10 (med), and 1 (low) spikes/s (Liberman 1978).
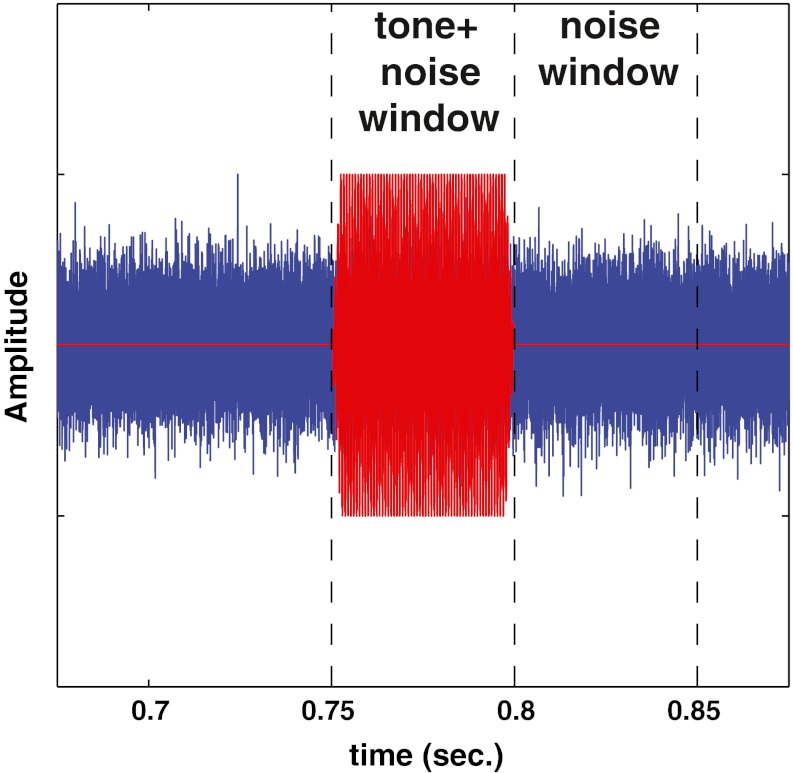
The tone and noise conditions were chosen to approximate the conditions used by Kawase et al. (1993), and are shown schematically in Figure 2. The tone was a sinusoid 50 ms in duration including 2.5 ms cos2 ramps. A tone frequency of 8 kHz was used for most of the simulations in this study. This is in the middle of the range of frequencies that showed a maximum MOCR effect in the Kawase et al. study. Tone levels were evaluated from −20 to 100 dB SPL in 5 dB steps. The broadband noise had a duration of 1 s including 2.5 ms cos2 ramps. In the Kawase et al. study, trains of tone bursts were presented with a 50% duty cycle during a continuous noise (turned on 5 s before the first tone burst). For computational considerations in the present modeling study, a single tone burst was presented with an onset at a delay of 750 ms from the onset of the noise. This delay was chosen so that the response of the model AN fiber would be fully adapted to the noise, as it would have been in the Kawase et al. study. As in that study, the response to the noise alone was taken from the 50-ms time period immediately following the tone (i.e., 800 ms after noise onset). Based on data from Guinan and Stankovic (1996), the sequentially increasing presentation of tone levels by Kawase et al. (1993) could have depressed the rate-level functions at high signal levels as compared to the single-tone presentation used in the model. The implications of this potential long-term adaptation effect in the physiological data are discussed below when the model simulations are compared to the physiological data.
FIG. 2.
Schematic of the stimuli and the analysis windows. The noise began at 0 ms. The 50-ms tone burst was presented with an onset at 750 ms. The tone + noise analysis window was the 50-ms during the tone burst. The noise window was the 50-ms window immediately following the tone burst.
Estimating absolute threshold to the noise
Noise levels were set relative to the absolute threshold for the noise for each individual AN fiber. Absolute threshold to the noise was estimated for each fiber using the approach taken by Wen et al. (2009). Fifty different samples of noise were used. Each noise sample (frozen noise) was presented across a range from 0 to 120 dB SPL in 5-dB steps to estimate a rate-level function. The rate-level function was normalized such that it ranged from 0 to 1, by subtracting the baseline rate from the rate-level function and then dividing by the saturated rate. The noise level at which the normalized rate-level function reached 0.1 was taken as the absolute threshold to the noise for a single noise sample. This threshold was estimated by averaging the individual estimates from the 50 different noise samples.
The overall noise level ranged from 10 to 70 dB SL (sensation level). Rate-level functions were obtained from predicted AN responses to the noise and tone + noise. For a given condition, a set of 50 samples was used to measure the rate-level functions with ∆G set to values from 0 to −40 dB, in 5-dB steps. Frozen noise was used to prevent variability in the noise from obscuring the monotonic form of the rate-level functions.
The signal detection theory approach
Kawase et al. (1993) used SDT (Green and Swets 1966) to relate their physiological data to behavior. A strength of using SDT is that it can be applied to both measured and simulated data (e.g., Heinz et al. 2002). In the present modeling study, as in the physiological study by Kawase et al. (1993), the stochastic variability associated with neural spike counts was used to predict perceptual ability based on single AN fibers for both detection and discrimination tasks.
A detectability measure (d') was used to quantify detection of a fixed-level tone in the presence of a noise masker. A higher d' corresponds to higher probability of detection, with a value near 1 typically taken to represent threshold (Green and Swets 1966). The decision variable assumed to be used was the number of AN spikes. The tone + noise and noise distributions needed for the SDT analysis were obtained from the spike counts during the 50-ms duration of the tone + noise and the immediately following 50-ms noise portion of the stimulus (see Fig. 2).
In the AN model, d' can be efficiently computed from the synaptic discharge rate [r(t) in Fig. 1], which is a deterministic output from the model. For the detection task, the expected (mean) number of spikes within the tone + noise and noise-alone windows are given by Non = ronT and Noff = roffT, respectively, where ron and roff are the average discharge rates within each window and T is the 50-ms window duration. Besides the difference in mean spike counts, the other factor that must be accounted for in predicting behavioral performance is spike-count variability. Although many successful modeling studies have assumed Poisson spike-count variability (i.e., variance equal to the mean; e.g., Siebert 1968; Heinz et al. 2002), refractory effects in AN responses reduce the true variability to less than Poisson. Thus, to compare more accurately to the neurophysiological data from Kawase et al. (1993), an adjustment was made in the current study to account for this deviation from Poisson variability. A reasonable approximation to physiological AN data is that spike-count variability is roughly one-half as large as Poisson variability (i.e., the variance σ2 equals one-half of the mean, or 0.5 rT; e.g., Young and Barta 1986). Thus, d' can be computed solely based on the average discharge rate outputs from the AN model as:
 |
1 |
Likewise, a discriminability measure (d') was used to quantify how well an increment of 5 dB in tone intensity can be discriminated in the presence of a noise masker. This measure was computed from the tone + noise portion of the stimulus for a given tone level and a level 5 dB higher. A higher d' value corresponds to greater discriminability and, similarly to the detection metric, is defined as:
 |
2 |
where rL and rL+5 are the average rates for the 50-ms duration of the tone + noise portion at a given sound level (L in dB SPL) and a 5-dB higher sound level (L + 5 dB).
Results
Decreasing the OHC gain in the model fits BM data elicited by MOC shocks
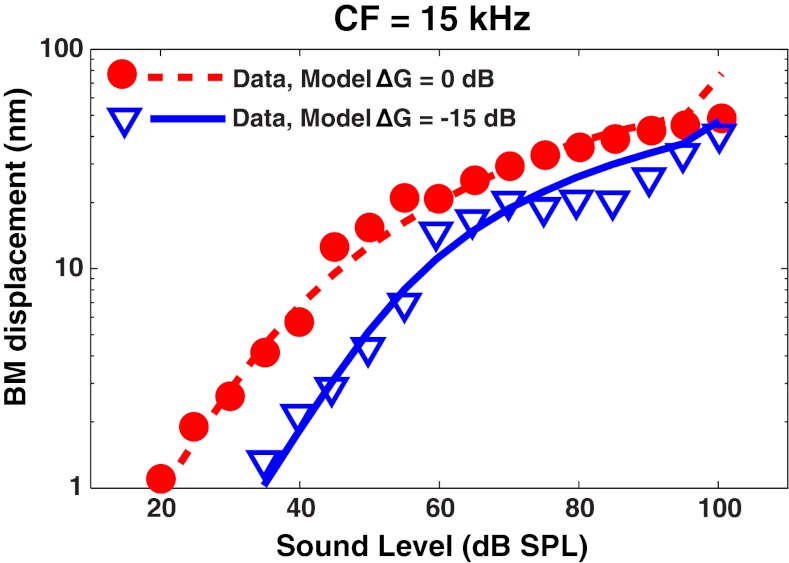
Because the MOCR feeds back to the OHCs in the cochlea, the first effects of eliciting the reflex may be observed at the level of the BM. Russell and Muragasu (1997) measured the BM I/O function in the base of the guinea pig cochlea, and then measured it again as they shocked the MOC bundle. The stimuli were tones at the characteristic frequency (CF) for that place on the BM. Tone duration was 40 ms with 2 ms cos2 ramps. Those data (Fig. 1B in Russell and Murugasu 1997) are replotted in Figure 3. The CF for this place on the BM was 15 kHz. The control condition is shown by the circles, while data measured with MOC shocks are shown by the triangles. Using the AN model, cochlear I/O functions were simulated for a tone presented at 15 kHz using the output of the model's C1 filter [d(t) in Fig. 1], which has been shown to predict physiological I/O functions measured on the BM (Heinz et al. 2001; Zhang et al. 2001; Bruce et al. 2003; Zilany and Bruce 2006). This simulation is shown by the dashed line in Figure 3. For the solid line, the COHC parameter of the model was adjusted in steps of 0.01 to find the value that minimized the RMS error between the model predictions and the data. The optimum COHC value corresponded to an OHC gain reduction of approximately 15 dB. This amount of OHC gain reduction corresponds to the maximum level shift that was measured at low levels by Russell and Murugasu (1997). Ferry and Meddis (2007) used the Meddis (2006) model and first adjusted the parameters to fit the control condition, then adjusted an attenuation parameter within their nonlinear pathway to fit the MOCR condition, and found that 15 dB was the amount of attenuation needed to fit these same data. A strength of the present AN model is its ability to predict the same data by adjusting only one physiologically based parameter (COHC), which is directly associated with OHC function and all of the related physiological properties, i.e., COHC directly controls not just gain but also level-dependent tuning and suppression (Bruce et al. 2003; Heinz 2010).
FIG. 3.
Outer hair cell (OHC) gain reduction in the AN model can account for medial olivocochlear reflex (MOCR) effects in basilar membrane (BM) responses. Data points are BM input–output functions from guinea pig measured by Russell and Muragasu (1997, their Fig. 1B). Responses to a tone at the characteristic frequency (CF, 15 kHz) were made without (circles) and with (triangles) shocks to the MOC bundle. The dashed red line is the prediction from the auditory nerve (AN) model at the level of the BM [d(t) in Fig. 1] at a CF of 15 kHz, with full OHC gain. To fit the solid blue line, the COHC parameter of the AN model was varied to find the optimum reduction in gain, which was 15 dB. Model BM output values were scaled by a fixed value (vertical shift) to best match the physiological absolute values in the no-shock condition.
Rate-level functions as a function of OHC gain change
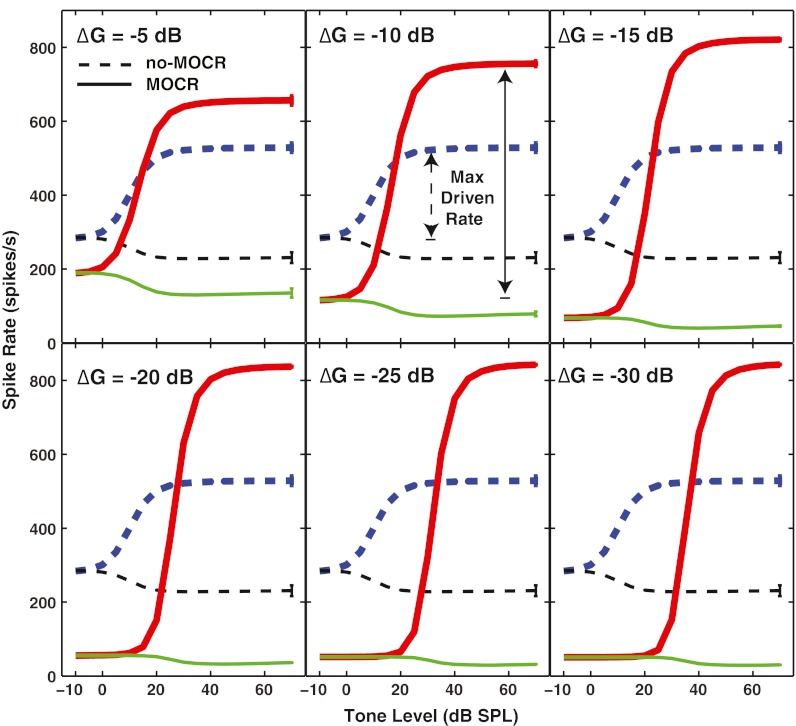
In Figure 4, the rate-level function for a high-SR fiber with a CF of 8 kHz is shown. The level of the noise was 10 dB SL (an overall noise level of 27 dB SPL in this case). In the simulated no-MOCR condition (dashed lines), OHC gain was maximal. The response to the tone + noise is shown by the thicker lines and the response to the noise alone by the thinner lines. The response at low tone levels was dominated by the noise. As the tone level was increased, an increase in firing rate was seen. There was a concomitant decrease in firing during the noise-alone window, which was immediately following the tone (Fig. 2). This effect was due to neural adaptation produced by the tone.
FIG. 4.
Simulated rate-level functions for a high spontaneous rate model neuron with a characteristic frequency (CF) of 8 kHz illustrate that outer hair cell (OHC) gain reduction produced anti-masking effects in single AN fiber responses. The tone frequency is at CF, and it is presented in a noise masker that is at 10 dB SL. Dashed lines are the response to the tone + noise (thicker line) or noise alone immediately following the signal (thinner line). Solid lines show responses to the tone + noise (thicker line) and noise alone (thinner line) when the gain of the OHC module is reduced by the ∆G values shown. The maximum driven rate, shown by the vertical arrows, is the difference between the maximum response to the tone + noise and the response to the noise at low tone levels. The vertical bars at the right of each line are the standard deviation across runs for each condition. Note that the saturated rates for these model responses are somewhat higher than expected for AN fiber responses because they represent the spike rate before the effects of refractoriness (see “Methods” section).
To simulate the MOCR, the gain of the OHCs was decreased. This was done by adjusting COHC to a value less than 1, to achieve a given dB decrease in OHC gain (∆G). Within each panel, the dashed lines represent simulated AN responses without a reduction in OHC gain. Similarly, solid lines represent simulated AN responses with OHC gain reduced according to the ∆G value displayed in the upper left corner of the panel. Reducing OHC gain decreased the firing rate to the noise at all levels. It also increased the maximum firing rate to the tone + noise and steepened the slope of the rate-level function. These changes in the rate-level functions are similar to those seen in AN fibers by Kawase et al. (1993) in response to contralateral noise, and by Winslow and Sachs (1987) in response to shocking the MOC bundle. As ∆G became more negative (i.e., more OHC gain reduction), the response to the noise was decreased, and the response to the tone + noise at high levels was increased. For several ∆G values (−15, −20, −25, and −30 dB), the tone level at which an increase in firing was first seen (i.e., tone threshold for the rate-level function) also shifted to higher levels.
The maximum driven rate, shown by the vertical arrows, was obtained by subtracting the firing rate to the noise at the lowest tone level from the maximum firing rate to the tone + noise. Maximum driven rate increased as the OHC gain was decreased. This effect has been called decompression (Winslow and Sachs 1987). Increasing decompression with decreasing OHC gain was observed for all CFs examined (octave steps from 1 to 16 kHz, data not shown). Although maximum decompression was similar across CFs, for any fixed noise-level (or even equal-SL) comparisons, the amount of decompression increased with CF due to the strong dependence on noise-driven rate in the full-gain condition. Noise-driven rate varied across CF due to differences in noise thresholds associated with smaller filter bandwidths at lower CFs, as well as differences in noise rate-level slopes across CF (e.g., steeper growth rates at higher CFs, see Ruggero 1973; Schalk and Sachs 1980). These effective noise-level factors, as well as variations in efferent innervation density across CF that are not included in the present AN model, make quantitative comparisons of the amount of decompression across CF complicated and beyond the scope of the present study.
In Figure 5, rate-level functions are shown for a high-, a medium-, and a low-SR AN fiber with a CF of 8 kHz. The masker was set at 50 dB SL re: threshold of the high-SR fiber. The ordinate is scaled equivalently across the three SR groups to show that firing rate to the tone at high levels was largest for the low-SR fiber when OHC gain was reduced. The panel insets for the high-SR and medium-SR fibers show that reducing OHC gain also had an effect (albeit smaller) on rate-level function slope and saturation level for these SR groups. Although anti-masking effects were seen for high- and medium-SR fibers at these high noise levels, the effects were smaller than for the low-SR fiber that was not saturated by the noise alone.
FIG. 5.
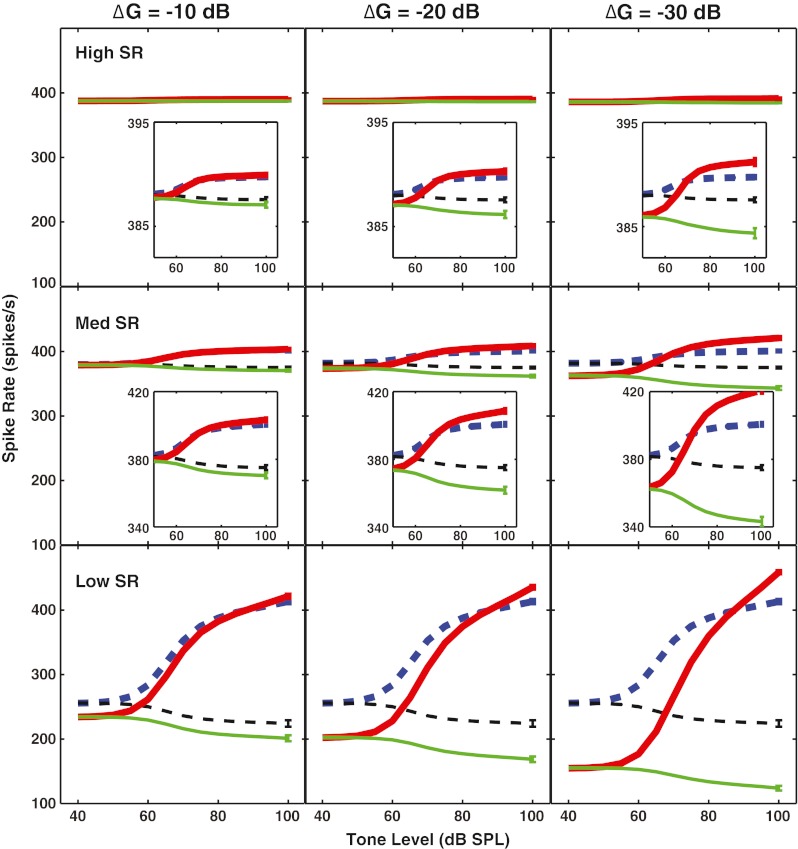
Outer hair cell (OHC) gain reduction produced anti-masking effects in all spontaneous rate (SR) groups, with the largest effects for fibers not saturated by the noise alone. Simulated rate-level functions for a high-SR (top row), medium-SR (middle row), and low-SR (bottom row) fiber with a characteristic frequency (CF) of 8 kHz. The tone is at CF; noise is the same level for all SR fibers (50 dB SL re: threshold for the high-SR fiber). Each column represents a different reduction in the OHC gain (∆G). Insets show that there is an effect for high- and medium-SR fibers when the scale is magnified.
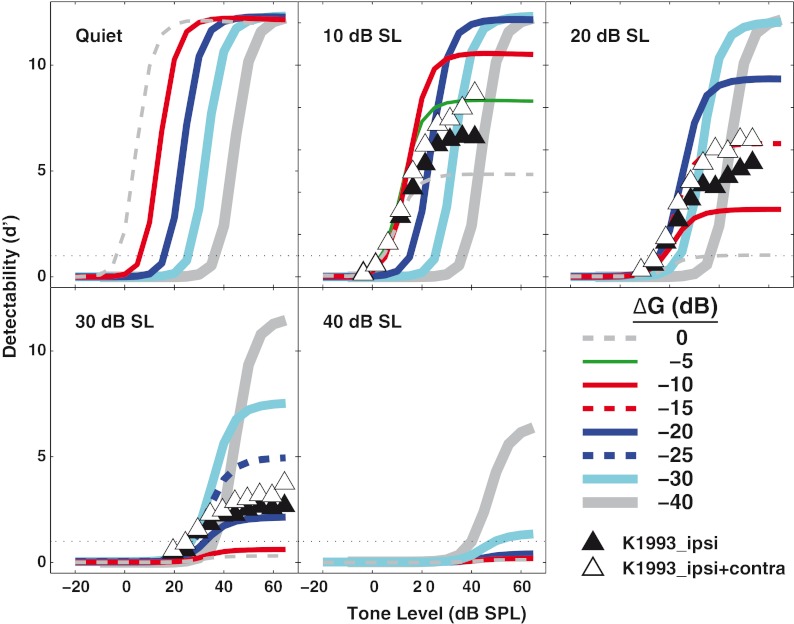
In Figure 6, each panel shows d' for detectability (calculated from Eq. 1) as a function of ∆G. Individual panels represent different levels of noise. In psychophysical experiments, the criterion d' value defining detection threshold typically ranges between 1 and 2. In the present study, a d' of 1 was used. As the noise level increased, the maximum d' decreased in the full-gain condition (∆G = 0 dB). For the same condition, detection thresholds could not be calculated when the noise was higher than 10 dB SL (i.e., the curve did not cross the d' = 1 line).
FIG. 6.
Decreasing outer hair cell (OHC) gain in the auditory nerve model can improve tone detection in noise. Detectability (d') for a tone in noise is shown for a high spontaneous rate fiber with a characteristic frequency of 8 kHz. The thin dashed lines show the response with full OHC gain (∆G = 0 dB). Lines of increasing thickness show detectability as OHC gain is reduced in 5-dB steps. Increasing noise levels (from 10 to 40 dB SL) are shown across the panels. Filled triangles show data from Kawase et al. (1993) in ipsilateral noise of the same level shown in the panel. Open triangles are Kawase et al. data with the addition of a fixed-level contralateral noise. The horizontal dotted line at d' = 1 is taken to represent detection threshold.
In quiet, a decrease in ∆G (shown by the solid lines increasing in thickness) shifted the function to the right without affecting maximum d'. That is, decreasing ∆G increased threshold. When the noise was set at 10 dB SL, threshold in the ∆G = 0 dB condition increased. For this same noise level, reducing the OHC gain by 10 dB (i.e., ∆G = −10 dB) resulted in an increase in maximum d' without increasing threshold. If OHC gain was further reduced, the maximum d' continued to increase, however, at the expense of higher detection thresholds. When the noise level was 20 dB SL, a similar increase in the maximum d' was observed for OHC gain reductions of up to −20 dB; however, threshold actually improved relative to the ∆G = 0 dB condition. For reductions in OHC gain greater than 20 dB, maximum d' increased; however, this increase was accompanied by poorer thresholds. A similar pattern was observed for higher noise levels (i.e., 30 and 40 dB SL).
These modeling results were compared in Figure 6 to the neurophysiological data from cats in Kawase et al. (1993); the model is based on cat data, and the same d' metrics were used to analyze both the data and the predictions. The Kawase et al. data are plotted as symbols in the panels where comparisons are possible. These results are average results from a population of AN fibers in their study. Results for 30 and 40 dB SL were combined in their study and are shown here in the 30-dB SL panel. Results with the ipsilateral noise alone are shown by the filled triangles. These physiological data clearly fell above the simulated data for the ∆G = 0 dB condition, consistent with the notion that the ipsilateral noise used by Kawase et al. elicited the MOCR. The ∆Gs most closely corresponding to their ipsilateral noise data were between 0 and −5 dB, −10 and −15 dB, and −20 and −25 dB for noise levels of 10, 20, and 30 dB SL, respectively. In their contralateral noise condition (open triangles), the contralateral noise was fixed at a spectrum level of approximately 30 dB. The addition of contralateral noise increased d' relative to the ipsilateral-only condition, and thus suggests a larger estimated reduction in gain (by 2–3 dB at the two lower levels, and less at the highest level). As discussed in the “Methods” section, these estimates of gain reduction in the neurophysiological data may represent underestimates of the strength of the MOCR effect; unlike the model predictions, the neurophysiological data were measured using sequentially increasing tone levels, which could have reduced the AN fiber responses somewhat for the highest tone levels (Guinan and Stankovic 1996).
In Figure 7, d' is compared across SR groups for noise levels that are 50–70 dB above threshold for the high-SR fiber (i.e., 67–87 dB SPL). As in Figure 5, the ordinate is scaled equivalently across the three SR groups. In the ∆G = 0 dB condition, only the low-SR fiber reached a d' above 1. In other words, when the OHC gain was not reduced, these individual high- and medium-SR fibers were not predicted to reach detection threshold. In contrast, when OHC gain was reduced, the medium- and high-SR fibers were predicted to reach detection threshold in noise levels as high as 50 dB SL (67 dB SPL) for the high-SR fiber and 70 dB SL (87 dB SPL) for the medium-SR fiber.
FIG. 7.
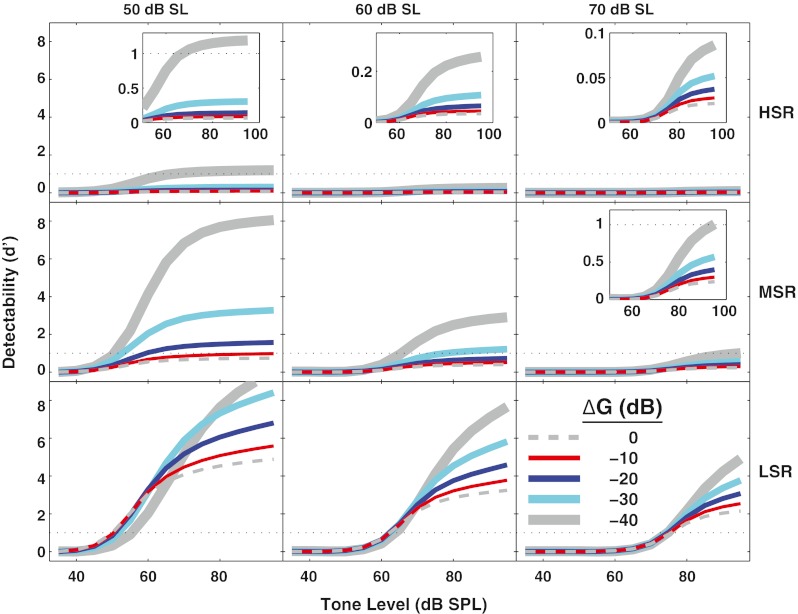
Detectability improved with outer hair cell (OHC) gain reduction as in Figure 6, but shown here for all spontaneous rate (SR) groups and for higher noise levels. Detectability (d') for a tone in noise for high-SR (top row), medium-SR (middle row), and low-SR (bottom row) fibers with a characteristic frequency of 8 kHz. Different thicknesses represent different amounts of OHC gain reduction in 10 dB steps. Increasing noise levels (in dB SL) are shown above the panels. Horizontal dotted line (d' = 1) represents detection threshold. Insets with a magnified scale show that the same effects occur (albeit smaller) when fibers are near saturation.
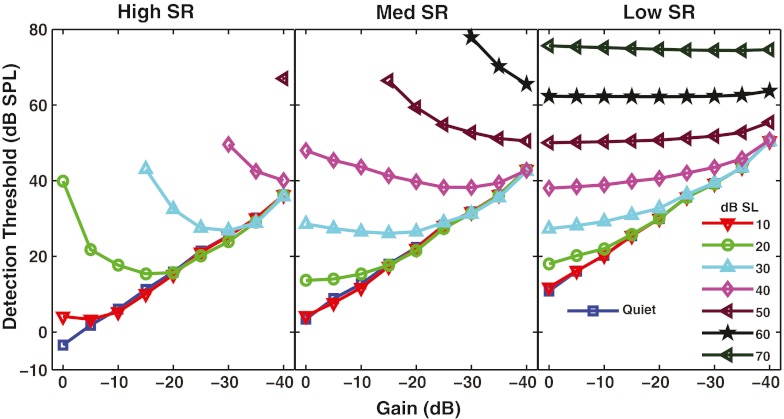
In Figure 8, detection thresholds estimated from the model predictions are shown as a function of background noise level and ∆G. Results are shown for high-, medium-, and low-SR fibers (panels) with a CF of 8 kHz. Looking first at the results in the full-gain condition (∆G = 0 dB), in quiet or in the lowest level of background noise, the high-SR fiber showed the lowest threshold. In noise levels of 20 dB SL or higher, full-gain thresholds were lower for the medium- and low-SR fibers. This finding is consistent with the data of Young and Barta (1986), who also found that low- and medium-SR fibers had lower thresholds than high-SR fibers in background noise. As has been shown in previous figures, the effect of ∆G depended on the level of background noise. When there was no background noise (squares), or at a low SL such as 10 dB (downward triangles), decreasing OHC gain increased detection threshold. When there was more background noise, however, this was not always the case. For the high-SR fiber in a noise level of 20 dB SL (circles), threshold was much higher than for the medium- or low-SR fiber when the OHC gain was maximal. As OHC gain was decreased by up to 20 dB, threshold for the high-SR fiber improved relative to the ∆G = 0 dB condition. Looking across the three panels, it can be seen that without a decrease in OHC gain, the medium-SR fiber had the lowest threshold for the tone, as was reported by Young and Barta (1986) for anesthetized cats. However, when OHC gain was decreased to simulate the MOCR (e.g., by 20–30 dB for a 20-dB-SL masker), the high-SR fiber had a lower threshold than either the medium- or low-SR fiber.
FIG. 8.
High spontaneous rate (SR) fibers can aid tone detection in noise when outer hair cell (OHC) gain is reduced by a physiologically realistic amount. Detection threshold is shown as a function of OHC gain reduction. Different noise levels (in decibel sound level) are shown by different symbols (and colors), and fibers with different SRs are shown in the different panels. All fibers had a characteristic frequency of 8 kHz.
OHC gain reduction can also widen the dynamic range
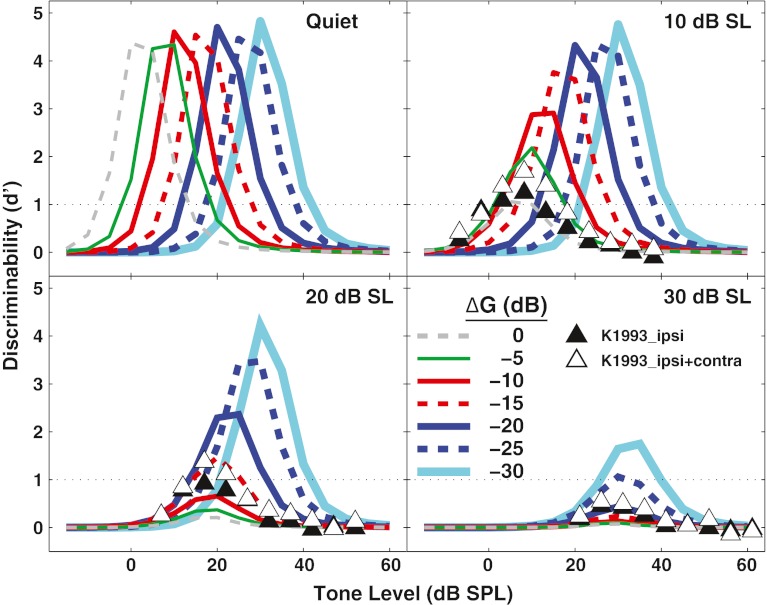
In many real-world listening situations, changes in sound intensity are discriminated at levels well above threshold. Thus, the potential effects of the MOCR on discriminability of intensity increments above threshold were simulated. In Figure 9, d' for discrimination of a 5-dB intensity increment, as calculated from Eq. 2, is shown for a high-SR fiber. This is the same discriminability increment examined by Kawase et al. (1993). The full-gain condition is shown by the thin dashed line labeled ∆G = 0 dB. The thicker lines (both solid and dotted) show systematic reduction in OHC gain in 5-dB steps. The maximum d' occurred when the increment was on the steepest part of the detectability function (shown in Fig. 6). For example, in the upper left panel, it can be seen that in quiet, the maximum d' was just above 0 dB SPL in the full-gain condition, corresponding to the steepest part of the detectability function for this condition in Figure 6. In this context, the term “dynamic range” was defined as the range of tone levels where discriminability d' was equal to or greater than 1. In quiet, the entire discriminability curve shifted to higher levels as OHC gain was reduced (consistent with an increase in detection threshold, Fig. 6). Despite this shift, the width of the dynamic range remained approximately constant at ∼20 dB.
FIG. 9.
Decreasing outer hair cell (OHC) gain can improve discrimination in noise and widen the dynamic range for individual auditory nerve fibers. Discriminability (d') for a 5-dB increment in tone level is shown for a high spontaneous rate fiber with a characteristic frequency of 8 kHz. The thin dashed line shows results when the OHC gain is full on (i.e., ∆G = 0 dB, simulating the no-MOCR condition). The solid and dashed lines with increasing thickness show results as OHC gain is decreased to simulate the MOCR. The noise level increases across panels. A d' of 1 was designated as threshold, shown by the horizontal dotted line. Filled and open triangles show physiological data from Kawase et al. (1993) without and with the fixed-level contralateral noise, as in Figure 6.
Discriminability curves simulated in 10 dB SL of background noise are displayed in the top right panel of Figure 9. In the full-gain condition, the dynamic range was narrow. When OHC gain was decreased by 5 or 10 dB, the lower end of the dynamic range did not change (consistent with no detection threshold elevation, Fig. 6); however, the mid- to upper end of the dynamic range widened to include higher tone levels. Further decreases in OHC gain kept the width of the dynamic range constant, but shifted the entire curve to higher levels. The same effect can be seen in the lower left panel, for a noise level of 20 dB SL. Here, a ∆G of −15 dB was required for d' to increase above 1. In the lower right panel, where the noise was 30 dB SL, OHC gain needed to be decreased by 30 dB to achieve a d' above 1. As in Figure 6, data from Kawase et al. (1993) are plotted as symbols (open and closed triangles) in the appropriate panels. The ∆Gs most closely corresponding to the Kawase et al. ipsilateral noise data were between 0 and −5 dB, −10 and −15 dB, and −20 and −25 dB for noise levels of 10, 20, and 30 dB SL, respectively, as in Figure 6.
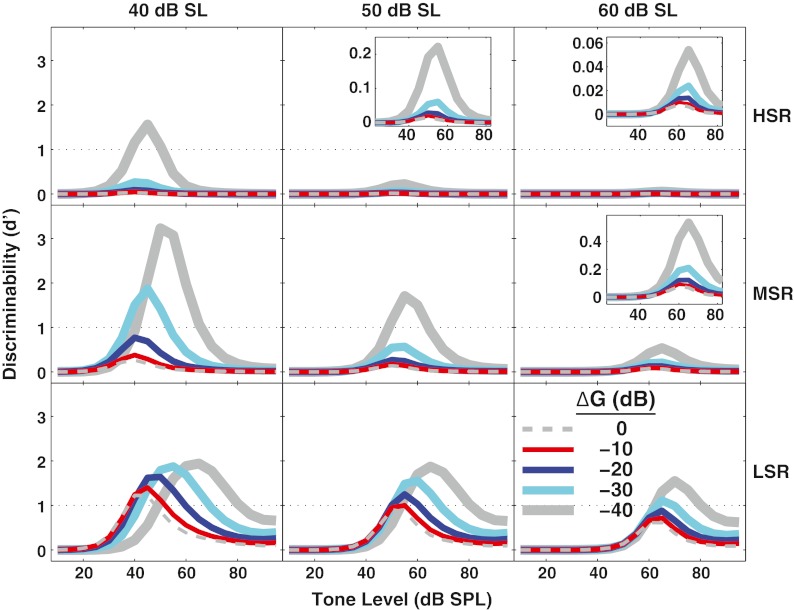
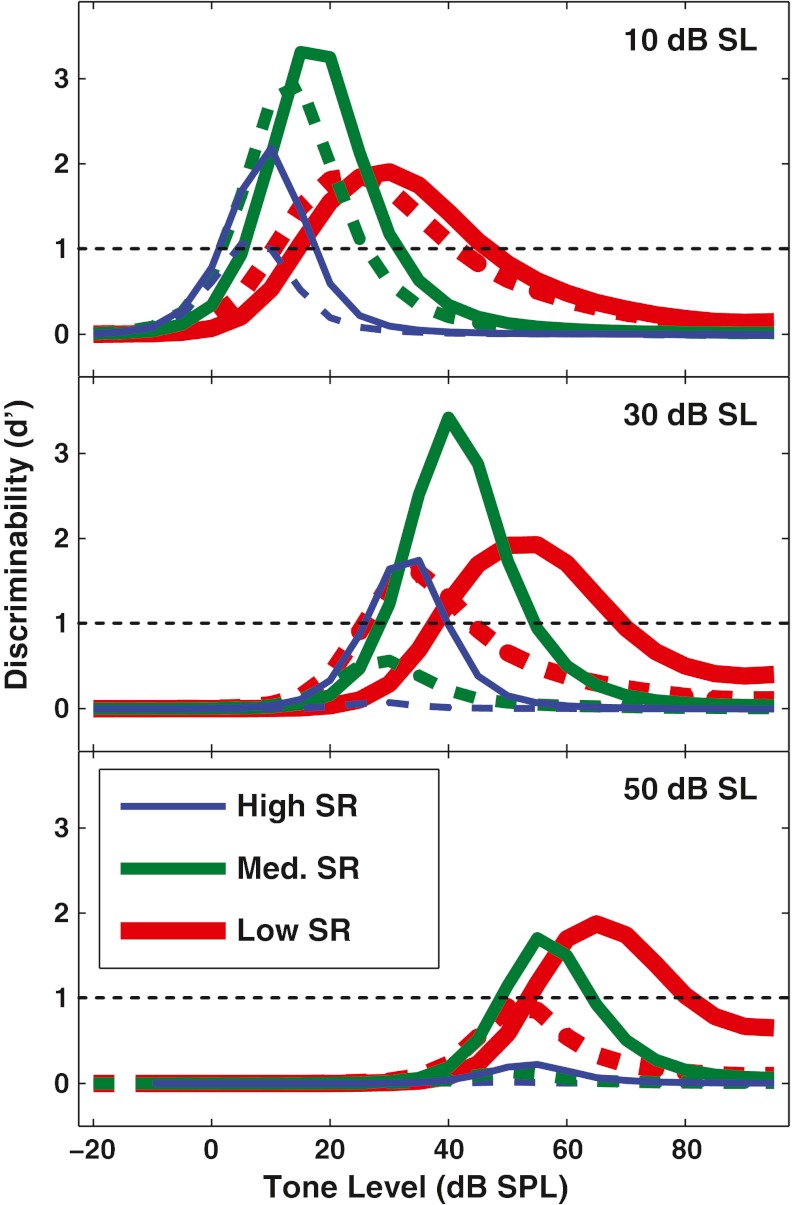
Figure 10 shows d' for discriminability for noise levels of 40, 50, and 60 dB SL for high-, medium-, and low-SR fibers (across the different rows). With maximum OHC gain (i.e., ∆G = 0 dB, simulating the no-MOCR condition), even in the lowest level of noise shown (i.e., 40 dB SL), only the low-SR fiber reached a d' of 1, and the dynamic range was small. Decreasing OHC gain by up to 40 dB resulted in d' for the high- and medium-SR fibers rising above 1 for the lowest levels of noise shown here, suggesting that these fibers may be able to encode intensity changes in relatively high levels of noise. Moreover, the low-SR fiber showed d' >1 for large OHC gain reductions up to the highest noise level shown (i.e., 60 dB SL).
FIG. 10.
At higher noise levels, outer hair cell gain reduction improves discrimination in all spontaneous rate (SR) groups, with the largest effect for unsaturated low-SR fibers. Discriminability (d') is shown as a function of tone level as in Figure 9, but for all SR groups and for higher noise levels. Noise levels (in dB SL) are shown above the panels. Horizontal dotted line (d' = 1) represents discrimination threshold. Insets with a magnified scale illustrate the same effects occur (although smaller) for fibers near saturation in response to the noise.
The model simulations were used to predict how much OHC gain would need to be reduced, in a given level of noise, to maximize the dynamic range for discrimination while maintaining detection threshold. The ∆G value corresponding to this “optimal discriminability” criterion will be referred to as the “optimal gain reduction.” Specifically, the optimal gain reduction was defined as the decrease in OHC gain that maximized the width of the dynamic range while keeping the lower end of this range within 0.5 dB of its value in the full-gain condition (i.e., to keep detection threshold from increasing significantly). Gain reductions up to 40 dB were evaluated to avoid reducing gain more than would be consistent with MOCR physiology (see “Methods” section). In Figure 11, discriminability curves for a high-, medium-, and low-SR fiber are shown in the ∆G = 0 dB condition (dashed curves) and with optimal OHC gain reduction (solid curves). As in previous figures, a d' of 1 was designated as threshold for discriminability. The total dynamic range for all SR groups was defined as the union of the dynamic ranges for the individual SR groups, i.e., the level range over which at least one SR fiber had d' ≥ 1.
FIG. 11.
The dynamic range for discrimination in noise (pooled across all spontaneous rate (SR) groups) increased with outer hair cell (OHC) gain reduction. Discriminability (d') for a 5-dB increment in tone level is plotted as a function of tone level for high-SR (thinnest), medium-SR (medium width), and low-SR (thickest) fibers with a characteristic frequency of 8 kHz. The horizontal dotted line at d' = 1 represents discrimination threshold. Dashed curves show results with no OHC gain reduction, whereas solid curves show results with a single (“optimal”) OHC gain reduction applied to all SR groups. The optimal gain reduction was defined as the decrease in OHC gain that maximized the entire dynamic range (d' ≥ 1) while not shifting the lower end of the range by more than 0.5 dB. The optimal OHC gain reductions were ∆G = 5, 30, and 40 dB for the 10-, 30-, and 50-dB SL noise levels shown across the three rows.
In the top panel, the noise level was 10 dB SL (relative to threshold for the high-SR fiber). For the ∆G = 0 dB condition and this low noise level, the high-SR fiber had a very small dynamic range of only a few dB. For the medium- and low-SR fibers, the combined dynamic range covered levels from 0 to 40 dB SPL. With the optimal OHC gain reduction (solid curves), the maximum d' for the high-SR fiber increased while the lower end remained fixed. Thus, in this reduced OHC gain condition, the high-SR fiber was able to discriminate increments above the lowest tone levels. For the medium-SR and low-SR fibers, the discriminability curves shifted to the right. The consequence is that the dynamic range of the three-fiber population (i.e., the “pooled” dynamic range) was increased by decreasing the OHC gain, while detection threshold was not shifted.
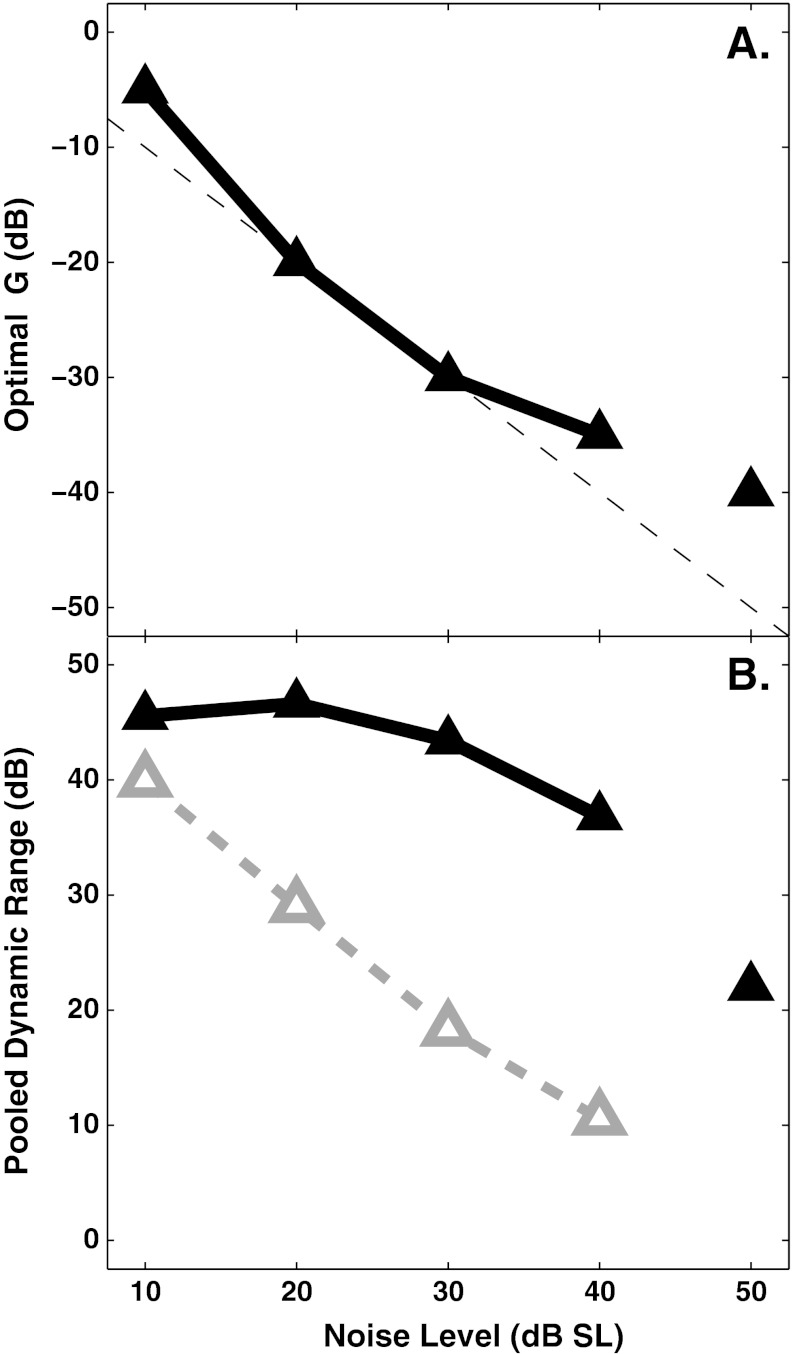
The middle and bottom panels show results for higher noise levels. The dynamic range for the ∆G = 0 dB condition (dashed lines) became smaller as noise level was increased, whereas it stayed large for the optimal-gain conditions. With increasing noise level, the optimal decrease in OHC gain increased roughly linearly (Fig. 12A), except at the highest noise level (50 dB SL) where the gain reduction asymptotes due to the criterion of using gain reduction values less than or equal to 40 dB. The dynamic range predictions with full OHC gain and with optimal OHC gain are shown as a function of noise level in Figure 12B. With full OHC gain (open triangles), the dynamic range decreased substantially as noise level increased. With optimal OHC gain (filled triangles), the dynamic range stayed roughly constant for masker levels up to 40 dB SL. For a masker level of 50 dB SL, there was no discriminability dynamic range for ∆G = 0 dB, but a predicted dynamic range of over 20 dB with an OHC gain reduction of 40 dB (the highest amount considered in the present study, as described above).
FIG. 12.
Decreasing OHC gain as noise level increases can maintain the dynamic range for discrimination in noise across a wide range of masker levels. Data points at 50 dB are not connected because “optimal” gain could not be estimated precisely due to ΔG being limited to the range between 0 and −40 dB. A The optimal ΔG, in dB, is nearly linearly related to noise level in dB SPL. B The dynamic range (pooled across all spontaneous rate groups, see Fig. 11) is plotted as a function of noise level for conditions with (solid) and without (dashed) OHC gain reduction, i.e., with or without the simulated MOCR.
Discussion
Simulating the main effect of the MOCR by reducing OHC gain in the AN model was successful at accounting for the anti-masking effects of contralateral noise on AN fibers (Kawase et al. 1993). This approach lends itself to predicting the answers to several questions related to the MOCR including (1) the strength of the ipsilateral pathway in terms of OHC gain change, (2) the role of high-SR fibers for detection in sustained background noise, and (3) the effects of OHC gain reduction on the dynamic range for discrimination in noise across different SR groups (i.e., the pooled dynamic range).
Estimating OHC gain reduction from physiological data on MOCR effects
As mentioned in the “Introduction” section, the relationship between elicitor level and the decrease in OHC gain by the MOCR under natural conditions has not been established. In the environment, the MOCR in one ear would typically be evoked by sound coming into that ear (ipsilateral stimulation) and also sound coming into the other ear (contralateral stimulation). In cats, the ipsilateral reflex is two to three times stronger than the contralateral reflex, although in humans, they may be closer to equal (Guinan 2006). Although the magnitude of the ipsilateral effect due to shocking the MOC bundle has been measured, it is methodologically more difficult to evaluate quantitatively the ipsilateral effect using sound as an elicitor. An example of this difficulty is illustrated in the Kawase et al. (1993) study, where the ipsilateral noise may have produced multiple effects. For example, the ipsilateral noise may have (1) elicited the ipsilateral MOCR, (2) produced an excitatory response in AN fibers, which decreased the change in discharge rate in response to the tone, and (3) suppressed the tone. Although several studies have separated the elicitor from the signal either in time or in frequency in order to be able to compare ipsilateral and contralateral effects (Liberman et al. 1996; Maison and Liberman 2000; Lilaonitkul and Guinan 2009), these approaches based on otoacoustic emissions (OAEs) do not provide a direct estimate of the decrease in OHC gain produced by the ipsilateral MOC pathway when elicited by sound (Puria et al. 1996; Guinan 2006).
Kawase et al. (1993) examined the effects of the MOCR by presenting a sound contralateral to the measurement ear. This approach has been useful in determining many characteristics of the MOCR, such as the time course and level dependence (Backus and Guinan 2006), decompression in the AN (Kawase et al. 1993), and CAP response (Dolan and Nuttall 1988; Kawase and Liberman 1993). Despite this, the contralateral noise technique is limited in terms of the results measured being restricted to the contralateral MOCR. This limitation is because the baseline condition used in this technique is likely to elicit the ipsilateral MOCR itself, i.e., presenting contralateral noise produces an increase in MOCR strength relative to the ipsilateral baseline. This suggests that the contralateral noise technique is unable to reveal the respective reflex strengths of the ipsilateral and contralateral MOCR pathways independently.
In the present study, it was possible to estimate the strength of the ipsilateral MOCR from the Kawase et al. (1993) data, as well as the combined effects of the ipsilateral and contralateral MOCR. By comparing the Kawase et al. data to the present modeling predictions with systematic variations in OHC gain reduction, it was estimated that the largest reduction in gain in the Kawase et al. study was approximately 20 dB for the ipsilateral noise, and up to 25 dB with contralateral noise added to the ipsilateral noise (Fig. 6). This estimate of the magnitude of the MOCR evoked by a high-level noise elicitor is in the same range as typical effects observed when shocking the MOC bundle (e.g., Russell and Murugasu 1997). The relationship between estimated OHC gain reduction and elicitor level was nearly linear in the case of the Kawase et al. data and for the present study, as shown in Figure 12A. Brown et al. (2010) also predicted a linear relation between noise level and the efferent attenuation that maximized speech recognition. These results are consistent with OAE data suggesting a linear growth in MOCR strength (as estimated in units of percent of maximum OAE amplitude) with increased elicitor level (Backus and Guinan 2006).
A reinterpretation of the role of high-SR AN fibers and effects at threshold
Young and Barta (1986) found that thresholds estimated by SDT for high-SR fibers were higher than those for medium-SR and low-SR fibers in even low levels of noise. This suggests that low- and medium-SR fibers may be used for detection and discrimination in noise. This finding is puzzling given that the largest proportion of AN fibers have high SRs, although a physiologically plausible mechanism has been proposed for selective processing of medium- and low-SR fibers in conditions where high-SR fibers are saturated (Winslow et al. 1987; Lai et al. 1994). However, as Young and Barta acknowledged, the anesthesia used in their preparation was likely to have greatly reduced the MOCR. The present study showed that in noise levels up to 30 dB SL, model high-SR fibers can have thresholds as low as or lower than medium- and low-SR fibers when the MOCR is simulated by reducing OHC gain (as shown in Fig. 8).
The analyses done in this paper evaluated model-based high-, medium-, and low-SR AN fiber responses. In the cat auditory system, the representation of different spontaneous rates within a population is estimated at 61% high, 23% medium, and 16% low (Liberman 1978). In a recent study, Jennings et al. (2011) simulated a detection task using SDT and a weighted combination of SR groups within the population response of model AN fibers. The results of the simulations were compared to human psychophysical data for two conditions that varied slightly from the present study. The tone was presented at a delay of 2 or 200 ms from the onset of the noise. In psychophysical data, threshold for the tone improves with delay from noise onset, a phenomenon that has been called overshoot or the temporal effect. The MOCR has been hypothesized as a potential mechanism for overshoot (Schmidt and Zwicker 1991; von Klitzing and Kohlrausch 1994). Jennings et al. (2011) tested this hypothesis with the AN model by setting ∆G = 0 dB in the 2-ms delay condition (i.e., simulating the inability of the MOCR to respond that quickly). In the 200-ms condition, OHC gain was reduced linearly with increased noise level. Overshoot was predicted by the AN model only if high-SR fibers were included in the detection process. If these fibers were excluded, overshoot was not observed. This finding is consistent with the idea that high-SR fibers may be useful in a much higher level of background noise than had been previously thought (Messing et al. 2009).
OHC gain reduction by the MOCR may maintain a large dynamic range across different levels of background noise
The noise levels reported in the Kawase et al. (1993) study were set relative to threshold for each high-, medium-, and low-SR fiber. This approach makes it difficult to compare the effect of the noise across SR groups since each fiber has a different threshold and thus a different noise level. Also, MOCR strength depends on the level of the elicitor; therefore, comparing fibers in terms of sensation level results in differing degrees of MOCR strength across SR groups. In the present simulations, the noise level was set relative to the threshold for the high-SR fiber. In this way, the effect of noise level on the pooled dynamic range could be predicted. The simulations from Figures 11 and 12 suggest that OHC gain reduction by the MOCR may preserve the pooled dynamic range as background noise levels increase. This effect would be predicted, whether the pooling was done as a weighted combination of SR groups (e.g., Jennings et al. 2011) or through a selective processing mechanism (Winslow et al. 1987; Lai et al. 1994).
The dynamic range of most AN fibers in anesthetized animals is roughly 30 dB (i.e., similar to that for the model simulations with full gain, shown in Fig. 12B by open triangles). The puzzling observation that this dynamic range decreases dramatically in noise has been called the “dynamic range problem” because behavioral results show that intensity changes are detectable up to high levels or in noise (e.g., Viemeister 1988). Recent data have shown that there may be dynamic range adaptation based on average sound intensity at various stages of the auditory pathway (Dean et al. 2005; Wen et al. 2009). The MOCR may be a mechanism contributing to this adaptation at an early stage in the auditory periphery. The filled triangles in Figure 12 show that decreasing OHC gain in an “optimal” way to maximize discriminability can dramatically increase the dynamic range relative to simulations with full OHC gain (ΔG = 0 dB). For speech stimuli, this increase in dynamic range may lead to an improvement in signal-to-noise ratio and speech understanding in noise (Messing et al. 2009; Brown et al. 2010).
Implications for modeling MOCR effects with hearing loss
Most current models of the auditory periphery do not explicitly include the efferent system. The AN model used in the present study includes the COHC parameter, which allows simulation of OHC impairment. It also includes a CIHC parameter, which similarly allows simulation of IHC impairment. The COHC parameter was adjusted in the present study to simulate the gain reduction effects of the MOCR. In quiet and at the lowest noise levels, this adjustment shifted detection threshold and resulted in a “hearing impairment” (Figs. 6 and 8). At moderate to high levels of noise, a reduction in gain improved detection and discrimination (Figs. 7, 8, and 10). These predictions suggest that when OHC gain is reduced appropriately, hearing is not necessarily “impaired,” but in fact can be improved. The modeling predictions presented in this paper suggest that a dynamic adjustment of OHC gain can improve performance in noise. Further research is needed to understand how static decreases in COHC and CIHC associated with SNHL interact with the dynamic changes in OHC gain associated with the MOCR. This approach was implemented by Jennings et al. (2011) and correctly predicted a reduction in overshoot with hearing impairment.
Extending the model to include the time course of the MOCR
The most recent version of this AN model has incorporated long-term (several hundred milliseconds or more) adaptation by including power-law dynamics in the synapse (Zilany et al. 2009). Although this adaptation has been shown to shift the dynamic range of AN fibers (Zilany and Carney 2010), including such an adaptation in the current simulations would not alter the conclusions of the present study. Using a simpler AN model, the present study has shown the feasibility of using OHC gain reduction to account for MOCR-based anti-masking effects. In this context, the model is simpler due to its lack of the fractional Gaussian noise component that can complicate a simple demonstration of MOCR on/off effects. In future modeling work on the time course of the MOCR, it will be important to include the longer-term power-law dynamics that may be relevant for complex, non-stationary sounds such as speech and that may add to the MOCR dynamic range effects (see Jennings et al. 2011).
Acknowledgments
This research was funded by NIH-NIDCD R01-DC008327 awarded to E.A. Strickland.
Contributor Information
Ananthakrishna Chintanpalli, Email: cananthk@purdue.edu.
Skyler G. Jennings, Email: Skyler.Jennings@hsc.utah.edu
Michael G. Heinz, Email: mheinz@purdue.edu
Elizabeth A. Strickland, Phone: +1-765-4943804, FAX: +1-765-4940771, Email: estrick@purdue.edu
References
- Backus BC, Guinan JJ., Jr Time-course of the human medial olivocochlear reflex. J Acoust Soc Am. 2006;119:2889–2904. doi: 10.1121/1.2169918. [DOI] [PubMed] [Google Scholar]
- Boyev KP, Liberman MC, Brown MC. Effects of anesthesia on efferent-mediated adaptation of the DPOAE. J Assoc Res Otolaryngol. 2002;3:362–373. doi: 10.1007/s101620020044. [DOI] [PMC free article] [PubMed] [Google Scholar]
- Brown GJ, Ferry RT, Meddis R. A computer model of auditory efferent suppression: implications for the recognition of speech in noise. J Acoust Soc Am. 2010;127:943–954. doi: 10.1121/1.3273893. [DOI] [PubMed] [Google Scholar]
- Bruce IC, Sachs MB, Young ED. An auditory-periphery model of the effects of acoustic trauma on auditory nerve responses. J Acoust Soc Am. 2003;113:369–388. doi: 10.1121/1.1519544. [DOI] [PubMed] [Google Scholar]
- Carney LH. A model for the responses of low-frequency auditory-nerve fibers in cat. J Acoust Soc Am. 1993;93:401–417. doi: 10.1121/1.405620. [DOI] [PubMed] [Google Scholar]
- Dean I, Harper NS, McAlpine D. Neural population coding of sound level adapts to stimulus statistics. Nat Neurosci. 2005;8:1684–1689. doi: 10.1038/nn1541. [DOI] [PubMed] [Google Scholar]
- Dolan DF, Nuttall AL. Masked cochlear whole-nerve response intensity functions altered by electrical stimulation of the crossed olivocochlear bundle. J Acoust Soc Am. 1988;83:1081–1086. doi: 10.1121/1.396052. [DOI] [PubMed] [Google Scholar]
- Ferry RT, Meddis R. A computer model of medial efferent suppression in the mammalian auditory system. J Acoust Soc Am. 2007;122:3519–3526. doi: 10.1121/1.2799914. [DOI] [PubMed] [Google Scholar]
- Ghitza O, Messing D, Delhorne L, Braida LD, Bruckert E, Sondhi M. Towards predicting consonant confusions of degraded speech. In: Kollmeier B, Klump G, Hohmann V, Langemann U, Mauermann M, Uppenkamp S, Verhey J, editors. Hearing, from sensory processing to perception. Berlin: Springer; 2007. pp. 541–550. [Google Scholar]
- Green DM, Swets JA. Signal detection theory and psychophysics. New York: Kreiger; 1966. [Google Scholar]
- Guinan JJ., Jr Olivocochlear efferents: anatomy, physiology, function, and the measurement of efferent effects in humans. Ear Hear. 2006;27:589–607. doi: 10.1097/01.aud.0000240507.83072.e7. [DOI] [PubMed] [Google Scholar]
- Guinan JJ, Jr, Stankovic KM. Medial efferent inhibition produces the largest equivalent attenuations at moderate to high sound levels in cat auditory-nerve fibers. J Acoust Soc Am. 1996;100:1680–1690. doi: 10.1121/1.416066. [DOI] [PubMed] [Google Scholar]
- Heinz MG. Computational modeling of sensorineural hearing loss. In: Meddis R, Lopez-Poveda EA, Fay RR, Popper AN, editors. Computational models of the auditory system. New York: Springer; 2010. pp. 177–202. [Google Scholar]
- Heinz MG, Zhang X, Bruce IC, Carney LH. Auditory nerve model for predicting performance limits of normal and impaired listeners. ARLO. 2001;2:91–96. doi: 10.1121/1.1387155. [DOI] [Google Scholar]
- Heinz MG, Colburn HS, Carney LH. Quantifying the implications of nonlinear cochlear tuning for auditory-filter estimates. J Acoust Soc Am. 2002;111:996–1011. doi: 10.1121/1.1436071. [DOI] [PubMed] [Google Scholar]
- Jennings SG, Heinz MG, Strickland EA. Evaluating adaptation and olivocochlear efferent feedback as potential explanations of psychophysical overshoot. J Assoc Res Otolaryngol. 2011;12:345–360. doi: 10.1007/s10162-011-0256-5. [DOI] [PMC free article] [PubMed] [Google Scholar]
- Kawase T, Liberman MC. Antimasking effects of the olivocochlear reflex. I. Enhancement of compound action-potentials to masked tones. J Neurophys. 1993;70:2519–2532. doi: 10.1152/jn.1993.70.6.2519. [DOI] [PubMed] [Google Scholar]
- Kawase T, Delgutte B, Liberman MC. Antimasking effects of the olivocochlear reflex. II. Enhancement of auditory-nerve response to masked tones. J Neurophys. 1993;70:2533–2549. doi: 10.1152/jn.1993.70.6.2533. [DOI] [PubMed] [Google Scholar]
- Lai YC, Winslow RL, Sachs MB. A model of selective processing of auditory-nerve inputs by stellate cells of the antero-ventral cochlear nucleus. J Comput Neurosci. 1994;1:167–194. doi: 10.1007/BF00961733. [DOI] [PubMed] [Google Scholar]
- Liberman MC. Auditory nerve responses from cats raised in a low-noise environment. J Acoust Soc Am. 1978;63:442–455. doi: 10.1121/1.381736. [DOI] [PubMed] [Google Scholar]
- Liberman MC, Puria S, Guinan JJ., Jr The ipsilaterally evoked olivocochlear reflex causes rapid adaptation of the 2f1–f2 distortion product otoacoustic emission. J Acoust Soc Am. 1996;99:3572–3584. doi: 10.1121/1.414956. [DOI] [PubMed] [Google Scholar]
- Lilaonitkul W, Guinan JJ., Jr Human medial olivocochlear reflex: effects as functions of contralateral, ipsilateral, and bilateral elicitor bandwidths. J Assoc Res Otolaryngol. 2009;10:459–470. doi: 10.1007/s10162-009-0163-1. [DOI] [PMC free article] [PubMed] [Google Scholar]
- Lopez-Poveda EA. Spectral processing by the peripheral auditory system: facts and models. Int Rev Neurobiol. 2005;70:7–48. doi: 10.1016/S0074-7742(05)70001-5. [DOI] [PubMed] [Google Scholar]
- Maison SF, Liberman MC. Predicting vulnerability to acoustic injury with a noninvasive assay of olivocochlear reflex strength. J Neurosci. 2000;20:4701–4707. doi: 10.1523/JNEUROSCI.20-12-04701.2000. [DOI] [PMC free article] [PubMed] [Google Scholar]
- Meddis R. Auditory-nerve first-spike latency and auditory absolute threshold: a computer model. J Acoust Soc Am. 2006;119:406–417. doi: 10.1121/1.2139628. [DOI] [PubMed] [Google Scholar]
- Messing DP, Delhorne L, Bruckert E, Braida LD, Ghitza O. A non-linear efferent-inspired model of the auditory system; matching human confusions in stationary noise. Speech Commun. 2009;51:668–683. doi: 10.1016/j.specom.2009.02.002. [DOI] [Google Scholar]
- Murugasu E, Russell IJ. The effect of efferent stimulation on basilar membrane displacement in the basal turn of the guinea pig cochlea. J Neurosci. 1996;16:325–332. doi: 10.1523/JNEUROSCI.16-01-00325.1996. [DOI] [PMC free article] [PubMed] [Google Scholar]
- Nieder P, Nieder I. Antimasking effect of crossed olivocochlear bundle stimulation with loud clicks in guinea pig. Exp Neurol. 1970;28:179–188. doi: 10.1016/0014-4886(70)90172-X. [DOI] [PubMed] [Google Scholar]
- Puria S, Guinan JJ, Jr, Liberman MC. Olivocochlear reflex assays: effects of contralateral sound on compound action potentials versus ear-canal distortion products. J Acoust Soc Am. 1996;99:500–507. doi: 10.1121/1.414508. [DOI] [PubMed] [Google Scholar]
- Ruggero MA. Response to noise of auditory nerve fibers in the squirrel monkey. J Neurophysiol. 1973;36:569–587. doi: 10.1152/jn.1973.36.4.569. [DOI] [PubMed] [Google Scholar]
- Russell IJ, Murugasu E. Medial efferent inhibition suppresses basilar membrane responses to near characteristic frequency tones of moderate to high intensities. J Acoust Soc Am. 1997;102:1734–1738. doi: 10.1121/1.420083. [DOI] [PubMed] [Google Scholar]
- Schalk TB, Sachs MB. Nonlinearities in auditory-nerve fiber responses to bandlimited noise. J Acoust Soc Am. 1980;67:903–913. doi: 10.1121/1.383970. [DOI] [PubMed] [Google Scholar]
- Scharf B, Magnan J, Chays A. On the role of the olivocochlear bundle in hearing: 16 case studies. Hear Res. 1997;103:101–122. doi: 10.1016/S0378-5955(96)00168-2. [DOI] [PubMed] [Google Scholar]
- Schmidt S, Zwicker E. The effect of masker spectral asymmetry on overshoot in simultaneous masking. J Acoust Soc Am. 1991;89:1324–1330. doi: 10.1121/1.400656. [DOI] [PubMed] [Google Scholar]
- Siebert WM. Stimulus transformations in the peripheral auditory system. In: Kolers PA, Eden M, editors. Recognizing patterns. Cambridge, MA: MIT Press; 1968. pp. 104–133. [Google Scholar]
- Tan Q, Carney LH. A phenomenological model for the responses of auditory-nerve fibers. II. Nonlinear tuning with a frequency glide. J Acoust Soc Am. 2003;114:2007–2020. doi: 10.1121/1.1608963. [DOI] [PubMed] [Google Scholar]
- Viemeister NF. Intensity coding and the dynamic range problem. Hear Res. 1988;34:267–274. doi: 10.1016/0378-5955(88)90007-X. [DOI] [PubMed] [Google Scholar]
- von Klitzing R, Kohlrausch A. Effect of masker level on overshoot in running- and frozen-noise maskers. J Acoust Soc Am. 1994;95:2192–2201. doi: 10.1121/1.408679. [DOI] [PubMed] [Google Scholar]
- Wen B, Wang GI, Dean I, Delgutte B. Dynamic range adaptation to sound level statistics in the auditory nerve. J Neurosci. 2009;29:13797–13808. doi: 10.1523/JNEUROSCI.5610-08.2009. [DOI] [PMC free article] [PubMed] [Google Scholar]
- Winslow RL, Sachs MB. Effect of electrical stimulation of the crossed olivocochlear bundle on auditory nerve response to tones in noise. J Neurophysiol. 1987;57:1002–1021. doi: 10.1152/jn.1987.57.4.1002. [DOI] [PubMed] [Google Scholar]
- Winslow RL, Barta PE, Sachs MB. Rate coding in the auditory nerve. In: Yost WA, Watson CS, editors. Auditory processing of complex sounds. New York: Erlbaum; 1987. pp. 212–224. [Google Scholar]
- Young ED, Barta PE. Rate responses of auditory nerve fibers to tones in noise near masked threshold. J Acoust Soc Am. 1986;79:426–442. doi: 10.1121/1.393530. [DOI] [PubMed] [Google Scholar]
- Zhang X, Heinz MG, Bruce IC, Carney LH. A phenomenological model for the responses of auditory-nerve fibers: I. Nonlinear tuning with compression and suppression. J Acoust Soc Am. 2001;109:648–670. doi: 10.1121/1.1336503. [DOI] [PubMed] [Google Scholar]
- Zilany MSA, Bruce IC. Modeling auditory-nerve responses for high sound pressure levels in the normal and impaired auditory periphery. J Acoust Soc Am. 2006;120:1446–1466. doi: 10.1121/1.2225512. [DOI] [PubMed] [Google Scholar]
- Zilany MSA, Bruce IC. Representation of the vowel/ε/in normal and impaired auditory nerve fibers: model predictions of responses in cats. J Acoust Soc Am. 2007;122:402–417. doi: 10.1121/1.2735117. [DOI] [PubMed] [Google Scholar]
- Zilany MSA, Carney LH. Power-law dynamics in an auditory-nerve model can account for neural adaptation to sound-level statistics. J Neurosci. 2010;30:10380–10390. doi: 10.1523/JNEUROSCI.0647-10.2010. [DOI] [PMC free article] [PubMed] [Google Scholar]
- Zilany MSA, Bruce IC, Nelson PC, Carney LH. A phenomenological model of the synapse between the inner hair cell and auditory nerve: long-term adaptation with power-law dynamics. J Acoust Soc Am. 2009;126:2390–2412. doi: 10.1121/1.3238250. [DOI] [PMC free article] [PubMed] [Google Scholar]


