

Abstract
Objective
To assess and compare subregional and whole T1rho values (median ± interquartile range) of femorotibial cartilage and menisci in patients with doubtful (Kellgren-Lawrence (KL) grade 1) to severe (KL4) osteoarthritis (OA) at 3T.
Materials and Methods
30 subjects with varying degrees of OA (KL1–4, 13 females, 17 males, mean age ± SD = 63.9 ± 13.1 years) were evaluated on a 3T MR scanner using a spin-lock-based 3D GRE sequence for T1rho mapping. Clinical proton density (PD)-weighted fast spin echo (FSE) images in sagittal (without fat saturation), axial, and coronal (fat-saturated) planes were acquired for cartilage and meniscus Whole-Organ MR Imaging Score (WORMS) grading. Wilcoxon rank sum test was performed to determine whether there were any statistically significant differences between subregional and whole T1rho values of femorotibial cartilage and menisci in subjects with doubtful to severe OA.
Results
Lateral (72±10 milliseconds, median ± interquartile range) and medial (65±10 milliseconds) femoral anterior cartilage subregions in moderate-severe OA subjects had significantly higher T1rho values (P < 0.05) than cartilage subregions and whole femorotibial cartilage in doubtful-minimal OA subjects. There were statistically significant differences in meniscus T1rho values of the medial posterior subregion of subjects with moderate-severe OA and T1rho values of all subregions and the whole meniscus in subjects with doubtful-minimal OA. When evaluated based on WORMS, statistically significant differences were identified in T1rho values between the lateral femoral anterior cartilage subregion in patients with WORMS5–6 (advanced degeneration) and whole femorotibial cartilage and all cartilage subregions in patients with WORMS0–1 (normal).
Conclusion
T1rho values are higher in specific meniscus and femorotibial cartilage subregions. These findings suggest that regional damage of both femorotibial hyaline cartilage and menisci may be associated with osteoarthritis.
Keywords: MRI, Cartilage, T1rho mapping, Meniscus, Osteoarthritis
Introduction
The earliest biochemical changes that occur in osteoarthritis (OA) are molecular modifications within the cartilage matrix without obvious morphological defects (1, 2). The loss of glycosaminoglycans (GAGs) and breakdown of collagen are typical characteristics of early OA.
The pathogenesis and progression of OA result from diseases not only in articular cartilage, but rather in multiple joint tissues including subchondral bone, synovium, and meniscus etc. Hyaline cartilage and menisci are mainly composed of water, collagen, and proteoglycans (PGs) (3, 4). The menisci play a key role in distributing joint forces, load bearing, and enhancing joint stability within the knee joint. Meniscal tears alter joint biomechanics and correlate with an accelerated progression of cartilage degradation in knee OA compared to OA patients without meniscal tears (5, 6).
T1rho (T1Rho or T1ρ- T1 relaxation time in the rotating frame)-weighted MR imaging has recently been proposed as an attractive alternative biomarker to existing conventional morphological MRI methods (2, 4, 7–10). T1rho-weighted MR imaging was first described by Redfield (11), and related techniques have been used to investigate the slow motion interactions between macromolecular protons and bulk water (7, 9). T1rho mapping has been shown to be sensitive to changes in proteoglycan loss in cartilage (9). Previous studies have demonstrated that T1rho cartilage values are elevated in OA patients when compared to corresponding healthy subjects (2, 7, 12). Other investigators evaluated cartilage degeneration using T2 mapping to compare OA patients with and without meniscal tears (5), and compared the differences in T1rho and T2 values in the menisci in both OA patients with varying degrees of cartilage degeneration and healthy controls (3). To the best of our knowledge, there have been no studies that perform quantitative analyses and assessments of subregional and global T1rho values of cartilage and menisci in doubtful-minimal (Kellgren-Lawrence grades 1–2) and moderate-severe (Kellgren-Lawrence grades 3–4) OA patients. In this work, at 3T we measured and compared the subregional and global T1rho values of cartilage and menisci in patients with doubtful to severe OA based on both Whole-Organ MR Imaging Score (WORMS) grading and Kellgren-Lawrence (KL) grading. We hypothesized that in OA patients, T1rho values would be increased within specific focal regions of abnormal cartilage and meniscus and not necessarily increased over the entire region of cartilage and meniscus.
Materials and Methods
Study population
Thirty subjects (n = 17 males and n = 13 females, ranging in age from 27 to 89 years, mean ± SD = 63.9±13.1 years) (Table 1) with normal knees to severe OA based on radiographs [Kellgren-Lawrence (K-L) grading scale 0, 1, 2, 3, and 4 (13, 14)] were recruited. The radiographs were read by an experienced (8 years) musculoskeletal radiologist (_ _) who assigned a KL grade to each knee. The radiographic changes were classified according to the literature as normal (0), doubtful (1), minimal (2), moderate (3) and severe (4) [13, 14]. The changes included marginal osteophytes, narrowing of joint space, sclerosis of subchondral bone, and altered bone contours [n = 7 as KL1, n = 13 as KL2, n = 6 as KL3, n = 4 as KL4]. The subjects were then further divided into two groups as KL1–2 (doubtful-minimal radiographic changes) and KL3–4 (moderate-severe radiographic changes), respectively. The subjects’ body height and weight were obtained in order to calculate the body mass index (BMI). Subjects with a BMI of greater than 24.9 were classified as overweight, and subjects with a BMI of greater than 29.9 were classified as obese (5). The mean BMI of the subjects included in this study was 26.5 ± 4. The BMI was within the normal range in 11 subjects (37%); 11 subjects were overweight (37%) and 8, obese (26%). There were no significant differences (P > 0.05) in BMI between doubtful-minimal (KL1–2) and moderate-severe (KL3–4) OA groups (Table 1). All the subjects provided written informed consent to participate in the study, which was approved by the local institutional review board (IRB).
Table 1.
Characteristics of the Study Population
| Patient Group and Characteristic | Doubtful-minimal OA (KL1–2) | Moderate-severe OA (KL3–4) |
|---|---|---|
| All patients | ||
| No. of patients | 20 | 10 |
| Age (yrs) * | 60.3 ±13.3 | 71.1 ±9.6 |
| BMI (kg/m2) | 26.3 ±4.2 | 26.9 ±3.8 |
| Total WORMS ** | 13.3 ±12.9 | 32.5 ±11.8 |
| Female patients | ||
| No. of patients | 9 | 4 |
| Age (yrs) | 56.7 ±14.8 | 74 ±13 |
| Age range (yrs) | 27–74 | 58–89 |
| Male patients | ||
| No. of patients | 11 | 6 |
| Age (yrs) | 63.2 ±11.9 | 69.2 ±7.3 |
| Age range (yrs) | 47–80 | 60–80 |
Note: WORMS = Whole-Organ MR Imaging Score.
BMI = Body Mass Index.
There were significant differences (P < 0.05) in Total WORMS between doubtful-minimal (KL1–2) and moderate-severe (KL3–4) OA groups.
There were significant differences (P < 0.05) in subjects’ Age between doubtful-minimal (KL1–2) and moderate-severe (KL3–4) OA groups.
Imaging hardware
All MRI experiments were performed on a 3.0T clinical MR scanner (Magnetom Tim Trio, Siemens Medical Solutions, Erlangen, Germany). An 18-cm diameter, 8-channel transmit-receive phased-array knee coil was employed for the imaging measurements.
Imaging protocol
The morphology of the cartilage and the integrity of the meniscus were assessed by acquiring clinical sagittal proton density (PD)-weighted without fat saturation and axial and coronal PD-weighted fast spin echo (FSE) fat-saturated images for cartilage and meniscus Whole-Organ MR Imaging Score (WORMS) grading.
The parameters for the sagittal PD-weighted without fat saturation sequence were: TR/TE = 3030 ms/19 ms, slice thickness = 2.5 mm, number of slices = 35, number of excitations (NEX) = 1, Echo Train Length = 5, FOV = 100 mm, matrix = 512X512, in-plane spatial resolution = 0.19 mm X 0.19 mm, pixel bandwidth = 255 Hz/Pixel, echo train length = 5, acquisition time 2 minutes 4 seconds.
The parameters for the axial PD-weighted FSE fat-saturated sequence were: TR/TE = 3240 ms/19 ms, slice thickness = 2.5 mm, number of slices = 35, NEX = 1, Echo Train Length = 5, FOV = 100 mm, matrix = 512X512, in-plane spatial resolution = 0.19 mm X 0.19 mm, pixel bandwidth = 255 Hz/pixel, echo train length = 5, acquisition time 2 minutes 4 seconds.
The parameters for the coronal PD-weighted FSE fat-saturated sequence were: TR/TE = 3240 ms/19 ms, slice thickness = 2.5 mm, number of slices = 35, NEX = 1, Echo Train Length = 5, FOV = 100 mm, matrix = 512X512, in-plane spatial resolution = 0.19 mm X 0.19 mm, pixel bandwidth = 255 Hz/pixel, echo train length = 5, acquisition time 2 minutes 5 seconds.
For 3D-T1rho Imaging, 3D T1rho-weighted images with parallel imaging (AF = 2) were acquired using the GRE sequence based on the spin-lock technique (2). The scanning parameters were as follows: duration of each 90° pulse = 200 μs, amplitude of the spin-lock pulse = 250 Hz. TR/TE = 175 ms/2.04 ms, spin-lock frequency = 300Hz, number of slices = 30, time of spin-lock (TSL) = 2/10/20/30 ms, slice thickness = 3 mm, matrix = 256X128, FOV = 15 cm, flip angle = 25°, bandwidth = 260 Hz/pixel, acquisition time 5 minutes 58 seconds for each TSL.
MR images analysis and processing
The clinical evaluation of cartilage and the menisci was performed using 2D-sagittal PD-weighted FSE without fat saturation and axial and coronal PD-weighted FSE with fat saturation by an experienced (8 years) musculoskeletal radiologist (by _ _). The radiologist was blinded to subjects’ specific information, K–L scores, and T1rho relaxation data. Meniscal scoring was performed using the WORMS grading as defined in (5, 15): grade 0, normal meniscus; grade 1, increased signal, no tear; grade 2, small radial tear; grade 3, single tear; grade 4: complex tear; grade 5, displaced tear; grade 6, macerated meniscus. Cartilage scoring was performed using the WORMS grading as defined in (15): 0 = normal thickness and signal; 1 = normal thickness but increased signal; 2.0 = partial thickness focal defect <1 cm in greatest width; 2.5 = full thickness focal defect <1 cm in greatest width; 3 = multiple areas of partial thickness (grade 2.0) defects intermixed with areas of normal thickness, or a grade 2.0 defect wider than 1 cm but <75% of the region; 4 = diffuse (≥75% of the region) partial thickness loss; 5 = multiple areas of full thickness loss (grade 2.5) or a grade 2.5 lesion wider than 1 cm but <75% of the region; 6 = diffuse (≥75% of the region) full-thickness loss. Subjects with cartilage and meniscal changes graded as 0 to 1 were assigned as normal, 2 to 4 as early degeneration, and 5 to 6 as advanced degeneration. Representative images of cartilage and meniscus ranging from normal to severe degeneration are shown in Fig. 1 and Fig. 2, respectively.
Fig. 1.

Representative cartilage images from normal cartilage to severe cartilage degeneration based on WORMS grading. Arrows mark the location of cartilage lesions. WORMS = 0 for all regions, a) coronal proton density (PD)-weighted FSE fat-saturated, b) lateral and c) medial sagittal PD-weighted without fat saturation; WORMS = 1 for lateral patellar facet, d) axial PD-weighted FSE fat-saturated; WORMS = 2 for medial posterior tibial plateau, e) sagittal PD-weighted without fat saturation; WORMS = 2.5 for medial femoral condyle, f) coronal PD-weighted FSE fat-saturated, g) sagittal PD-weighted without fat saturation; WORMS = 4 for medial femoral central condyle, h) coronal PD-weighted FSE fat-saturated, i) sagittal PD-weighted without fat saturation; WORMS = 5 for lateral patellar facet, j) axial PD-weighted FSE fat-saturated; WORMS = 5 for medial tibial anterior plateau, k) coronal PD-weighted FSE fat-saturated; WORMS = 6 for central tibial plateau, l) coronal PD-weighted FSE fat-saturated, m) sagittal PD-weighted without fat saturation; WORMS = 6 for lateral tibial plateau, n) sagittal PD-weighted without fat saturation.
Fig. 2.
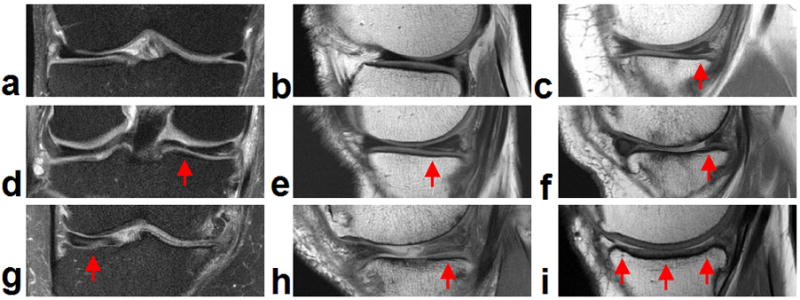
Representative meniscus images from normal meniscus to severe meniscus degeneration based on WORMS grading. Arrows mark the location of meniscus lesions. WORMS = 0 for lateral meniscus, a) coronal proton density (PD)-weighted FSE fat-saturated, b) sagittal PD-weighted without fat saturation; WORMS = 1 for medial posterior horn, c) sagittal PD-weighted without fat saturation; WORMS = 2 for medial posterior horn: radial tear, d) coronal PD-weighted FSE fat-saturated; WORMS = 3 for non-displaced tear of medial posterior horn, e) sagittal PD-weighted without fat saturation; WORMS = 3 for surgical partial repair medial posterior horn, f) sagittal PD-weighted without fat saturation; WORMS = 6 for medial central, g) coronal PD-weighted FSE fat-saturated; WORMS = 6 for medial posterior horn, h) sagittal PD-weighted without fat saturation; WORMS = 6 for complete resection medially, i) sagittal PD-weighted without fat saturation.
For quantitative T1rho assessment, all the MR images were analyzed based on the regional and whole meniscus and femorotibial cartilage. Sixteen subregions and two whole regions for femorotibial cartilage and eight subregions and one entire region for the meniscus were defined in each subject: lateral femoral anterior (LFa), lateral femoral central (LFc), lateral femoral posterior (LFp), medial femoral anterior (MFa), medial femoral central (MFc), medial femoral posterior (MFp), lateral side femoral cartilage (LF), medial side femoral cartilage (MF), femoral cartilage (F), lateral tibial anterior (LTa), lateral tibial central (LTc), lateral tibial posterior (LTp), medial tibial anterior (MTa), medial tibial central (MTc), medial tibial posterior (MTp), lateral side tibial cartilage (LT), medial side tibial cartilage (MT), and tibial cartilage (T) for femorotibial cartilage assessment, and lateral anterior (La), lateral central (Lc), lateral posterior (Lp), medial anterior (Ma), medial central (Mc), medial posterior (Mp), lateral side meniscus (L), medial side meniscus (M), and entire meniscus (Entire) for meniscus assessment as defined in Refs (15,16).
T1rho-weighted images with shortest spin-lock length (TSL = 2 ms) were used for the segmentation of femorotibial cartilage and menisci in both subregions and whole regions. Regions of interest (ROIs) as above defined were segmented manually (by _ _) for each slice for all the subjects. These segmentations were used to draw ROIs for each MR image with different TSL values (2, 7). The in-house developed routines in MATLAB (version 7.1; The Mathworks, Natick, MA, USA) and C++ (version 6.0, Microsoft Corp., USA) were used for offline processing of the acquired MR images. T1rho maps were computed with custom-built MATLAB and C++ routines using the signal expression as shown in Ref. 2.
Although the K–L grading scale can be effective in defining the presence of and estimating the severity of articular cartilage degeneration within the femorotibial joint, in one previous study, it did not identify osteoarthritis in a large number of patients with the disease and had only a moderately strong correlation with the actual degree of articular cartilage degeneration within the femorotibial joint (14). In this study, both K–L and WORMS grading scales were used in the clinical evaluation of cartilage and the menisci. For the WORMS grading of articular cartilage and the meniscus degeneration, the highest WORMS grade was used to represent the severity of osteoarthritis of the tibiofemoral joint (14).
The inter-subject variability of the T1rho maps was quantified using root mean square coefficient of variation percentage (RMS-CV%), and a Wilcoxon rank sum test was performed to determine whether there were any statistically significant differences in T1rho relaxation times between the femorotibial cartilage and the adjacent meniscus (anterior, central, and posterior) in the lateral and medial compartments and entire regions. Because nonparametric analyses were conducted, the T1rho measurement results were summarized as median ± interquartile range. A P-value of less than 0.05 was considered to be statistically significant.
Results
3 subjects were clinically evaluated as WORMS0–1 (normal), 7 as WORMS2–4 (early degeneration), and 20 as WORMS5–6 (advanced degeneration).
Representative T1rho maps of cartilage in the lateral (Fig. 3(a)) and medial (Fig. 3(b)) compartments obtained from a doubtful-minimal OA patient overlaid onto the shortest spin-lock length (TSL = 2 ms), respectively are displayed in Fig. 3(a, b). Similarly, Fig. 3(c–f) shows the representative T1rho maps of menisci in the lateral (Fig. 3(c, d)) and medial (Fig. 3(e, f)) compartments, respectively, obtained from the same subject. Different bar scale ranges for the T1rho mapping of cartilage and meniscus were set to effectively visualize the respective T1rho values distribution.
Fig. 3.

Representative T1rho maps of cartilage in the lateral (a) and medial (b) compartments, and T1rho maps of menisci in the lateral (c, d) and medial (e, f) compartments, respectively, obtained from a doubtful-minimal OA patient. The color bars on the right show the T1rho values ranges, respectively. The different barscale ranges can display the respective T1rho values distribution of cartilage and meniscus more effectively.
Fig. 4(a) shows the box and whisker plots of subregional and whole cartilage T1rho values for patients with doubtful-minimal (KL1–2) and moderate-severe (KL3–4) OA. The box and whisker plot shows the five statistics (minimum, first quartiles, median, third quartiles, and maximum). The T1rho values for individual cartilage subregions and for whole cartilage (LFa, LFc, LFp, MFa, MFc, MFp, LF, MF, F, LTa, LTc, LTp, MTa, MTc, MTp, LT, MT, T) in patients with KL1–2 (doubtful-minimal OA) and KL3–4 (moderate-severe OA) are shown in Table. 2. For KL1–2 (doubtful-minimal OA), the RMS-CV% in the cartilage subregions and over whole cartilage was 10.6, 18.1, 11.7, 21, 18.2, 10.3, 11.1, 14.3, 11.8, 15.8, 14.9, 8.4, 24.1, 13.4, 11.4, 9.4, 9.7, and 8.4, respectively. For KL3–4 (moderate-severe OA), the RMS-CV% in the cartilage subregions and over whole cartilage was 9.4, 11.6, 8.4, 11.7, 21.7, 10.3, 7, 12, 9.1, 13.5, 18.3, 12.6, 15.5, 21.9, 18.5, 8.4, 17.3, and 11.4, respectively.
Fig. 4.

Box and whisker plots of cartilage T1rho values (median ± interquartile range) in the different cartilage subregions and for whole cartilage based on different K–L grades (a) and different WORMS grades (b). The box and whisker plot shows the five statistics (minimum, first quartiles, median, third quartiles, and maximum). Fig. 4(a) $ Significantly different (P < 0.05) between LFa with KL3–4 and all other cartilage subregions and whole femorotibial cartilage with KL1–2 except MFa with KL1–2. * Significantly different (P < 0.05) between MFa with KL3–4 and all other cartilage subregions and whole femorotibial cartilage with KL1–2 except MFa with KL1–2. Fig. 4(b) & Significantly different (P < 0.05) between LFa with WORMS5–6 and all other cartilage subregions and whole femorotibial cartilage with WORMS0–1 except LFa with WORMS0–1. # Significantly different (P < 0.05) between MTp with WORMS grade 0–1 and all other cartilage subregions and whole femorotibial cartilage with WORMS grade 5–6 except LFc, LTc, MTa with WORMS grade 5–6. % Significantly different (P < 0.05) between LFa with WORMS grade 2–4 and all other cartilage subregions and whole femorotibial cartilage with WORMS grade 5–6 except LFa and MFa with WORMS grade 5–6. @ Significantly different (P < 0.05) between LFa with WORMS grade 5–6 and all other cartilage subregions and whole femorotibial cartilage with WORMS grade 2–4 except LFa and MFa with WORMS grade 2–4. ** Significantly different (P < 0.05) between MFa with WORMS grade 5–6 and all other cartilage subregions and whole femorotibial cartilage with WORMS grade 2–4 except LFa and MFa with WORMS grade 2–4.
Table 2.
T1rho values in ms (median ± interquartile range) of cartilage based on KL and WORMS grading
| KL1–2 | KL3–4 | WORMS0–1 | WORMS2–4 | WORMS5–6 | |
|---|---|---|---|---|---|
| LFa | 68 ± 10 | 72 ± 10 | 61 ± 10 | 68 ± 3 | 69 ± 13 |
| LFc | 52 ± 8 | 52 ± 10 | 54 ± 5 | 52 ± 10 | 52 ± 10 |
| LFp | 52 ± 6 | 54 ± 6 | 48 ± 1 | 53 ± 6 | 54 ± 6 |
| MFa | 62 ± 22 | 65 ± 10 | 55 ± 8 | 67 ± 23 | 65 ± 16 |
| MFc | 51 ± 8 | 56 ± 21 | 47 ± 3 | 51 ± 7 | 54 ± 13 |
| MFp | 54 ± 6 | 51 ± 10 | 51 ± 7 | 56 ± 10 | 54 ± 7 |
| LF | 58 ± 9 | 59 ± 4 | 54 ± 5 | 58 ± 7 | 59 ± 9 |
| MF | 55 ± 10 | 57 ± 12 | 51 ± 6 | 56 ± 12 | 57 ± 11 |
| F | 56 ± 8 | 58 ± 7 | 54 ± 4 | 58 ± 8 | 58 ± 9 |
| LTa | 55 ± 10 | 60 ± 17 | 57 ± 10 | 55 ± 12 | 57 ± 10 |
| LTc | 49 ± 9 | 49 ± 14 | 47 ± 1 | 54 ± 6 | 49 ± 13 |
| LTp | 49 ± 6 | 52 ± 11 | 48 ± 7 | 50 ± 4 | 50 ± 8 |
| MTa | 45 ± 16 | 50 ± 12 | 40 ± 11 | 46 ± 19 | 48 ± 17 |
| MTc | 55 ± 10 | 58 ± 17 | 48 ± 15 | 56 ± 9 | 55 ± 11 |
| MTp | 50 ± 5 | 50 ± 11 | 44 ± 10 | 50 ± 3 | 51 ± 8 |
| LT | 52 ± 7 | 56 ± 9 | 53 ± 4 | 52 ± 5 | 55 ± 8 |
| MT | 50 ± 5 | 54 ± 15 | 48 ± 9 | 51 ± 6 | 51 ± 8 |
| T | 51 ± 5 | 54 ± 8 | 51 ± 7 | 52 ± 3 | 51 ± 7 |
Fig. 4(b) shows the box and whisker plots of subregional and whole cartilage T1rho values for patients with OA graded by WORMS (normal as WORMS0–1, early degeneration as WORMS2–4, and severe degeneration as WORMS5–6). The T1rho values for individual cartilage subregions and for whole cartilage in patients with WORMS0–1 (normal), WORMS2–4 (early degeneration), and WORMS5–6 (severe degeneration) are shown in Table. 2. For WORMS0–1 (normal), the RMS-CV% was 10.6, 6.6, 1.9, 10.5, 4.5, 10.3, 6.5, 7.7, 6, 12.1, 2.1, 9.5, 18.6, 21.1, 17.4, 6.4, 14.9, and 10.3, respectively. For WORMS2–4 (early degeneration), the RMS-CV% was 8.9, 26.2, 13, 22.7, 24.3, 11.7, 14.7, 18.1, 15.9, 22.3, 15.2, 6.9, 29.9, 11, 8.7, 9.9, 8.5, and 8.2, respectively. For WORMS5–6 (advanced degeneration), the RMS-CV% was 11.5, 13.1, 9.5, 17.6, 18.9, 9.2, 8.6, 12, 9.4, 13.7, 18.1, 11.9, 19.5, 18.7, 14, 10.3, 14.1, and 10.8, respectively. As shown in Table. 2, the cartilage T1rho values (median ± interquartile range) in the cartilage subregions and over whole cartilage were roughly congruent with the corresponding WORMS scores. Higher cartilage WORMS scores generally associated with slightly higher T1rho values.
Fig. 5(a) shows the box and whisker plots of subregional and whole meniscus T1rho values in patients with doubtful-minimal (KL1–2) and moderate-severe (KL3–4) OA. The T1rho values for subregions of the meniscus and the whole meniscus (La, Lc, Lp, Ma, Mc, Mp, L, M, entire) for patients with KL1–2 and KL3–4 were shown in Table. 3. For KL1–2, the RMS-CV% was 21.7, 20.5, 20.5, 28.6, 21.5, 25, 16.6, 18.5, and 15, respectively. For KL 3–4, the RMS-CV% was 18.8, 8.2, 29, 43.9, 22.1, 18.1, 20.2, 26.6, and 13.8, respectively.
Fig. 5.

Box and whisker plots of meniscus T1rho values (median ± interquartile range) in the different meniscus subregions and for the whole meniscus based on different K–L grades (a) and different WORMS grades (b). Fig. 5(a) * Significantly different (P < 0.05) between Mp with KL3–4 and all other sub-regions and the whole meniscus with KL1–2 except Mp with KL1–2. Fig. 5(b) $ Significantly different (P < 0.05) between Ma with WORMS grade 2–4 and all other sub-regions and the whole meniscus with WORMS grade 0–1 except Ma with WORMS grade 0–1. # Significantly different (P < 0.05) between Ma with WORMS grade 2–4 and all other sub-regions and the whole meniscus with WORMS grade 5–6 except Lc with WORMS grade 5–6.
Table 3.
T1rho values in ms (median ± interquartile range) of meniscus based on KL and WORMS grading
| La | Lc | Lp | Ma | Mc | Mp | L | M | Entire | |
|---|---|---|---|---|---|---|---|---|---|
| KL1–2 | 29 ± 4 | 29 ± 4 | 33 ± 11 | 27 ± 7 | 33 ± 8 | 33 ± 9 | 31 ± 6 | 32 ± 9 | 32 ± 7 |
| KL3–4 | 30 ± 12 | 28 ± 4 | 30 ± 8 | 31 ± 14 | 36 ± 8 | 40 ± 13 | 30 ± 9 | 37 ± 7 | 34 ± 6 |
| WORMS0–1 | 29 ± 6 | 29 ± 4 | 31 ± 5 | 27 ± 10 | 32 ± 10 | 34 ± 5 | 30 ± 3 | 31 ± 9 | 31 ± 7 |
| WORMS2–4 | 29 ± 4 | 32 ± 8 | 34 ± 13 | 25 ± 4 | 34 ± 7 | 31 ± 12 | 30 ± 8 | 31 ± 5 | 30 ± 8 |
| WORMS5–6 | 31 ± 11 | 27 ± 3 | 31 ± 14 | 32 ± 10 | 38 ± 13 | 40 ± 12 | 31 ± 10 | 39 ± 7 | 35 ± 5 |
Similarly, Fig. 5(b) shows the box and whisker plots of subregional and whole meniscus T1rho values in patients with OA graded by WORMS (normal as WORMS0–1, early degeneration as WORMS2–4, and severe degeneration as WORMS5–6). Subregional and whole meniscus T1rho values for patients with WORMS0–1, WORMS2–4, and WORMS5–6 are shown in Table. 3. For WORMS0–1, the RMS-CV% was 20.2, 16.2, 18.3, 34.8, 18.1, 18.6, 16.6, 19.5, and 16.9, respectively. For WORMS2–4, the RMS-CV% was 17.3, 23.9, 20.7, 11.4, 14.6, 33.4, 17.2, 15.5, and 14.8, respectively. For WORMS5–6, the RMS-CV% was 21.6, 8.1, 27.9, 38, 25.2, 18.1, 19.5, 23.5, and 11.2, respectively. The median meniscus T1rho values (for either subregions or whole meniscus) did not appear to be congruent with the corresponding WORMS scores; although meniscus T1rho values with WORMS5–6 were approximately slightly higher than those with WORMS0–1 and WORMS2–4.
As shown in Fig. 4(a), when evaluated based on K–L grading, there were statistically significant differences (P < 0.05) between LFa with KL3–4 and all other cartilage subregions as well as whole femorotibial cartilage regions with KL1–2 except MFa with KL1–2. In a similar fashion, statistically significant differences were also identified between MFa with KL3–4 and all other cartilage subregions as well as whole femorotibial cartilage regions with KL1–2 except MFa with KL1–2. Fig. 4(b) shows that significant differences (P < 0.05) also exist between: LFa in patients graded as WORMS5–6 and all other cartilage subregions as well as whole femorotibial cartilage regions with WORMS0–1 except LFa with WORMS0–1; MTp with WORMS grade 0–1 and all other cartilage subregions and whole femorotibial cartilage with WORMS grade 5–6 except LFc, LTc, MTa with WORMS grade 5–6; LFa with WORMS grade 2–4 and all other cartilage subregions and whole femorotibial cartilage with WORMS grade 5–6 except LFa and MFa with WORMS grade 5–6; LFa with WORMS grade 5–6 and all other cartilage subregions and whole femorotibial cartilage with WORMS grade 2–4 except LFa and MFa with WORMS grade 2–4; MFa with WORMS grade 5–6 and all other cartilage subregions and whole femorotibial cartilage with WORMS grade 2–4 except LFa and MFa with WORMS grade 2–4.
As shown in Fig. 5(a), when evaluated based on K–L grading, there were statistically significant differences (P < 0.05) between Mp with KL3–4 and all other sub-regions and the whole meniscus with KL1–2 except Mp with KL1–2. Fig. 5(b) shows that significant differences (P < 0.05) exist between Ma with WORMS grade 2–4 and all other sub-regions and the whole meniscus with WORMS grade 0–1 except Ma with WORMS grade 0–1; Ma with WORMS grade 2–4 and all other sub-regions and the whole meniscus with WORMS grade 5–6 except Lc with WORMS grade 5–6.
Discussion
In this work, subregional and whole 3T T1rho values of femorotibial cartilage and menisci in patients with doubtful-minimal (KL1–2) and moderate-severe (KL3–4) OA were evaluated and compared together with that of semi-quantitative WORMS scores.
T1rho-weighted MR imaging methods have been recently proposed as an attractive potential biomarker to evaluate the biochemical changes in the cartilage matrix non-invasively. This technique has been used to investigate the slow motion interactions between the macromolecular protons and bulk water protons, as well as chemical exchange between protons in the surrounding environment (4). This method has several advantages over other existing methods (12, 17–19). It can be easily translated to a clinical setting without any hardware modifications and requires no exogenous contrast agent (2). It has been reported that T1rho relaxation time is sensitive to early biochemical changes in cartilage, especially the PG content (2, 4). Although hyaline cartilage and the meniscus contain mainly water, collagen, and PGs, the meniscus has a relatively low PG concentration of 1%–2% (higher collagen content) compared to 5%–10% in that of hyaline cartilage (3). Generally, low GAG means higher T1rho values, and high GAG means lower T1rho values; however, cartilage and menisci have different biochemical, structural and biomechanical properties (2, 3, 4). Changes of T1rho values in menisci may be due to the macromolecular structure and mechanical loading (Table. 3).
The T1rho values of moderate-severe (KL3–4) OA cartilage were generally slightly higher than those of doubtful-minimal (KL1–2) OA cartilage as shown in Fig 4(a) and Table. 2. In contrast, the meniscus T1rho values showed relatively obvious differences between doubtful-minimal (KL1–2) and moderate-severe (KL3–4) OA in the medial compartment compared to the lateral compartment as shown in Fig 5(a) and Table. 3. Of note, we found that T1rho values of cartilage were significantly higher (P < 0.05) on the femoral side (LF, MF, F) with KL3–4 than those on the tibial side (LT, MT, T) with KL1–2, which agrees well with the prior literature (5, 20). Furthermore, in our study the cartilage T1rho values in LFa and MFa subregions in patients with KL3–4 were significantly higher compared to subregional cartilage and whole cartilage T1rho values in patients with KL1–2. When evaluated based on WORMS grading, the cartilage T1rho values in LFa and MFa subregions with WORMS5–6 (advanced degeneration) were also significantly higher compared to subregional and whole cartilage T1rho values in patients with WORMS2–4 (early degeneration), as shown in Fig. 4 and Table 2. On the other hand, the meniscus T1rho values in medial anterior (Ma) subregions with WORMS2–4 were significantly higher than subregional and whole meniscus T1 rho values in patients with both WORMS0–1 and WORMS5–6, as shown in Fig. 5 and Table 3. These findings may indicate that T1rho MR imaging may be a feasible potential biomarker to associate early OA progression with adjacent meniscal tears, and regional meniscus and cartilage deterioration may result in progressive degeneration of whole femorotibial cartilage and the adjacent menisci. An interesting phenomenon in our results was that not all the weight-bearing central femorotibial cartilage subregions (LFc, MFc, LTc, and MTc) had obviously higher T1rho values (lower GAG content due to cartilage degeneration) compared to the neighboring cartilage subregions based on both KL grading (KL1–2, KL3–4) and WORMS grading (WORMS0–1, WORMS2–4, WORMS5–6), as shown in Table 2. This inconsistency may be due to a predominant loss of central weight-bearing superficial cartilage (21, 22) resulting in lower T1rho values in the femorotibial cartilage in patients with moderate-severe OA (KL3–4) compared to those with doubtful-minimal OA (KL1–2), as superficial layer cartilage has higher T1rho values (low GAG content) compared to the radial deep layer cartilage (high GAG content) which has lower T1rho values (23).
This study has some limitations in terms of sample size, without multiple comparison correction in order to optimize statistical power. In addition, a large number of statistical tests were conducted without formal control over the false discovery rate. As a result, the reported results are likely to contain one or more type I errors.
Another measurement error may come from the manually-drawn ROIs (defined as in Fig. 1 and Fig. 9 of Ref. 15, and in Fig.1 of Ref. 16) among the different sub-compartments in femorotibial cartilage and sub-regions in the anterior horn, central, and posterior horn meniscus. Given these measurement limitations in T1rho values, further investigation is required.
All the RMS-CVs of measurement in T1rho values among all the cartilage sub-regions and meniscus sub-regions ranged from 1.9 to 43.9. Some are relatively high, likely because of the small ROI analysis and spatial heterogeneity in signal (4). Semi-automated or automated segmentation of femoral-tibial cartilage and the meniscus will improve the precision of the T1rho MR imaging technique, and this will need to be developed.
Another limitation of this study is that there may be errors in K–L and WORMS grading of cartilage and the meniscus, which is highly subjective. A larger sample size may be one possible solution to this problem. Future work will address the deficiency of small sample size, especially which of moderate-severe OA (KL3–4) subjects (Table 1).
Conclusion
This study demonstrates that there are some statistically significant differences between T1rho values of cartilage and meniscus subregions in the lateral and medial compartments in subjects with doubtful to severe OA. Our preliminary results suggest that there are significant differences in T1rho relaxation times between the lateral and medial femoral anterior cartilage in subjects with moderate-severe OA (KL3–4) and all the other cartilage sub-compartments except MFa in subjects with doubtful-minimal OA (KL1–2) (P < 0.05). There is also a statistically significant increase in the T1rho relaxation time in the medial posterior meniscus in subjects with moderate-severe OA (KL3–4) compared to all the other sub-regions except the medial posterior meniscus in subjects with doubtful-minimal OA (KL1–2). When evaluated based on WORMS, statistically significant differences were identified mostly between T1rho values of cartilage with WORMS5–6 in lateral femoral anterior sub-compartment and cartilage with WORMS0–1 in both the lateral and medial compartments. Statistically significant differences were also identified mostly between T1rho values of cartilage with WORMS5–6 in lateral and medial femoral anterior sub-compartment and cartilage with WORMS2–4 in both lateral and medial compartments. Finally, there were statistically significant differences identified mostly between T1rho values of meniscus of the medial anterior sub-region with early meniscus degeneration (WORMS2–4) and all sub-regions in both lateral and medial compartments with advanced meniscus degeneration (WORMS5–6). These preliminary data could serve as reference standards for future studies and suggest that T1rho might detect meniscal abnormalities in subjects with osteoarthritis.
Acknowledgments
The authors would like to acknowledge the support by research grants RO1 AR053133-01A2 and R21 AR055724-01A2 from the National Institute of Arthritis and Musculoskeletal and Skin Diseases (NIAMS), National Institutes of Health (NIH). Ding Xia, M.Sc, and James S. Babb, Ph.D., from Center for Biomedical Imaging, Department of Radiology, New York University Langone Medical Center, are thanked for technical support and statistical editing.
Footnotes
Publisher's Disclaimer: This is a PDF file of an unedited manuscript that has been accepted for publication. As a service to our customers we are providing this early version of the manuscript. The manuscript will undergo copyediting, typesetting, and review of the resulting proof before it is published in its final citable form. Please note that during the production process errors may be discovered which could affect the content, and all legal disclaimers that apply to the journal pertain.
References
- 1.Menezes NM, Gray ML, Hartke JR, Burstein D. T2 and T1rho MRI in articular cartilage systems. Magn Reson Med. 2004;51:503–509. doi: 10.1002/mrm.10710. [DOI] [PubMed] [Google Scholar]
- 2.Pakin SK, Xu J, Schweitzer ME, Regatte RR. Rapid 3D-T1rho mapping of the knee joint at 3. 0T with parallel imaging. Magn Reson Med. 2006;56:563–571. doi: 10.1002/mrm.20982. [DOI] [PubMed] [Google Scholar]
- 3.Rauscher I, Stahl R, Cheng J, et al. Meniscal Measurements of T1 and T2 at MR Imaging in Healthy Subjects and Patients with Osteoarthritis. Radiology. 2008;249:591–600. doi: 10.1148/radiol.2492071870. [DOI] [PMC free article] [PubMed] [Google Scholar]
- 4.Mosher TJ, Zhang Z, Reddy R, et al. Knee Articular Cartilage Damage in Osteoarthritis: Analysis of MR Image Biomarker Reproducibility in ACRIN-PA 4001 Multicenter Trial. Radiology. 2011;258 (3):832–842. doi: 10.1148/radiol.10101174. [DOI] [PMC free article] [PubMed] [Google Scholar]
- 5.Friedrich KM, Shepard T, de Oliveira VS, et al. T2 Measurements of Cartilage in Osteoarthritis Patients With Meniscal Tears. Am J Roentgenol. 2009;193:W411–W415. doi: 10.2214/AJR.08.2256. [DOI] [PMC free article] [PubMed] [Google Scholar]
- 6.Lange AK, Fiatarone Singh MA, Smith RM, et al. Degenerative meniscus tears and mobility impairment in women with knee osteoarthritis. Osteoarthr Cartilage. 2007;15:701–708. doi: 10.1016/j.joca.2006.11.004. [DOI] [PubMed] [Google Scholar]
- 7.Li X, Benjamin Ma C, Link TM, et al. In vivo T(1rho) and T(2) mapping of articular cartilage in osteoarthritis of the knee using 3T MRI. Osteoarthr Cartilage. 2007;15:789–797. doi: 10.1016/j.joca.2007.01.011. [DOI] [PMC free article] [PubMed] [Google Scholar]
- 8.Regatte RR, Akella SV, Borthakur A, Kneeland JB, Reddy R. In vivo proton MR three-dimensional T1rho mapping of human articular cartilage: initial experience. Radiology. 2003;229:269–274. doi: 10.1148/radiol.2291021041. [DOI] [PubMed] [Google Scholar]
- 9.Regatte RR, Akella SV, Borthakur A, Reddy R. Proton spin-lock ratio imaging for quantitation of glycosaminoglycans in articular cartilage. J Magn Reson Imaging. 2003;17:114–121. doi: 10.1002/jmri.10228. [DOI] [PubMed] [Google Scholar]
- 10.Akella SV, Regatte RR, Gougoutas AJ, et al. Proteoglycan-induced changes in T1rho-relaxation of articular cartilage at 4T. Magn Reson Med. 2001;46:419–423. doi: 10.1002/mrm.1208. [DOI] [PubMed] [Google Scholar]
- 11.Redfield AG. Nuclear Magnetic Resonance Saturation and Rotary Saturation in Solids. Phys Rev. 1955;98:1787–1809. [Google Scholar]
- 12.Blumenkrantz G, Majumdar S. Quantitative magnetic resonance imaging of articular cartilage in osteoarthritis. Eur Cell Mater. 2007;13:76–86. doi: 10.22203/ecm.v013a08. [DOI] [PubMed] [Google Scholar]
- 13.Kellgren JH, Lawrence JS. Radiological assessment of osteo-arthrosis. Ann Rheum Dis. 1957;16:494–502. doi: 10.1136/ard.16.4.494. [DOI] [PMC free article] [PubMed] [Google Scholar]
- 14.Kijowski R, Blankenbaker D, Stanton P, Fine J, Smet AD. Arthroscopic Validation of Radiographic Grading Scales of Osteoarthritis of the Tibiofemoral Joint. Am J Roentgenol. 2006;187:794–799. doi: 10.2214/AJR.05.1123. [DOI] [PubMed] [Google Scholar]
- 15.Peterfy CG, Guermazi A, Zaim S, et al. Whole-Organ Magnetic Resonance Imaging Score (WORMS) of the knee in osteoarthritis. Osteoarthr Cartilage. 2004;12:177–190. doi: 10.1016/j.joca.2003.11.003. [DOI] [PubMed] [Google Scholar]
- 16.Eckstein F, Ateshian G, Burgkart R, et al. Proposal for a nomenclature for Magnetic Resonance Imaging based measures of articular cartilage in osteoarthritis. Osteoarthr Cartilage. 2006;14:974–983. doi: 10.1016/j.joca.2006.03.005. [DOI] [PubMed] [Google Scholar]
- 17.McKenzie CA, Williams A, Prasad PV, Burstein D. Three-dimensional delayed gadolinium-enhanced MRI of cartilage (dGEMRIC) at 1.5T and 3.0T. J Magn Reson Imaging. 2006;24:928–933. doi: 10.1002/jmri.20689. [DOI] [PubMed] [Google Scholar]
- 18.Bashir A, Gray ML, Hartke J, Burstein D. Nondestructive imaging of human cartilage glycosaminoglycan concentration by MRI. Magn Reson Med. 1999;41:857–865. doi: 10.1002/(sici)1522-2594(199905)41:5<857::aid-mrm1>3.0.co;2-e. [DOI] [PubMed] [Google Scholar]
- 19.Kimelman T, Vu A, Storey P, McKenzie C, Burstein D, Prasad P. Three-dimensional T1 mapping for dGEMRIC at 3. 0 T using the Look Locker method. Invest Radiol. 2006;41:198–203. doi: 10.1097/01.rli.0000195842.49255.ea. [DOI] [PubMed] [Google Scholar]
- 20.Bolbos R, Zuo J, Banerjee S, et al. Relationship between trabecular bone structure and articular cartilage morphology and relaxation times in early OA of the knee joint using parallel MRI at 3T. Osteoarthr Cartilage. 2008;16:1150–1159. doi: 10.1016/j.joca.2008.02.018. [DOI] [PMC free article] [PubMed] [Google Scholar]
- 21.Eckstein F, Wirth W, Hunter DJ, et al. Magnitude and regional distribution of cartilage loss associated with grades of joint space narrowing in radiographic osteoarthritis e data from the Osteoarthritis Initiative (OAI) Osteoarthr Cartilage. 2010;18:760–768. doi: 10.1016/j.joca.2009.12.009. [DOI] [PMC free article] [PubMed] [Google Scholar]
- 22.Wirth W, Graverand MPHL, Wyman BT, et al. Regional Analysis of Femorotibial Cartilage Loss in a Subsample from the Osteoarthritis Initiative Progression Subcohort. Osteoarthr Cartilage. 2009;17 (3):291–297. doi: 10.1016/j.joca.2008.07.008. [DOI] [PMC free article] [PubMed] [Google Scholar]
- 23.Buck FM, Bae WC, Diaz E, et al. Comparison of T1rho Measurements in Agarose Phantoms and Human Patellar Cartilage Using 2D Multislice Spiral and 3D Magnetization Prepared Partitioned k-Space Spoiled Gradient-Echo Snapshot Techniques at 3T. Am J Roentgenol. 2011;196:W174–W179. doi: 10.2214/AJR.10.4570. [DOI] [PMC free article] [PubMed] [Google Scholar]