

Abstract
Oscillatory entrainment mechanisms are invoked during attentional processing of rhythmically occurring stimuli, whereby their phase alignment regulates the excitability state of neurons coding for anticipated inputs. These mechanisms have been examined in the delta band (1–3 Hz), where entrainment frequency matches the stimulation rate. Here, we investigated entrainment for subdelta rhythmic stimulation, recording from intracranial electrodes over human auditory cortex during an intersensory audiovisual task. Audiovisual stimuli were presented at 0.67 Hz while participants detected targets within one sensory stream and ignored the other. It was found that entrainment operated at twice the stimulation rate (1.33 Hz), and this was reflected by higher amplitude values in the FFT spectrum, cyclic modulation of alpha-amplitude, and phase–amplitude coupling between delta phase and alpha power. In addition, we found that alpha-amplitude was relatively increased in auditory cortex coincident with to-be-ignored auditory stimuli during attention to vision. Thus, the data suggest that entrainment mechanisms operate within a delimited passband such that for subdelta task rhythms, oscillatory harmonics are invoked. The phase of these delta-entrained oscillations modulates alpha-band power. This may in turn increase or decrease responsiveness to relevant and irrelevant stimuli, respectively.
Introduction
Neural oscillations play a key role in attentional selection. High-frequency gamma rhythms (>30 Hz) within local neural ensembles enhance the efficacy of signals located within the locus of the attentional spotlight (Fries et al., 2001, 2002; Taylor et al., 2005; Womelsdorf and Fries, 2006; Jacobs et al., 2007), and alpha-band oscillations (8–14 Hz) are associated with attentional suppression mechanisms in visual cortex (Mulholland et al., 1983; Ray and Cole, 1985; Foxe et al., 1998; Worden et al., 2000; Sauseng et al., 2005; Thut et al., 2006; Dockree et al., 2007; Snyder and Foxe, 2010). A central role in perceptual selection has also been attributed to the momentary phase of brain oscillations, whereby the amplitude of faster rhythms (alpha, beta, and gamma) modulate as a function of the phase of slower oscillations (delta or theta - Bishop, 1932; Lakatos et al., 2005; Canolty et al., 2006; Jensen and Colgin, 2007; Puig et al., 2008). It is theorized that phase/amplitude cross-frequency coupling mechanisms coordinate neural activity on multiple timescales, selectively influencing stimulus processing at different levels of the sensory hierarchy by controlling the excitability state within local neural ensembles, as well as across distributed cortical networks (Csicsvari et al., 2003; Buzsáki, 2004; Jones and Wilson, 2005; Lakatos et al., 2007; Isler et al., 2008; Canolty and Knight, 2010).
In an influential nonhuman primate study, it was found that delta-band oscillations within primary visual cortex “entrained” to the pace of the stimulus stream when a rhythmic (1.5 Hz) and predictable intersensory attention task was used (Lakatos et al., 2008). This delta oscillation showed an equi-opposite phase relationship dependent on whether the visual or auditory elements of the alternating audio-visual stream were attended. It was inferred that entrainment formed the basis of a selection process whereby attended inputs aligned with the excitable phase of the oscillatory cycle, while irrelevant inputs aligned with the opposite inhibitory phase. Further, the amplitude of higher-frequency theta and gamma rhythms were found to modulate as a function of delta phase. An important question follows from these findings. Does the precise alignment observed by Lakatos et al. (2008) reflect an entirely flexible entrainment system, such that the system can readily adjust the frequency and phase of the entrainment rhythm to precisely match the frequency of stimulus inputs across a wide range of rates?
We aimed to test the universality of entrainment, and its role in sensory selection, by investigating whether entrainment operates in scenarios where rhythmical stimuli are presented at slower paces than delta (1–3 Hz) and when the stimulus composition of the inputs is largely unpredictable. Recordings were made from implanted subdural electrodes over human auditory cortex, while rhythmical auditory stimuli were presented at a rate of 0.67 Hz. We reasoned that if rhythmic shifting of excitability only operates within a delimited delta frequency band, entrainment processes would necessarily rely on more than a single oscillatory cycle between successive stimuli. We also sought to characterize cross-frequency coupling between these putative delta mechanisms and higher-frequency oscillatory mechanisms. We were specifically interested in the role of alpha-band suppression mechanisms, since it is well known that alpha-band activity over visual cortical areas selectively operates to suppress irrelevant visual inputs during attentional tasks (Foxe et al., 1998; Kelly et al., 2005, 2006, 2009; Gomez-Ramirez et al., 2007). Similar alpha-mediated suppression mechanisms have not been firmly established in auditory cortex, but this is likely due to measurement issues. That is, alpha generated in auditory sensory cortex may not propagate well to the scalp surface given the orientation of the underlying generators, which are buried along the supratemporal plane. The use of direct intracranial recordings provides the necessary sensitivity to auditory alpha, allowing for a direct assessment here of potential cross-frequency coupling between delta-band oscillations and alpha-band power.
Materials and Methods
Intracranial recordings were obtained from two patients (MDJ and BD, 40 and 37 years old, respectively) suffering from intractable epilepsy. Participant MDJ was female, while participant BD was male. No seizure activity was observed in the cortical regions investigated herein. Both participants were on anti-seizure medication at the time of recording, and all neuropsychological tests were within normal limits. Language was left lateralized as determined by Wada testing. Participants provided written informed consent and the procedures were approved by the Institutional Review Boards of the Nathan Kline Institute, Weill Cornell Presbyterian Hospital, and the City College of the City University of New York.
Experimental paradigm.
The sequence of events in a typical block is illustrated in Figure 1A. We implemented a rhythmic task by presenting an auditory stimulus every 1500 ms (i.e., 0.67 Hz stimulus presentation rate). All visual stimuli were presented with a stimulus onset asynchrony (SOA), with respect to the auditory stimulus, of 0, 13, 25, 67, or 140 ms with equal proportions.
Figure 1.

Example trial sequence. A, A trial was composed of an auditory-alone (10%), a visual-alone (10%), or a bimodal (80%) stimulus. The intertrial interval was set to 1500 ms, measured between consecutive auditory stimulus onsets. The SOA between the auditory and visual stimuli randomly varied between 0, 13, 25, 67, and 140 ms. Subjects were required to respond with a button push to targets within the attended modality. B, Example auditory (top) and visual (bottom) stimuli at various difficulty levels. Auditory targets were identifiable by a slight amplitude reduction in the center of the tone. Visual targets were Gabor patches of different orientation. Difficulty was adaptively varied according to the subjects' online performance.
A central cross (black and ∼1° angle) was presented on the screen throughout the experiment, and participants were instructed to maintain fixation at all times. Visual stimuli were displayed on a gray background, while all auditory stimuli were presented through headphones (Sennheiser, model HD600). Participants were instructed on alternating blocks to bias attention to the auditory or visual modality, and only detect deviant targets in the relevant sensory modality. Each block contained a total of 120 trials, giving a block run time of 3 min. Participant MDJ performed a total of 9 blocks (5 attend-auditory and 4 attend-visual), while participant BD performed a total of 18 blocks (9 attend-auditory and 9 attend-visual). Greater access time to participant BD allowed for more experimental blocks to be completed by him. Two attend-visual blocks of participant BD were excluded from analysis on account of poor performance (>10 misses and 10 false alarms) due to a self-reported lack of attentional focus.
A limitation of our procedure was that formal infrared eye-tracking procedures could not be implemented due to technical limitations in the hospital room environment where these recordings were acquired. Instead, the experimenter visually monitored the participant's eye position throughout all recordings and regularly informed the participant to keep his/her eyes on the central fixation cross. In the event that the participant was becoming evidently fatigued, or any evidence of eye closure or deviation from fixation was detected, the experimental block was aborted and the participant was given a break from testing.
In a given block, 80% of the stimuli were bisensory, and the visual portion of the bisensory stimulus was delayed using five different SOAs (see above) relative to the onset of the auditory stimuli. Further, 10% of the stimuli were auditory-alone, and the remaining 10% were visual-alone. The auditory stimulus consisted of a binaural, continuous pure tone (1000 Hz, 80 dB SPL, 100 ms duration, 5 ms rise/fall, 5 ms interval between tones). The visual stimulus consisted of a pair of Gabor patches (4.5° in diameter, centered 2.5° to the left and right of fixation, 100 ms duration, 10 cycles/degree). The audio-visual bisensory stimuli were a combination of the above-described auditory and visual stimuli. All visual stimuli were presented on a Dell Trinitron Ultrascan P780 17” Cathode Ray Tube Monitor, on a gray background running with a 60 Hz refresh rate. Eye position was closely monitored by the experimenters throughout the entire task.
On 85% of visual stimuli (standards), the two Gabor patches were oriented identically and no overt response was required. On the other 15% (targets), the orientations of the left and right Gabor patches were slightly different (see Fig. 1B) and subjects responded to these targets with a button push (using a computer mouse) during the blocks where attention was apportioned to the visual modality. For 85% of the auditory stimuli (standards), the tone had no discontinuity in the signal and no response was required. For the other 15% (targets), there was a slight discontinuity in the middle segment of the tone (a gap), and subjects were required to press a button upon detection during those blocks where attention was apportioned to the auditory modality. Incongruent target stimuli (e.g., a deviant auditory stimulus paired with a standard visual stimulus, and vice versa) and congruent targets were presented with equal probability.
The difficulty in detecting a target was adapted online based on the participant's performance. We implemented this adaptive task difficulty approach to minimize task difficulty differences across sensory modalities and to keep the participants highly motivated throughout the task. The difficulty levels in the auditory task were achieved by attenuating the amplitude in the middle of the signal (i.e., 47–52 ms) by a particular value. The values were chosen using a logarithmic scale, with a 100% attenuation in the lowest difficulty level and a 5% attenuation in the highest level. In the visual modality, the level of difficulty was also adapted using a logarithmic scale. The lowest level of difficulty between the two Gabor patches was an angular difference of 54°, while the highest level of difficulty was an angular difference of just 1° (see Fig. 1B for a visual illustration of the target stimuli). Neither participant reached the highest or lowest level of difficulty in either sensory modality.
Before the start of the experiment, participants performed several practice runs to set the initial target difficulty level, and to become familiar with the experimental setup. Thereafter, difficulty level was decreased in the event of either a single miss or two false-alarm responses in a row, and increased one level in the event of two hits in a row. Feedback on behavioral performance (i.e., amount of hits, misses, false alarms, and correct withholds) was given at the end of each block by graphically presenting the performance data on the screen.
EEG measurements.
Continuous EEG data were acquired using a BrainVision amplifier system. The electrodes used here are highly sensitive to local field potentials (LFPs) generated within an ∼4.0 mm3 area, and are much less sensitive to distant activity (Lachaux et al., 2005; Sehatpour et al., 2008). Recordings were obtained using a multiarray grid composed of 48 contacts (6 rows × 8 columns, 10 mm intercontact spacing), which covered a large portion of the surface of the temporal lobe, including parts of the lateral sulcus containing auditory cortex. Both participants had the multiarray grid electrode placed over the right hemisphere. An electrode located over frontal cortex served as the reference. The data were bandpass-filtered online from 0.016 to 250 Hz and digitized at 1000 Hz. Data were analyzed offline using a ±1200 μV artifact rejection criterion. Two notch-filters at 60 and 120 Hz and a linear-detrend method were applied to the raw data offline. The EEG recordings were not obtained immediately before or after seizures. High-resolution presurgical MRIs were coregistered with postsurgery MRIs for the precise derivation of the electrode coordinates and reconstruction into 3D renderings. Finally, given our relatively small sample of trials for each SOA condition, all EEG analyses of audio-visual stimuli were collapsed across SOAs.
Behavioral data analysis.
d′ values were calculated for each participant. d′ values quantify the sensitivity of identifying a deviant stimulus, independent of response criteria (Best et al., 1981).
Data referencing: event-related field potentials.
Two-dimensional LFP profiles were calculated using a five-point formula to estimate the second spatial derivative of voltage in the vertical and horizontal axis. This composite local referencing scheme was used to ensure that analysis of activity at a given electrode site was confined exclusively to local activity, ensuring the minimum of contamination through propagation of currents from more distant generators. For our purposes here, we have termed these responses event-related field potentials (ERFPs) to reflect their highly local nature. They are computed as follows:
where “Vi,j” denotes the recorded field potential at row “i” and column “j” in the electrode grid. ERFP profiles for electrode contacts located in the borderline of the grid were not calculated because of the lack of a full compliment of surrounding neighbor electrode sites.
Anatomical localization of electrodes based on MRI data.
The BrainVoyager 4.9 software package was used to analyze the anatomical MRI data (Goebel et al., 2006). High-resolution presurgical MRIs were coregistered with postsurgical MRIs using a method that lines up the anterior and the posterior commissures. These were reconstructed into three-dimensional (3D) images. Afterward, the 3D coordinates of each electrode were calculated from the postsurgical MRI and mapped to the presurgical MRI. The MRI data were then transformed into Talairach space for the localization of each electrode contact based on the Talairach Daemon library (Lancaster et al., 2000).
Characterization and localization of sensory-evoked activity.
Accepted trials were epoched from −100 ms to 500 ms after stimulus onset. The baseline was defined as the mean amplitude from 100 ms to 0 ms before the onset of the auditory stimulus. To characterize evoked (phase-locked) activity, we derived ERFP waveforms by averaging across all accepted audio-visual bisensory stimuli in both attention conditions. The term ERFP signifies “event-related field potential” and is similar to the event-related-potential (ERP) data, in that both are derived using the same algorithm. However, the ERFP indexes the gradient of local field potential, and is essentially reference-independent, while the ERP indexes voltage activity and uses a reference location. Only trials on which a nontarget (in both modalities) bisensory stimulus was presented and no overt response was made were analyzed for localization purposes.
To characterize a sensory-evoked activation, difference waveforms were calculated for each trial by subtracting the average activity from −100 to −50 ms from the whole epoch. Statistical testing of sensory-evoked effects was achieved by computing Monte Carlo simulations on these difference waveforms and comparing the “observed” z-score value against the simulated Monte Carlo distribution (see Maris et al., 2007 for nonparametric testing of neurophysiological processes). The observed z-score was computed for each single time point in each electrode of interest. The Monte Carlo simulation was derived by computing the z-score of a random collection of the total sampled trials. This process was repeated 5000 times. An effect was deemed statistically significant when the following two criteria were met: (1) the observed z-score value, in each dipolar moment, was less than −1.96 or greater than 1.96, and (2) the observed z-score was situated above 1.96 or below −1.96 SDs away from the mean of the Monte Carlo distribution.
Frequency domain analysis.
To examine the frequency spectrum for dominant oscillatory rhythms, an FFT was performed on the ERFP activity for each attention condition. This FFT was performed on a 6 s time window centered on the onset of each accepted trial (−3000 to 3000 ms), providing a resolution of 0.1667 Hz. Before the computation of the FFT, the raw ERFP signal was baseline corrected using the mean activity from −100 ms to 0 ms relative to the auditory stimulus onset. Note that for all analyses, the first five observations in every block of trials were discarded to ensure that the rhythmicity of the task had been established.
Time-frequency analysis.
Instantaneous power and phase activity was characterized on a single trial level using a Morlet wavelet decomposition applied to the ERFP measurements, as implemented in the Fieldtrip toolbox for MATLAB (version 2008-04-05, see http://www.ru.nl/fcdonders/fieldtrip/). This procedure provides an index of “induced” activity (i.e., both incompletely and strictly phase-locked activity) as a function of time (see Tallon et al., 1995; Sutoh et al., 2000; Lakatos et al., 2007). Before time–frequency analysis was conducted, the raw ERFP signal was linearly detrended. For each accepted epoch, the wavelet decomposition was computed from 0.67 to 115 Hz (with initial steps of 0.67 until the 4 Hz component, after which steps of 1 Hz were adopted). To avoid edge filter artifacts, accepted trials were separately epoched from −2000 to 2000 ms relative to the stimulus, time-locked to the onset of the auditory stimulus. The baseline was defined as the mean amplitude from 100 ms to 0 ms before the onset of the auditory stimulus. Separate averages were made for the two attention conditions (Attend-Auditory, Attend-Visual). To test for statistically significant attention effects, the observed z-score value was compared against a simulated distribution derived using a Monte Carlo procedure (as above). The temporal window used for assessing attention effects in each frequency band was chosen such that it exceeded the duration of the auditory stimulus (i.e., 100 ms) and contained at least four oscillatory cycles of that frequency. For instance, the temporal window for a 10 Hz oscillation was 400 ms; for a 20 Hz oscillation, 200 ms; and for a 40 Hz oscillation, 100 ms. The amplitude values within this temporal window were averaged across time.
Instantaneous phase statistics.
To estimate the phase distribution across trials, the mean phase angle and the resultant length of the mean complex vector (mean resultant length, R) were calculated at each frequency at the onset of the auditory stimulus. To estimate R, each phase observation was normalized to a unit vector in the complex plane by dividing complex wavelet values by their magnitude. R was then calculated by taking the mean across all trials. The mean resultant length ranges from 0 to 1, with 0 indicating uniform phase distribution across trials and 1 a constant phase on all trials. The distribution of phase (across trials) was analyzed using circular statistical methods, and the phase distribution was tested against the null hypothesis of uniformity using the Rayleigh statistic.
To test for differences across attention conditions, pooled phase distributions were compared using a nonparametric test for the equality of circular means (see Rizzuto et al., 2003; Rizzuto et al., 2006; Lakatos et al., 2007). The α value was set at 0.05 for all statistical tests.
Cross-frequency coupling.
Oscillatory amplitude in the delta, theta, alpha, beta, and gamma bands as a function of oscillatory phase of a 0.67 Hz frequency cycle at auditory stimulus onset was measured. Phase/amplitude cross-frequency coupling (nested frequency) effects were also calculated for amplitudes of the theta, alpha, beta, and gamma bands and the phase of the second, third, and fourth harmonics of the 0.67 Hz component, as well as the delta (1–3 Hz) frequency band. To accomplish this, we sorted the phase values obtained from the wavelet-transformed epochs from −π to +π radians. We then applied the permutation vector obtained from sorting the phases to the oscillatory amplitude values (see Lakatos et al., 2005; Lakatos et al., 2008). To assess the reliability of any putative cross-frequency coupling effect, we systematically shuffled the alpha-power time course on each individual trial by 0%, 33%, 67%, and 100% for each condition in each participant.
Results
Behavioral analyses
d′ measures were computed for each attention condition collapsed across stimulus type and SOA variables. Participant MDJ had d′ values of 2.49 and 2.36 for the auditory and visual conditions, respectively. Participant BD had d′ values of 2.71 and 2.53 for the auditory and visual conditions, respectively.
Electrode localization: MRI and ERFP activity
Figure 2 shows ERFP waveforms, collapsed across attention conditions, for adjacent pairs of electrodes localized to Brodmann area (BA) 41 in the superior temporal gyrus (STG). A single electrode in each participant that likely captured activity emanating from primary auditory cortex (A1) on the basis of the MRI and neurophysiological activity was identified (see method section for a description). For participant MDJ, this was electrode E14 (Talairach coordinates 59, −25, 11), and for BD, it was E10 (57, −20, 11). These electrodes show an initial stimulus-locked ERFP component peaking at ∼45–55 ms (positive for MDJ, negative for BD; see Fig. 2), followed by a substantial deflection of the opposite polarity peaking at ∼80–100 ms past stimulus onset. The latter coincides with the timeframe of the typical auditory N1 ERP component observed in surface electrode recordings (Näätänen et al., 1981; Näätänen, 1982; Beer and Röder, 2005; Leavitt et al., 2007; Molholm et al., 2007).
Figure 2.

Neurophysiology and electrode reconstruction. Individually reconstructed MRIs from each participant and ERFP activity of electrodes placed approximately over primary auditory cortex. MRI and ERFP activity indicate that electrodes E14 and E15 in participant MDJ and electrodes E10 and E11 in participant BD are placed over the STG, and most likely capture activity from A1. Waveforms illustrate ERFP activity to standard bisensory stimuli, collapsed across attention conditions, in electrode pairs that capture dipolar moments during early sensory processing. The gray bars indicate the time interval chosen for testing significant evoked sensory activity. Below each participant's reconstructed MRI is a list of the Talairach coordinates and corresponding Brodmann area of each electrode of interest.
Additional electrodes close to these aforementioned electrodes are also shown to illustrate the spatial resolution provided by the electrode grid and the clear dipolar field activity over early auditory sites. The MRI data indicated that electrode E15 in participant MDJ was also located over BA 41 (59, −22, 5). Further, electrodes E19 and E21 in the same participant were placed over BA 22 (61, −38, 15 and 61, −24, 5, respectively), while electrodes E10 and E13 were placed over BA 43 and 40, respectively (53, −7, 13 and 58, −27, 20). Electrode E11 in participant BD was also localized to BA 41 (57, −12, 7). Furthermore, electrode E9 was located over BA 42 (57, −27, 14), while electrodes E3 and E16 in the same participant were located over BA 2 and 21, respectively (57, −22, 28 and 58, −22, 1).
FFT spectral peaks and phase statistics
We sought to identify and characterize oscillatory processes in the data that may reflect an entrainment mechanism that facilitates intersensory perceptual selection. As a first step, we examined FFT spectra for oscillatory peaks. Figure 3A (upper panels) shows a 6 s FFT spectrum over the range 0.33–100 Hz for both attention conditions in electrode E14 in participant MDJ (number of auditory and visual trials: 116 and 113, respectively) and E10 in participant BD (number of auditory and visual trials: 323 and 324, respectively). Figure 3A (lower panels) shows the spectrum in the range 0.33 to ∼4 Hz. Peaks in amplitude were apparent at the stimulus rate (0.67 Hz) and harmonics 1.33, 2.00, and 2.67 Hz for both participants, and additionally at 3.33 Hz for participant BD. We assessed statistical differences across oscillatory peak amplitudes in each participant, collapsed across attention conditions. We found significantly higher amplitude in the second harmonic peak than the first in both participants (MDJ z-score = −1.98, p < 0.05; BD z-score = −1.65, p < 0.05). Greater power was observed in the second harmonic peak also when compared to the third (MDJ z-score = −6.02, p < 0.001; BD z-score = −9.12, p = 0) and fourth (MDJ z-score = −15.71, p = 0; BD z-score = −19.23, p = 0) harmonics. To test whether the dominance of the second harmonic peak was merely due to the spectral content of the evoked response, we computed an FFT on the average evoked response derived over the same 6 s window (i.e., rather than compute the FFT for each 6 s window and then average, we computed the FFT of the time-domain average). The FFT revealed a reversal of the previously reported effects—the first harmonic was larger than the second harmonic in both participants (see Fig. 3B). This finding indicates that the relative amplitudes of oscillatory modes are unlikely to be due to the evoked response.
Figure 3.

Spectral analysis using FFT. A, FFT spectrum (on a single-trial basis) during attend-auditory and attend-visual conditions at electrode E14 (MDJ) and electrode E10 (BD). The lower graphs show spectral peaks evident at 0.67 Hz, as well as, at its second and third harmonics in both attention conditions and both subjects. B, A 6 s FFT spectrum (on the averaged waveform) centered on the onset of the auditory stimulus during attend-auditory and attend-visual conditions at electrode E14 (MDJ) and electrode E10 (BD). The graphs show the greatest peak in the spectrum range 0–4 Hz at 0.67 Hz (i.e., the first harmonic). In addition, the spectrum shows a significant drop in power in the second harmonic (i.e., 1.33 Hz) in both participants. C, Histograms illustrating the phase distribution of the 0.67 and 1.33 Hz frequency components at 0 ms for each attention condition in the same electrodes. In both participants, significantly nonuniform phase distributions were measured for both attention conditions at the first and second harmonics, and the circular means differed significantly between attention conditions.
The Rayleigh test revealed statistically significant nonuniformity in the phase distributions of the 0.67 Hz component and the second harmonic (i.e., 1.33 Hz), but not for the remaining harmonics, namely 2, 2.67, and 3.33 Hz. Histograms in Figure 3C show the phase distributions of the 0.67 Hz oscillatory component, and its second harmonic 1.33 Hz, in the same electrodes at 0 ms (the onset of the auditory tone) for each attention condition. The Rayleigh test performed on the 0.67 Hz frequency component showed that attention to both auditory and visual modalities elicited a significant phase organization [p < 0.05 attend-auditory R = 0.54 and circular variance (S) = 0.46, p < 0.05 attend-visual R = 0.21, S = 0.79 in participant MDJ; p < 0.05 attend-auditory R = 0.61, S = 0.39, p < 0.05 attend-visual R = 0.43, S = 0.57 in participant BD]. When testing for differences in phase distribution across attention conditions, it was found that they were statistically different from each other in participant MDJ (Yr = 6.99, p < 0.05) and in participant BD (Yr = 6.35, p < 0.05). For the 1.33 Hz component, the data also revealed a significantly nonuniform phase distribution in both attention conditions in participant BD (attend-auditory R = 0.55, S = 0.45; attend-visual R = 0.38, S = 0.62). In participant MDJ, a significantly nonuniform phase distribution was seen only for the attend-auditory condition (R = 0.32, S = 0.68), with a trend toward significance in the attend-visual condition (R = 0.14, S = 0.86; p = 0.0878). However, the 1.33 Hz phase distributions were different across attention conditions in both MDJ (Yr = 5.62, p < 0.05) and BD (Yr = 4.87, p < 0.05). MDJ's mean phase value for the attend-auditory condition was 85°, whereas the mean phase value for the attend-visual condition was 283°. For participant BD, the mean phase value for the attend-auditory condition was 83°, whereas the mean phase value for the attend-visual condition was 232°. This indicates that the 1.33 Hz oscillation in the attend-visual condition lagged that in the attend-auditory condition by 162° (338 ms) and 211° (441 ms) in MDJ and BD, respectively.
Given our relatively small sample of trials for each SOA condition, we decided to pool audio-visual stimuli across all SOAs. However, to ensure that there were no differences in the SOA phase distributions, we computed a nonparametric test for the equality of circular means for each attention condition and in both subjects. The results did not reveal a significant difference in any of the conditions and subjects tested (MDJ attend-aud: F = 0.2324, p = 0.2128; MDJ attend-vis: F = 0.4732, p = 0.5970; BD attend-aud: F = 0.3707, p = 0.3411; BD attend-vis: F = 1.7294, p = 0.2888).
To summarize, the FFT spectra exhibited clear oscillatory peaks at the stimulation rate and harmonics below the 4 Hz range. The amplitude of the second harmonic in the FFT spectrum was significantly greater than the amplitudes of the first, third, and fourth harmonics. Further, phase distributions for the 0.67 and 1.33 Hz oscillations were significantly nonuniform in each attention condition and significantly different across attention conditions.
Attention effects in the time–frequency domain
Figure 4A shows the time–frequency spectrum from 1 to 70 Hz for both attention conditions, and their difference (attend-auditory minus attend-visual, lower panels) in the period of −1600 to +1600 ms relative to stimulus onset (MDJ number of auditory and visual trials: 164 and 120, respectively; BD number of auditory and visual trials: 277 and 264, respectively). The figure shows increased power in frequencies lower than 60 Hz after stimulus onset with a clear peak around 10 Hz at or shortly following the presentation of the auditory stimulus. No effects were observed in frequencies above 70 Hz.
Figure 4.

Attention effects in the time–frequency domain. A, Wavelet transform amplitude from 1.33–70 Hz is shown in electrodes E14 (MDJ) and E10 (BD) for the attend-auditory (upper) and attend-visual (middle) conditions and the difference (bottom) (dominant 0.67 Hz component not shown for visual display purposes). B, Average alpha-power time course plotted over two consecutive trials with superimposed 1.33 Hz sawtooth wave for timing reference. Times −1500, 0, and 1500 refer to the onset of an auditory stimulus. Alpha-amplitude peaks occurring at different instantaneous phase points during the interstimulus-interval between attention conditions. The average time for when these peaks occurred was ∼740 ms across both participants and conditions. This effect is most clearly seen in the period preceding the onset of the auditory stimulus. Note that there are some differences in the alpha-trajectory between the intermediate periods before and after the onset of the middle auditory stimulus. We believe that these small discrepancies should disappear with a larger number of trials.
Nonparametric statistical testing revealed an effect of attention in the alpha band (8–14 Hz) in both participants during the period between 0 and 400 ms after stimulus onset (MDJ z-score = −1.19, p < 0.05; BD z-score = −0.78, p < 0.05). Consistent with the hypothesis, attending to the visual modality resulted in greater alpha-band power compared to attending to the auditory modality. The reader should note that although the Monte Carlo simulation revealed statistically significant effects, the z-score values associated with each participant's distribution are below the ±1.96 threshold level.
The statistics also revealed attention effects in the upper beta band (20–30 Hz) in the period between 0–160 ms after stimulus onset for both participants (MDJ z-score = 2.34, p < 0.05; BD z-score = 0.67, p < 0.05). Attention to the auditory modality results in greater upper beta-band power than attention to the visual modality. In addition, attention effects were found in the lower gamma band (45–60 Hz) in the period between 0 and 100 ms (MDJ z-score = −0.67, p < 0.05; BD z-score = −0.52, p < 0.05). In this case, however, and contrary to previous human studies (see e.g., Senkowski et al., 2005; Karns and Knight, 2009), attention to the visual modality resulted in greater activity than attention to the auditory modality (see Fig. 5A). We investigated this further by examining gamma band activity in neighboring electrodes (E15 in MDJ and E11 in BD) and found that these displayed typical results, although in a larger time window (see Fig. 5B). That is, attention to audition elicited greater gamma-band power compared to attention to vision (time period 0–200 ms, MDJ z-score = 2.87, p < 0.05; BD z-score = 1.98, p < 0.05). No effects were observed at higher frequencies.
Figure 5.
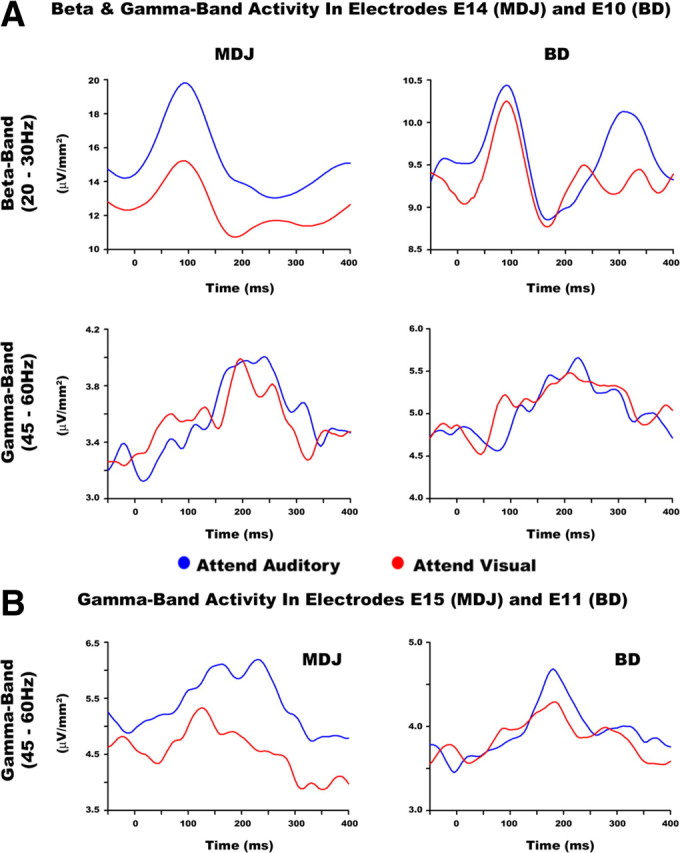
Attention effects in higher-frequency bands (> 20 Hz). A, Upper panels show beta band (20–30 Hz) activity during attend-auditory and attend-visual conditions at electrode E14 in MDJ and electrode E10 in BD. The lower panels show gamma-band (45–60 Hz) activity in those same electrodes. The plots show greater beta band power during attention to audition compared to vision. Conversely, the data revealed greater gamma-band activity in the attend-visual than in the attend-auditory condition. B, Gamma-band activity in neighboring electrodes to E14 and E10 localized to the surface area of BA 41. The data revealed typical patterns of gamma-band activity, whereby greater power is observed in sensory regions matching those of the attended sensory modality. These plots show greater power when subjects bias attention to audition compared to vision.
Cross-frequency coupling
Nonuniform phase distributions were observed for the 0.67 and 1.33 Hz frequency components. We set out to investigate the relationship between the phase of these frequency components and oscillatory power of higher frequency bands (> 8 Hz). The data did not show a 1:1 systematic relationship between the phase of the 0.67 Hz component and the power of higher frequencies. Instead, we observed a 2:1 relationship between the 0.67 Hz phase and alpha power, whereby two phase values in the 0.67 Hz yielded a local maximum in alpha power in both attention conditions (see Fig. 6A). In the case of the 1.33 Hz component, a 1:1 systematic relationship was instead found between its phase and alpha power. Figure 6B shows alpha-band (8–14 Hz) amplitude sorted as a function of delta (1.33 Hz) phase for both participants. It is clear in each attention condition that alpha amplitude systematically varied as a function of delta phase, but most importantly, this function was approximately reversed across attention conditions. That is, the lowest alpha amplitude approximately coincided with the delta-phase value −π/2 when attention was directed to the visual modality, whereas alpha was strongest close to this phase point in the attend-auditory condition, and vice versa for the delta-phase point π/2. To quantify the strength of this cross-frequency coupling pattern, we fitted a sine-wave function, for each attention condition and each subject, where frequency was treated as a fixed parameter (Freq = 1.33 Hz), while the phase and amplitude were treated as free parameters. The goodness of fit revealed a strong relationship between the sine-wave and the cross-frequency data in both attention conditions and in both subjects (MDJ: attend-auditory R = 0.78, R2 = 0.61, p < 0.05; attend-visual R = 0.86, R2 = 0.73, p < 0.05. BD: attend-auditory R = 0.75, R2 = 0.57, p < 0.05; attend-visual R = 0.72, R2 = 0.51, p < 0.05). Importantly, the data revealed that the best-fitted curves for participant MDJ in the attend-auditory and -visual conditions were achieved by the phase angles 177° and 45°, respectively. Similarly, for participant BD, the best-fitted curves for the attend-auditory and attend-visual conditions were achieved by the phase angles 181° and 58°, respectively. Together, the curve-fitting data confirm our previous findings that the delta-phase/alpha-power relationship is arranged in an organized manner (in a sine function), and that attention can modulate this arrangement by changing the “phase” of this sine-wave function accordingly.
Figure 6.

Cross-frequency phase/amplitude coupling. A, Cross-frequency coupling between alpha (8–14 Hz) amplitude plotted as a function of 0.67 Hz phase. B, Cross-frequency coupling between alpha (8–14 Hz) amplitude plotted as a function of delta (1.33 Hz) phase. C, Temporal shuffling of alpha-band power as a function of 1.33 Hz phase. The figure shows that the phase–amplitude cross-frequency coupling systematically gets reduced with temporal shuffling of the alpha power. The gray lines, which are plotted over the 0% shuffled trials, indicate the standard error for each bin. All the data come from electrode E14 in participant MDJ and E10 in participant BD.
We performed an additional analysis to show that this phase–amplitude interaction effect is not due to an artifactual interplay between the evoked response and the timing of our protocol. To this end, we systematically shuffled the alpha-time course on each trial using four different values (0, 33, 67, and 100%) for each condition in each participant. This analysis is illustrated in Figure 6C. The analysis revealed that by systematically shuffling the alpha-time course, the cross-frequency coupling effect disappeared accordingly. We also computed standard errors (plotted in gray over the 0% shuffled trials) to show that there is a clear separation between the nonshuffled trials and the shuffled conditions.
To illustrate the cyclical modulations of the alpha power in more detail, we have plotted the alpha-power time course aligned to a 1.33 Hz sawtooth wave (see Fig. 4B) that has been superimposed for phase reference (same for all conditions, and aligned with respect to the onset of the auditory stimulus). Peaks in alpha amplitude can be seen to occur at different instantaneous time points within the stimulus frame in the attend-auditory and attend-visual conditions in both subjects. Specifically, whereas in the attend-auditory condition a second peak in alpha amplitude was observed halfway between stimuli, in the attend-visual condition the peak in alpha amplitude occurred a couple of hundred milliseconds later. This effect is best represented in the period between −1500 and 0 ms. To quantify this, we computed the times where peaks in alpha-band power occurred within a −2000 to +2000 ms time window relative to auditory stimulation. In participant MDJ, the peaks in the attend-auditory condition occurred at −1440, −660, 50, 620, and 1550 ms. In the attend-visual condition, the peaks in participant MDJ occurred at −1442, −500, 28, 720, and 1525 ms. In participant BD, the peaks in the attend-auditory condition occurred at −1325, −690, 170, 755, and 1625 ms. In the attend-visual condition the peaks in participant BD occurred at −1385, −475, 145, 955, and 1585 ms.
In summary, the data revealed a consistent relationship between 1.33 Hz delta phase and alpha amplitude and that this relationship was modulated by attention. The lowest and highest values of alpha-band power were found at different phase points of a 1.33 Hz delta oscillation, and this distribution was significantly shifted across attention conditions. Thus, delta (1.33 Hz) phase was shifted with respect to the stimuli, and alpha amplitude maxima and minima were in turn shifted with respect to delta phase. To complete this picture, an examination of alpha amplitude time course with respect to the stimuli revealed a second peak in alpha amplitude occurring between consecutive stimuli, which was also shifted in time across attention conditions. No other cross-frequency phase–amplitude coupling effects were observed between the remaining frequency bands.
Discussion
Here we tested the generality of the hypothesized role of oscillatory neural mechanisms in sensory selection by examining whether and in what form entrainment is invoked by predominantly multisensory, slow rhythmical inputs during an intersensory attention task. Sounds were presented at a fixed rate well below the delta band (0.67 Hz), with visual stimuli presented either simultaneously with or within 140 ms of these auditory inputs. Subdural recordings were made over human auditory cortex, while participants selectively directed attention to either the auditory or the visual stimuli. An intriguing pattern of oscillatory activity was found. First, the FFT spectrum contained clear peaks at the first and subsequent harmonics of the stimulation rate, with the second harmonic (1.33 Hz) showing greater amplitude than the first, third, and fourth harmonics. Second, time–frequency analysis revealed cyclical variations in alpha amplitude (8–14 Hz), whereby two peaks were interposed between consecutive stimuli in the sequence. Third, phase–amplitude cross-frequency coupling was found between the phase of the 1.33 Hz delta oscillation and power in the alpha band, with this coupling showing robust phase shifts between attention conditions. Finally, alpha power was significantly greater in auditory cortex at the arrival of the auditory stimulus during blocks where attention was apportioned to vision. Together, these results suggest that alpha oscillatory activity plays a role in sensory selection in auditory cortex, and that such a role may be mediated by entrainment of its amplitude to frequencies harmonically related to the stimulation rate within the delta band.
Oscillatory entrainment and hierarchical organization of oscillatory cycles
The expression of entrainment mechanisms in these data and their modulation by attention are quite distinct from previous work, although the elementary principles (i.e., attention-dependent phase alignment and phase–amplitude coupling) are now well known (Lakatos et al., 2005; Canolty et al., 2006; Lakatos et al., 2009; Whittingstall and Logothetis, 2009; Besle et al., 2011). First, whereas previous work demonstrated entrained frequencies exactly matched to stimulation rates, the present data demonstrate that for slower, subdelta stimulation rates, entrainment operates by interposing multiple oscillatory cycles between consecutive stimuli. Second, whereas most previous studies have reported low-frequency phase-dependent power fluctuations in the gamma band (>30 Hz), cross-frequency power modulation here was found only in the alpha band.
The data revealed amplitude peaks in the FFT spectrum at the first and subsequent harmonic components of the stimulation rate, with highest power at the second harmonic. Only the first and second harmonic components were found to exhibit a phase-alignment structure relative to stimulus onsets, and the phase distributions for these components were significantly different between attention conditions. Specifically, for the 1.33 Hz component, this phase shift was 20–30° away from an exact half-cycle (180°). The results further revealed a systematic relationship between the phase of the 1.33 Hz component and alpha-band (8–14 Hz) power. This phase–amplitude cross-frequency coupling was phase-shifted between attention conditions. That is, when attention was deployed to the auditory inputs, peak alpha-band amplitude occurred at the approximate instantaneous phase point “−π/2” of the delta cycle. In contrast, when attention was deployed to the visual inputs, that same instantaneous phase coincided with the lowest point of alpha-band amplitude.
It is significant that the frequency of this delta oscillation falls at twice the stimulation rate, a finding in line with the notion that oscillatory entrainment may be a phenomenon that is specific to frequencies enclosed in the delta range (Schroeder and Lakatos, 2009a). Moreover, the finding implies that even if oscillatory entrainment mechanisms are confined to the delta band, they can still exploit the temporal structure in a task to facilitate sensory selection by using oscillatory harmonics of the stimulation rate. Further, that alpha power modulates with delta phase, and that this cross-frequency coupling was influenced by attention, suggests that this delta-band phase effect is not generated within “local” sensory cortex but most likely originates from higher-order attentional control regions. This suggestion is further supported by a recent study by Besle et al. (2011), where cortical entrainment to periodic stimuli, and corresponding attentional modulations, was observed across a wide gamut of areas that included auditory, visual, parietal, and frontal cortices. Indeed, the consistent finding across studies of a slow oscillatory rhythm controlling the reactivity state of higher oscillations seems to be a general mechanism when rhythmical inputs are being processed. Here, the data suggest that the phase of delta is controlling the reactivity state of alpha, which in turn influences stimulus processing by suppressing or enhancing the local sensory inputs depending on their attentional relevance. It should be noted, however, that our finding of alpha amplitude modulation by delta phase and amplitude difference at the time of stimulus onset does not preclude the possibility that alpha phase also has a significant modulatory influence on stimulus processing. In fact, recent studies have provided evidence that the firing rates of thalamocortical neurons are modulated by the phase of alpha oscillations in the cat thalamus (Hughes and Crunelli, 2007; Lörincz et al., 2009). In humans, alpha phase has also been shown to predict perceptual performance (Busch et al., 2009; Mathewson et al., 2009). It remains to be determined whether alpha phase can be harnessed by top-down mechanisms of selection, as has been shown for lower-frequency (e.g., delta and theta) bands.
An intriguing aspect of our results is that the phase difference across attention conditions in both participants was not fully reversed by 180°, as it was in the study of Lakatos et al. (2008). This may indicate that oscillations need not be fully phase-reversed to cause significant changes in the excitability state of local neural ensembles. It may be that in our task design, where the timing is predictable but the multisensory composition of the sensory inputs is not, a full phase reversal is not physiologically feasible. In contrast, in tasks such as that of Lakatos et al. (2008), where auditory and visual stimuli were alternately presented in a regular interdigitated sequence, never occurring together, full phase reversal is naturally promoted through trial-by-trial switching of intermodal anticipatory “set.” We note that this is speculative, and more studies are needed to confirm this hypothesis.
An important question that arises from results such as ours is how these low-frequency oscillatory mechanisms relate to the many everyday situations where sensory stimulation is punctate or unpredictable or simply does not have any intrinsic rhythmic structure. In this case, stimuli may be as likely to fall at a low-excitability phase as a high-excitability one, so that oscillatory modulation of excitability would provide no advantage. Nonetheless, recent evidence suggests that even singular punctate events can cause brief periods of entrainment, likely mediated through transient resetting of the phase of ongoing oscillations. In Fiebelkorn et al. (2011), we found that presentation of simple but salient tone pips resulted in an obvious periodicity in subsequent visual-target detection, an effect we ascribed to cross-sensory phase-reset mechanisms. Under this scenario, each new event, although not part of a rhythmic sequence, would drive a measure of subsequent phase alignment, with each additional event expected to newly reset the phase of ongoing oscillations rather than augmenting an already entrained system. Theoretical accounts have also suggested that sensory cortices can be placed in a so-called “continuous” or “vigilant” mode of processing when the timing of a stimulus in unpredictable, whereby oscillatory activity in the higher-frequency bands dominates (see Schroeder and Lakatos, 2009a,b). This may not always be favorable, however, as implementing a “vigilant” mode of prolonged high excitation over extended periods of attentional focusing is likely to be metabolically expensive (Schroeder and Lakatos, 2009b). In fact, the findings by Besle et al. (2011) might allude to this idea, as they showed that the size of attentional modulations was significantly greater in a task where the temporal incidence of the stimuli was explicitly known than when the presentation of stimuli were randomly jittered in time around a specific mean.
Alpha-band oscillations in human auditory cortex
Noninvasive EEG studies have repeatedly implicated alpha-band oscillations in the processing of attended and unattended sensory inputs. During attentional deployments to visual space, relative decreases in alpha power over the hemisphere contralateral to the locus of attention are regarded as reflecting enhanced excitability in retinotopic areas (Worden et al., 2000; Sauseng et al., 2005; Thut et al., 2006; Rihs et al., 2007), while increases in alpha power over the ipsilateral hemisphere are thought to reflect active suppression of the cortical areas coding for unattended inputs (Worden et al., 2000; Kelly et al., 2006). Similar findings have been observed in the deployment of spatial attention to the somatosensory (see Haegens et al., 2011) and auditory (see Banerjee et al., 2011) modalities. In audio-visual intersensory attention studies, deploying attention to the auditory modality typically results in alpha power increases over parieto-occipital cortices compared to attention to vision. It is thought that this alpha power increase reflects the active engagement of attentional control regions in the suppression of unattended visual inputs (see Foxe et al., 1998; Fu et al., 2001). The findings in this study are in agreement with the hypothesis that alpha oscillations reflect active mechanisms of sensory suppression in early sensory cortex. During processing of an irrelevant auditory stimulus, alpha power clearly increased compared to when the same auditory stimulus was task-relevant. As such, these data point to the existence of alpha-band oscillatory rhythms in auditory cortex, and further support the notion that alpha-band oscillatory activity represents a common mechanism of sensory suppression that is used by multiple sensory systems at both the cortical and subcortical levels (see Foxe and Snyder, 2011).
A recent report, however, has suggested that more may be afoot, pointing to potentially different functional roles for alpha oscillations dependent on where along the visual processing hierarchy one examines. Mo et al. (2011) queried the role of alpha in the macaque inferotemporal cortex (IT) during an audio-visual intersensory attention task (data from Mehta et al., 2000; Lakatos et al., 2008). Prestimulus alpha power in the superficial layers of IT was shown to be significantly greater when attention was apportioned to vision and away from audition, an enhancement that was followed by increases in visual evoked multiunit activity (MUA). These observations are clearly not consistent with the prevalent “alpha-suppression” model in that they suggest that alpha oscillations might also operate by enhancing processing of relevant stimuli as opposed to suppressing or idling the cortical areas that code for inputs in the unattended modality or location. To accommodate for this discrepancy, the authors suggested that the role of alpha might vary across “lower”- and “higher”-order functional regions of the sensory processing stream. Indeed, in an earlier analysis of these data, Bollimunta et al. (2008) provided explicit evidence that this might be case. LFP and MUA activity were compared across the hierarchy of visual regions (i.e., V2, V4, and IT). The authors revealed an interesting pattern of activity whereby the primary generators of alpha in visual areas V2 and V4 were located within the infragranular layers, while the primary generators of alpha oscillations in IT were found within the supragranular layers. In agreement with the “alpha-suppression” model, the data revealed the expected inverse relationship between alpha power and attention in the lower-tier areas (i.e., V2 and V4), whereby greater alpha power led to faster reaction times to auditory stimuli, presumably by reducing the distracting influence of visual input. However, an opposite relationship was found in IT, where faster auditory RT was associated with decreased alpha power. One possible explanation for these interareal differences may lie in the nature of the visual stimulation used in this study. These consisted of 10 μs stroboscopic light flashes projected onto a diffuser screen that subtended ∼12° of visual space. Monkeys were required to respond to targets that were either slight luminance or slight chromatic changes when vision was attended. It could be argued that large uniform elemental stimuli of this nature are not particularly suited for processing in IT and that the necessary attentional suppression was mainly achieved at the earlier stages of the visual hierarchy. Clearly, this remains a speculation and much remains to be understood about the specific role (or roles) of alpha in attention. Nonetheless, a large body of accumulating evidence makes it clear that oscillations in this band play a crucial role in perception and behavior at multiple sensorimotor levels and across multiple sensory modalities.
Oscillatory mechanisms in upper beta and lower gamma frequency bands
Attention to auditory inputs also resulted in increased upper beta-band (20–30 Hz) power relative to attention to visual inputs. This effect occurred during the early stages of stimulus processing, before 125 ms. Previous studies have linked increases in beta-band power with faster reaction times to audio-visual inputs (e.g., Senkowski et al., 2006), with visual object recognition processes under difficult viewing conditions (Sehatpour et al., 2008), and with improvements in memory performance and memory load (Leiberg et al., 2006; Caplan and Glaholt, 2007), consistent with a role for beta in a broad spectrum of effortful perceptual processes. We also found that attention to the visual modality enhanced activity in lower gamma (45–60 Hz) during early auditory stimulus processing. This finding has to be considered somewhat paradoxical, since most attention studies have reported enhanced gamma-band activity in sensory regions matching those of the attended sensory modality (Senkowski et al., 2005; Lakatos et al., 2008; Karns and Knight, 2009), whereas here, it is unattended auditory stimuli that induce greatest gamma activity. Consistent with these previous findings, however, in neighboring electrodes over auditory association areas, it was observed that attention to audition did yield greater gamma power than attention to vision. These differences across electrode locations clearly merit further investigation, since our finding suggests a more nuanced role in attentional processing for gamma-band activity than previously described.
In conclusion, the current work provides clear evidence in human observers for the role of oscillatory entrainment mechanisms during selective attention tasks, when stimuli from competing streams are presented with a regular rhythm. Results suggest that these entrainment mechanisms are constrained by the intrinsic passband of the delta rhythm, but that they can still be deployed when the stimulation rate does not fall within this band, simply by entraining more than a single delta cycle (i.e., delta harmonics). Clear evidence for cross-frequency phase–amplitude coupling was also observed, although here this was found between delta phase and alpha-band power. Alpha-band power increases were evident in auditory cortex when auditory inputs were to be ignored, pointing to a role for alpha in suppressing auditory processing, a role already ascribed to alpha in visual processing.
Footnotes
This work was primarily supported by a grant from the U.S. National Science Foundation to J.J.F. (BCS0642584). Additional support was derived from a grant from the U.S. National Institute of Mental Health to J.J.F. and S.M. (MH085322). We thank Dr. John Dyke for his technical assistance in the collection of the structural MRI data. We also thank Dr. Pierfilippo De Sanctis, and Dr. Ian Fiebelkorn for their invaluable assistance in data collection. Finally, we owe our greatest thanks to the two patients at New York Presbyterian Hospital who donated their time and energy with grace and dignity at what could only be described as a very challenging time for them.
References
- Banerjee S, Snyder AC, Molholm S, Foxe JJ. Oscillatory alpha-band mechanisms and the deployment of spatial attention to anticipated auditory and visual target locations: supramodal or sensory-specific control mechanisms? J Neurosci. 2011;31:9923–9932. doi: 10.1523/JNEUROSCI.4660-10.2011. [DOI] [PMC free article] [PubMed] [Google Scholar]
- Beer AL, Röder B. Attending to visual or auditory motion affects perception within and across modalities: an event-related potential study. Eur J Neurosci. 2005;21:1116–1130. doi: 10.1111/j.1460-9568.2005.03927.x. [DOI] [PubMed] [Google Scholar]
- Besle J, Schevon CA, Mehta AD, Lakatos P, Goodman RR, McKhann GM, Emerson RG, Schroeder CE. Tuning of the human neocortex to the temporal dynamics of attended events. J Neurosci. 2011;31:3176–3185. doi: 10.1523/JNEUROSCI.4518-10.2011. [DOI] [PMC free article] [PubMed] [Google Scholar]
- Best CT, Morrongiello B, Robson R. Perceptual equivalence of acoustic cues in speech and nonspeech perception. Percept Psychophys. 1981;29:191–211. doi: 10.3758/bf03207286. [DOI] [PubMed] [Google Scholar]
- Bishop G. Cyclical changes in excitability of the optic pathways of the rabbit. Am J Physiol. 1932;103:213–224. [Google Scholar]
- Bollimunta A, Chen Y, Schroeder CE, Ding M. Neuronal mechanisms of cortical alpha oscillations in awake-behaving macaques. J Neurosci. 2008;28:9976–9988. doi: 10.1523/JNEUROSCI.2699-08.2008. [DOI] [PMC free article] [PubMed] [Google Scholar]
- Busch NA, Dubois J, VanRullen R. The phase of ongoing EEG oscillations predicts visual perception. J Neurosci. 2009;29:7869–7876. doi: 10.1523/JNEUROSCI.0113-09.2009. [DOI] [PMC free article] [PubMed] [Google Scholar]
- Buzsáki G. Large-scale recording of neuronal ensembles. Nat Neurosci. 2004;7:446–451. doi: 10.1038/nn1233. [DOI] [PubMed] [Google Scholar]
- Canolty RT, Knight RT. The functional role of cross-frequency coupling. Trends Cogn Sci. 2010;14:506–515. doi: 10.1016/j.tics.2010.09.001. [DOI] [PMC free article] [PubMed] [Google Scholar]
- Canolty RT, Edwards E, Dalal SS, Soltani M, Nagarajan SS, Kirsch HE, Berger MS, Barbaro NM, Knight RT. High gamma power is phase-locked to theta oscillations in human neocortex. Science. 2006;313:1626–1628. doi: 10.1126/science.1128115. [DOI] [PMC free article] [PubMed] [Google Scholar]
- Caplan JB, Glaholt MG. The roles of EEG oscillations in learning relational information. Neuroimage. 2007;38:604–616. doi: 10.1016/j.neuroimage.2007.07.054. [DOI] [PubMed] [Google Scholar]
- Csicsvari J, Jamieson B, Wise KD, Buzsáki G. Mechanisms of gamma oscillations in the hippocampus of the behaving rat. Neuron. 2003;37:311–322. doi: 10.1016/s0896-6273(02)01169-8. [DOI] [PubMed] [Google Scholar]
- Dockree PM, Kelly SP, Foxe JJ, Reilly RB, Robertson IH. Optimal sustained attention is linked to the spectral content of background EEG activity: greater ongoing tonic alpha (approximately 10 Hz) power supports successful phasic goal activation. Eur J Neurosci. 2007;25:900–907. doi: 10.1111/j.1460-9568.2007.05324.x. [DOI] [PubMed] [Google Scholar]
- Fiebelkorn IC, Foxe JJ, Butler JS, Mercier MR, Snyder AC, Molholm S. Ready, set, reset: stimulus-locked periodicity in behavioral performance demonstrates the consequences of cross-sensory phase reset. J Neurosci. 2011;31:9971–9981. doi: 10.1523/JNEUROSCI.1338-11.2011. [DOI] [PMC free article] [PubMed] [Google Scholar]
- Foxe JJ, Snyder AC. The role of alpha-band brain oscillations as a sensory suppression mechanism during selective attention. Front Psychol. 2011;2:154. doi: 10.3389/fpsyg.2011.00154. [DOI] [PMC free article] [PubMed] [Google Scholar]
- Foxe JJ, Simpson GV, Ahlfors SP. Parieto-occipital ∼10 Hz activity reflects anticipatory state of visual attention mechanisms. Neuroreport. 1998;9:3929–3933. doi: 10.1097/00001756-199812010-00030. [DOI] [PubMed] [Google Scholar]
- Fries P, Reynolds JH, Rorie AE, Desimone R. Modulation of oscillatory neuronal synchronization by selective visual attention. Science. 2001;291:1560–1563. doi: 10.1126/science.1055465. [DOI] [PubMed] [Google Scholar]
- Fries P, Schröder JH, Roelfsema PR, Singer W, Engel AK. Oscillatory neuronal synchronization in primary visual cortex as a correlate of stimulus selection. J Neurosci. 2002;22:3739–3754. doi: 10.1523/JNEUROSCI.22-09-03739.2002. [DOI] [PMC free article] [PubMed] [Google Scholar]
- Fu KM, Foxe JJ, Murray MM, Higgins BA, Javitt DC, Schroeder CE. Attention-dependent suppression of distracter visual input can be cross-modally cued as indexed by anticipatory parieto-occipital alpha-band oscillations. Brain Res Cogn Brain Res. 2001;12:145–152. doi: 10.1016/s0926-6410(01)00034-9. [DOI] [PubMed] [Google Scholar]
- Goebel R, Esposito F, Formisano E. Analysis of functional image analysis contest (FIAC) data with BrainVoyager QX: from single-subject to cortically aligned group general linear model analysis and self-organizing group independent component analysis. Hum Brain Mapp. 2006;27:392–401. doi: 10.1002/hbm.20249. [DOI] [PMC free article] [PubMed] [Google Scholar]
- Gomez-Ramirez M, Higgins BA, Rycroft JA, Owen GN, Mahoney J, Shpaner M, Foxe JJ. The deployment of intersensory selective attention: a high-density electrical mapping study of the effects of theanine. Clin Neuropharmacol. 2007;30:25–38. doi: 10.1097/01.WNF.0000240940.13876.17. [DOI] [PubMed] [Google Scholar]
- Haegens S, Händel BF, Jensen O. Top-down controlled alpha band activity in somatosensory areas determines behavioral performance in a discrimination task. J Neurosci. 2011;31:5197–5204. doi: 10.1523/JNEUROSCI.5199-10.2011. [DOI] [PMC free article] [PubMed] [Google Scholar]
- Hughes SW, Crunelli V. Just a phase they're going through: the complex interaction of intrinsic high-threshold bursting and gap junctions in the generation of thalamic alpha and theta rhythms. Int J Psychophysiol. 2007;64:3–17. doi: 10.1016/j.ijpsycho.2006.08.004. [DOI] [PMC free article] [PubMed] [Google Scholar]
- Isler JR, Grieve PG, Czernochowski D, Stark RI, Friedman D. Cross-frequency phase coupling of brain rhythms during the orienting response. Brain Res. 2008;1232:163–172. doi: 10.1016/j.brainres.2008.07.030. [DOI] [PMC free article] [PubMed] [Google Scholar]
- Jacobs J, Kahana MJ, Ekstrom AD, Fried I. Brain oscillations control timing of single-neuron activity in humans. J Neurosci. 2007;27:3839–3844. doi: 10.1523/JNEUROSCI.4636-06.2007. [DOI] [PMC free article] [PubMed] [Google Scholar]
- Jensen O, Colgin LL. Cross-frequency coupling between neuronal oscillations. Trends Cogn Sci. 2007;11:267–269. doi: 10.1016/j.tics.2007.05.003. [DOI] [PubMed] [Google Scholar]
- Jones MW, Wilson MA. Theta rhythms coordinate hippocampal-prefrontal interactions in a spatial memory task. PLoS Biol. 2005;3:e402. doi: 10.1371/journal.pbio.0030402. [DOI] [PMC free article] [PubMed] [Google Scholar]
- Karns CM, Knight RT. Intermodal auditory, visual, and tactile attention modulates early stages of neural processing. J Cogn Neurosci. 2009;21:669–683. doi: 10.1162/jocn.2009.21037. [DOI] [PMC free article] [PubMed] [Google Scholar]
- Kelly SP, Lalor EC, Reilly RB, Foxe JJ. Visual spatial attention tracking using high-density SSVEP data for independent brain-computer communication. IEEE Trans Neural Syst Rehabil Eng. 2005;13:172–178. doi: 10.1109/TNSRE.2005.847369. [DOI] [PubMed] [Google Scholar]
- Kelly SP, Lalor EC, Reilly RB, Foxe JJ. Increases in alpha oscillatory power reflect an active retinotopic mechanism for distracter suppression during sustained visuospatial attention. J Neurophysiol. 2006;95:3844–3851. doi: 10.1152/jn.01234.2005. [DOI] [PubMed] [Google Scholar]
- Kelly SP, Gomez-Ramirez M, Foxe JJ. The strength of anticipatory spatial biasing predicts target discrimination at attended locations: a high-density EEG study. Eur J Neurosci. 2009;30:2224–2234. doi: 10.1111/j.1460-9568.2009.06980.x. [DOI] [PubMed] [Google Scholar]
- Lachaux JP, George N, Tallon-Baudry C, Martinerie J, Hugueville L, Minotti L, Kahane P, Renault B. The many faces of the gamma band response to complex visual stimuli. Neuroimage. 2005;25:491–501. doi: 10.1016/j.neuroimage.2004.11.052. [DOI] [PubMed] [Google Scholar]
- Lakatos P, Shah AS, Knuth KH, Ulbert I, Karmos G, Schroeder CE. An oscillatory hierarchy controlling neuronal excitability and stimulus processing in the auditory cortex. J Neurophysiol. 2005;94:1904–1911. doi: 10.1152/jn.00263.2005. [DOI] [PubMed] [Google Scholar]
- Lakatos P, Chen CM, O'Connell MN, Mills A, Schroeder CE. Neuronal oscillations and multisensory interaction in primary auditory cortex. Neuron. 2007;53:279–292. doi: 10.1016/j.neuron.2006.12.011. [DOI] [PMC free article] [PubMed] [Google Scholar]
- Lakatos P, Karmos G, Mehta AD, Ulbert I, Schroeder CE. Entrainment of neuronal oscillations as a mechanism of attentional selection. Science. 2008;320:110–113. doi: 10.1126/science.1154735. [DOI] [PubMed] [Google Scholar]
- Lakatos P, O'Connell MN, Barczak A, Mills A, Javitt DC, Schroeder CE. The leading sense: supramodal control of neurophysiological context by attention. Neuron. 2009;64:419–430. doi: 10.1016/j.neuron.2009.10.014. [DOI] [PMC free article] [PubMed] [Google Scholar]
- Lancaster JL, Woldorff MG, Parsons LM, Liotti M, Freitas CS, Rainey L, Kochunov PV, Nickerson D, Mikiten SA, Fox PT. Automated Talairach atlas labels for functional brain mapping. Hum Brain Mapp. 2000;10:120–131. doi: 10.1002/1097-0193(200007)10:3<120::AID-HBM30>3.0.CO;2-8. [DOI] [PMC free article] [PubMed] [Google Scholar]
- Leavitt VM, Molholm S, Ritter W, Shpaner M, Foxe JJ. Auditory processing in schizophrenia during the middle latency period (10–50 ms): high-density electrical mapping and source analysis reveal subcortical antecedents to early cortical deficits. J Psychiatry Neurosci. 2007;32:339–353. [PMC free article] [PubMed] [Google Scholar]
- Leiberg S, Lutzenberger W, Kaiser J. Effects of memory load on cortical oscillatory activity during auditory pattern working memory. Brain Res. 2006;1120:131–140. doi: 10.1016/j.brainres.2006.08.066. [DOI] [PubMed] [Google Scholar]
- Lörincz ML, Kékesi KA, Juhász G, Crunelli V, Hughes SW. Temporal framing of thalamic relay-mode firing by phasic inhibition during the alpha rhythm. Neuron. 2009;63:683–696. doi: 10.1016/j.neuron.2009.08.012. [DOI] [PMC free article] [PubMed] [Google Scholar]
- Maris E, Schoffelen JM, Fries P. Nonparametric statistical testing of coherence differences. J Neurosci Methods. 2007;163:161–175. doi: 10.1016/j.jneumeth.2007.02.011. [DOI] [PubMed] [Google Scholar]
- Mathewson KE, Gratton G, Fabiani M, Beck DM, Ro T. To see or not to see: prestimulus alpha phase predicts visual awareness. J Neurosci. 2009;29:2725–2732. doi: 10.1523/JNEUROSCI.3963-08.2009. [DOI] [PMC free article] [PubMed] [Google Scholar]
- Mehta AD, Ulbert I, Schroeder CE. Intermodal selective attention in monkeys. I: Distribution and timing of effects across visual areas. Cereb Cortex. 2000;10:343–358. doi: 10.1093/cercor/10.4.343. [DOI] [PubMed] [Google Scholar]
- Mo J, Schroeder CE, Ding M. Attentional modulation of alpha oscillations in macaque inferotemporal cortex. J Neurosci. 2011;31:878–882. doi: 10.1523/JNEUROSCI.5295-10.2011. [DOI] [PMC free article] [PubMed] [Google Scholar]
- Molholm S, Martinez A, Shpaner M, Foxe JJ. Object-based attention is multisensory: co-activation of an object's representations in ignored sensory modalities. Eur J Neurosci. 2007;26:499–509. doi: 10.1111/j.1460-9568.2007.05668.x. [DOI] [PubMed] [Google Scholar]
- Mulholland T, Goodman D, Boudrot R. Attention and regulation of EEG alpha-attenuation responses. Biofeedback Self Regul. 1983;8:585–600. doi: 10.1007/BF00998765. [DOI] [PubMed] [Google Scholar]
- Näätänen R. Processing negativity: an evoked-potential reflection of selective attention. Psychol Bull. 1982;92:605–640. doi: 10.1037/0033-2909.92.3.605. [DOI] [PubMed] [Google Scholar]
- Näätänen R, Gaillard AW, Varey CA. Attention effects on auditory EPs as a function of inter-stimulus interval. Biol Psychol. 1981;13:173–187. doi: 10.1016/0301-0511(81)90034-x. [DOI] [PubMed] [Google Scholar]
- Puig MV, Ushimaru M, Kawaguchi Y. Two distinct activity patterns of fast-spiking interneurons during neocortical UP states. Proc Natl Acad Sci U S A. 2008;105:8428–8433. doi: 10.1073/pnas.0712219105. [DOI] [PMC free article] [PubMed] [Google Scholar]
- Ray WJ, Cole HW. EEG alpha activity reflects attentional demands, and beta activity reflects emotional and cognitive processes. Science. 1985;228:750–752. doi: 10.1126/science.3992243. [DOI] [PubMed] [Google Scholar]
- Rihs TA, Michel CM, Thut G. Mechanisms of selective inhibition in visual spatial attention are indexed by alpha-band EEG synchronization. Eur J Neurosci. 2007;25:603–610. doi: 10.1111/j.1460-9568.2007.05278.x. [DOI] [PubMed] [Google Scholar]
- Rizzuto DS, Madsen JR, Bromfield EB, Schulze-Bonhage A, Seelig D, Aschenbrenner-Scheibe R, Kahana MJ. Reset of human neocortical oscillations during a working memory task. Proc Natl Acad Sci U S A. 2003;100:7931–7936. doi: 10.1073/pnas.0732061100. [DOI] [PMC free article] [PubMed] [Google Scholar]
- Rizzuto DS, Madsen JR, Bromfield EB, Schulze-Bonhage A, Kahana MJ. Human neocortical oscillations exhibit theta phase differences between encoding and retrieval. Neuroimage. 2006;31:1352–1358. doi: 10.1016/j.neuroimage.2006.01.009. [DOI] [PubMed] [Google Scholar]
- Sauseng P, Klimesch W, Stadler W, Schabus M, Doppelmayr M, Hanslmayr S, Gruber WR, Birbaumer N. A shift of visual spatial attention is selectively associated with human EEG alpha activity. Eur J Neurosci. 2005;22:2917–2926. doi: 10.1111/j.1460-9568.2005.04482.x. [DOI] [PubMed] [Google Scholar]
- Schroeder CE, Lakatos P. Low-frequency neuronal oscillations as instruments of sensory selection. Trends Neurosci. 2009a;32:9–18. doi: 10.1016/j.tins.2008.09.012. [DOI] [PMC free article] [PubMed] [Google Scholar]
- Schroeder CE, Lakatos P. The gamma oscillation: master or slave? Brain Topogr. 2009b;22:24–26. doi: 10.1007/s10548-009-0080-y. [DOI] [PMC free article] [PubMed] [Google Scholar]
- Sehatpour P, Molholm S, Schwartz TH, Mahoney JR, Mehta AD, Javitt DC, Stanton PK, Foxe JJ. A human intracranial study of long-range oscillatory coherence across a frontal-occipital-hippocampal brain network during visual object processing. Proc Natl Acad Sci U S A. 2008;105:4399–4404. doi: 10.1073/pnas.0708418105. [DOI] [PMC free article] [PubMed] [Google Scholar]
- Senkowski D, Talsma D, Herrmann CS, Woldorff MG. Multisensory processing and oscillatory gamma responses: effects of spatial selective attention. Exp Brain Res. 2005;166:411–426. doi: 10.1007/s00221-005-2381-z. [DOI] [PubMed] [Google Scholar]
- Senkowski D, Molholm S, Gomez-Ramirez M, Foxe JJ. Oscillatory beta activity predicts response speed during a multisensory audiovisual reaction time task: a high-density electrical mapping study. Cereb Cortex. 2006;16:1556–1565. doi: 10.1093/cercor/bhj091. [DOI] [PubMed] [Google Scholar]
- Snyder AC, Foxe JJ. Anticipatory attentional suppression of visual features indexed by oscillatory alpha-band power increases: a high-density electrical mapping study. J Neurosci. 2010;30:4024–4032. doi: 10.1523/JNEUROSCI.5684-09.2010. [DOI] [PMC free article] [PubMed] [Google Scholar]
- Sutoh T, Yabe H, Sato Y, Hiruma T, Kaneko S. Event-related desynchronization during an auditory oddball task. Clin Neurophysiol. 2000;111:858–862. doi: 10.1016/s1388-2457(99)00321-1. [DOI] [PubMed] [Google Scholar]
- Tallon C, Bertrand O, Bouchet P, Pernier J. Gamma-range activity evoked by coherent visual stimuli in humans. Eur J Neurosci. 1995;7:1285–1291. doi: 10.1111/j.1460-9568.1995.tb01118.x. [DOI] [PubMed] [Google Scholar]
- Taylor K, Mandon S, Freiwald WA, Kreiter AK. Coherent oscillatory activity in monkey area v4 predicts successful allocation of attention. Cereb Cortex. 2005;15:1424–1437. doi: 10.1093/cercor/bhi023. [DOI] [PubMed] [Google Scholar]
- Thut G, Nietzel A, Brandt SA, Pascual-Leone A. Alpha-band electroencephalographic activity over occipital cortex indexes visuospatial attention bias and predicts visual target detection. J Neurosci. 2006;26:9494–9502. doi: 10.1523/JNEUROSCI.0875-06.2006. [DOI] [PMC free article] [PubMed] [Google Scholar]
- Whittingstall K, Logothetis NK. Frequency-band coupling in surface EEG reflects spiking activity in monkey visual cortex. Neuron. 2009;64:281–289. doi: 10.1016/j.neuron.2009.08.016. [DOI] [PubMed] [Google Scholar]
- Womelsdorf T, Fries P. Neuronal coherence during selective attentional processing and sensory-motor integration. J Physiol Paris. 2006;100:182–193. doi: 10.1016/j.jphysparis.2007.01.005. [DOI] [PubMed] [Google Scholar]
- Worden MS, Foxe JJ, Wang N, Simpson GV. Anticipatory biasing of visuospatial attention indexed by retinotopically specific alpha-band electroencephalography increases over occipital cortex. J Neurosci. 2000;20(RC63) doi: 10.1523/JNEUROSCI.20-06-j0002.2000. [DOI] [PMC free article] [PubMed] [Google Scholar]