Abstract
We report a general strategy for developing a smart MRI contrast agent for the sensing of small molecules such as adenosine based on a DNA aptamer that is conjugated to a Gd compound and a protein streptavidin. The binding of adenosine to its aptamer results in the dissociation of the Gd compound from the large protein, leading to decreases in the rotational correlation time and thus change of MRI contrast.
Small molecules play important roles—beneficial and detrimental—in biological systems. While large biomolecules such as DNA, RNA and proteins are often detected and imaged,1–5 the speciation, concentration, and distribution of small molecules are much less commonly studied.6–11 Magnetic resonance imaging (MRI) is known to provide non-invasive two- and three-dimensional images of living specimens. A major challenge in this field is developing smart contrast agents: contrast agents that induce detectable MRI responses in the presence of specific targets.12–16 Toward this goal, Meade and coworkers reported the development of smart MRI contrast agents through the rational design and synthesis of a Ca2+-responsive chelator for gadolinium that changes the longitudinal relaxation time of water protons (referred to as T1).17,18 Since then, a number of T1-weighted smart contrast agents have been developed for metal ions such as Ca2+,17,18 Zn2+,19,20 Cu2+,21,22 and Cu+.22,23 Despite these initial successes since 1997, only a limited number of smart contrast agents have been reported,24–31 among which even less smart contrast agents are targeted for small molecules. Therefore, it is important to develop a more general strategy to obtain smart contrast agents for a broad range of small molecules. Herein, we present a general strategy for smart contrast agent development based on DNA aptamers.
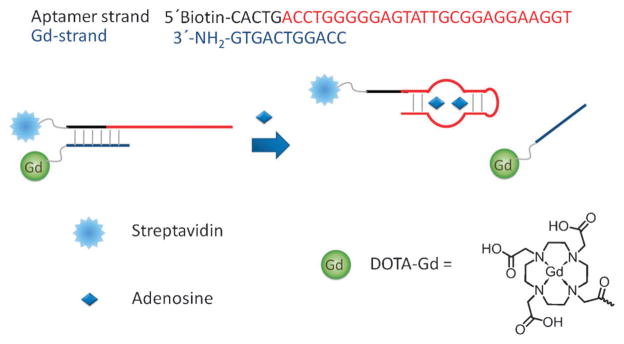
Aptamers are DNA or RNA molecules that bind to their molecular targets with high affinity and specificity.32–34 They have been obtained through in vitro selection or systematic evolution of ligands by exponential enrichment (SELEX) from a large DNA or RNA library consisting of up to 1015 different sequences.32,33,35–38 One powerful advantage of this technique is that its selection conditions can be tailored to find aptamers that can selectively interact with almost any targets, including metal ions and small organic molecules.39,40 Through this process, aptamers that bind small organic molecules, proteins, and cells have been obtained, making them a general platform for sensors and contrast agents.39,40 Because of this advantage, a number of aptamers have been designed into fluorescent,41–43 colorimetric,44–46 and electrochemical sensors47 for a wide range of targets. While a large number of these types of sensors have been reported, few smart contrast agents based on DNA aptamers have appeared in the literature. We have developed smart T2-weighted MRI contrast agents based on adenosine and thrombin aptamers and supermagnetic iron oxide nanoparticles.48,49 However, supermagnetic iron oxide nanoparticles are much less widely used clinically than gadolinium compounds are. Therefore, we have developed a new method that uses NHS chemistry to couple aptamers to gadolinium-tetraazacyclododecanetetraacetic acid (DOTA-Gd, structure in Fig. 1). DOTA-Gd is a common T1-weighted MRI contrast agent, and its structure is shown in Fig. 1.
Fig. 1.
Scheme of the design of the adenosine-responsive MRI contrast agent based on DNA aptamer.
The key to a successful smart contrast agent design is that it transforms the binding of aptamer to its target into a change in the relaxivity of the Gd-containing compound. This compound’s relaxivity change will affect the T1, which will in turn affect the MRI signal. Relaxivity of the gadolinium compounds can be predicted by the Solomon–Bloembergen–Morgan theory.13 A simplified model predicts that the relaxivity is regulated by the hydration number, the exchange rate of the bound water with the bulk water as well as the relaxation time of the bound water protons, which has complex dependence on both magnetic field strength and rotational correlation time. The latter is decided by the size of the gadolinium compound. Both modeling and experimental reports13,50 have indicated that larger molecules with higher rotational correlation time have higher relaxivity under clinical MRI scanner conditions (1.5 T). Thus, our design focuses on the target-responsive change of the size or molecular weight of the molecules conjugated to the DOTA-Gd.
We chose adenosine aptamer51 because it is an aptamer that has been well characterized, which facilitates the design of the system. As presented in Fig. 1, the system consists of an extended biotinylated adenosine aptamer strand (aptamer in red and extension in black) that is hybridized to a DOTA-Gd-containing DNA strand (in blue). The aptamer strand consists of an adenosine aptamer, which is extended by 6 bases at the 5′ end to allow it to hybridize to the Gd-strand before structural switching. In addition, this aptamer strand is biotinylated at the 5′ end to permit it to conjugate to streptavidin. The Gd-strand has an amine group at the 3′ end to allow it to conjugate to DOTA-Gd. In the absence of adenosine, these two strands hybridize, and the rotational correlation time of the gadolinium compound is increased due to its high molecular weight (~70 kDa). In the presence of adenosine, however, the aptamer dehybridizes from the Gd-strand in order to bind adenosine. The release of the DOTA-Gd-coupled Gd-strand from the aptamer–streptavidin conjugate decreases the molecular weight of the Gd compound to about 4 kDa. As a result, the T1 increases, detectably changing the brightness of the MRI signal. The T1 increase leads to a turn-off MRI response. However, compared with previously reported smart MRI contrast agents based on superparamagnetic nanoparticles,48,49 the gadolinium-based contrast agent is smaller in size and easier for intracellular imaging.
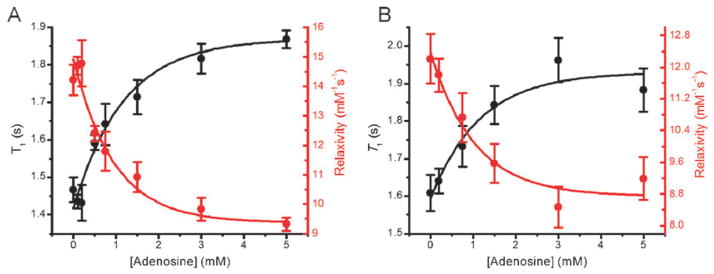
To confirm the design shown in Fig. 1, 30 μM of both DNA strands were annealed in 50mM Tris buffer (pH 8.35) containing 300 mM NaCl, 5 mM MgCl2, and 30 μM streptavidin. The addition of increasing concentrations of adenosine increased the T1 from 1.43 s to 1.59 s at 0.5 mM adenosine, to finally 1.87 s at 3 mM adenosine (Fig. 2A, black trace). Correspondingly, the relaxivity of the gadolinium compound decreased from 14.2 mM−1 s−1 to 9.3 mM−1 s−1 when 5 mM adenosine was present (Fig. 2A, red trace). Adenosine concentrations higher than 5 mM were not used in this analysis because of solubility limitations.
Fig. 2.
T1 (black trace) and the relaxivity (red trace) of the gadolinium compound responded to the presence of adenosine in both buffer (A) and 10% human serum (B).
To investigate whether this MRI contrast agent can be potentially used in biological samples, we measured the T1 with various concentrations of adenosine in the presence of 10% human serum. The T1 increased from 1.61 s when adenosine was absent to 1.96 s when 3 mM adenosine was present (Fig. 2B, black trace). The relaxivity of the gadolinium compound decreased from 12.2 mM−1 s−1 when adenosine was absent to 9.2 mM−1 s−1 when 3 mM adenosine was present (Fig. 2B, red trace). The results suggest that this system is compatible with samples containing human serum. The T1 response to adenosine saturated when the concentration was higher than 3 mM. The presence of human serum decreased the relative relaxivity change and binding affinity slightly, probably due to non-specific binding to the Gd-DOTA by other proteins in serum, resulting in a decrease in the effective concentration of complex available to interact with adenosine.
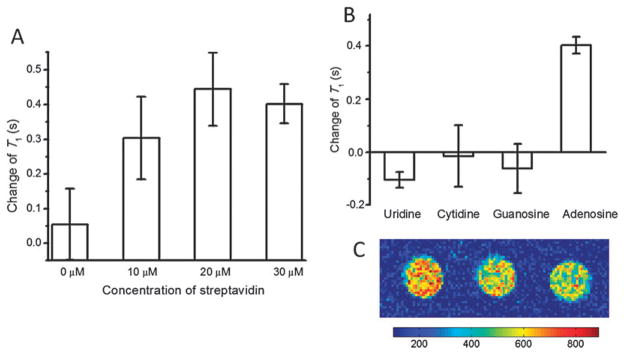
To investigate whether the T1 increases were due to the dissociation of the Gd-strand from streptavidin as shown in Fig. 1, we prepared several solutions of the contrast agent with different concentrations of streptavidin and measured the T1 changes in the presence of 5 mM adenosine. As shown in Fig. 3A, in the absence of streptavidin, the T1 changed by 0.05 s, within the error of measurement. The T1 increase was significant with 10 μM streptavidin and reached the maximum when streptavidin was present at concentrations greater than 20 μM. These results indicate the importance of streptavidin.
Fig. 3.
(A) The T1 change in response of 5 mM adenosine with various concentrations of streptavidin. (B) The selectivity of the MRI contrast agent—the T1 increase (positive T1 change) can only be observed when adenosine is present. (C) The magnetic resonance images at 1.5 T of the adenosine aptamer-based contrast agent solution before (left) and after (middle) the addition of 5 mM adenosine. The right sample contains 30 μM DOTA-Gd strand and streptavidin separately to simulate the complete release of the Gd-strand.
Furthermore, the selectivity of the smart contrast agent was tested by measuring the response of the contrast agent toward 5 mM of either cytidine, guanine, or uridine as shown in Fig. 3B. While the addition of adenosine increased T1, the addition of the same concentration of cytidine, guanine or uridine did not, indicating the high selectivity of this contrast agent.
Finally, images were acquired with an MRI scanner. As shown in Fig. 3C, the images went from bright in the absence of adenosine (left) to darker in the presence of 5 mM adenosine (middle), which is similar to the image of a control sample containing 30 μM DOTA-Gd coupled DNA strand (Gd-strand) and streptavidin separately (right), to mimic 100% release of the DOTA-Gd coupled DNA strand shown in Fig. 1. These results are consistent with an increase of T1 of the system demonstrated in Fig. 2, and suggest that, although the T1 increase is only ~30% in the presence of adenosine, it can produce a significant contrast change in an image.
In conclusion, we have designed and demonstrated smart and selective T1-weighted MRI contrast agents for adenosine based on its aptamer. The streptavidin was used as a proof of concept, which can be replaced by other molecules commonly found in biology for in vivo MRI. Since in vitro selection can be used to obtain DNA aptamers for a wide range of targets, the method shown here can be applied to the design of smart MRI contrast agents selective for many other targets. The contrast agent presented herein is an early step of the application of DNA aptamers in molecular MRI. As the turn-on signal is more preferred for diagnostic purposes, future research will be focused on aptamer-based smart MRI contrast agents with turn-on responses. Further improvement of the MRI contrast effect is also required for clinical applications. To achieve the goal, the molecular weight of the protein coupled to the system can be further increased to maximize the relaxivity change, and such a change in rotation correlation be coupled to other methods of eliciting a relaxivity change, such as regulating change in hydration numbers upon binding the target of the aptamers.
Supplementary Material
Acknowledgments
This work was supported by the U.S. National Institutes of Health (ES16865) and the Department of Energy (DE-FG02-08ER64568). We wish to thank Drs Thomas Meade, Keith MacRennaris, and Ying Song of Northwestern University for helpful discussions and the use of their relaxometer, Dr Edward Treadwell of Eastern Illinois University for the use of his 60 MHz NMR spectrometer, Ms Nancy Dodge for the acquisition of the MRI signals, Dr Boris Odintsov for the revision of the draft and Ms Hannah Ihms for her proofreading.
Footnotes
This article is part of a ChemComm ‘Supramolecular Chemistry’ web-based themed issue marking the International Year of Chemistry 2011.
Electronic supplementary information (ESI) available: Detailed synthesis of DOTA-Gd conjugated oligonucleotides, sample preparation, T1 measurements and MRI acquisition. See DOI: 10.1039/c1cc10161g
Notes and references
- 1.Navani NK, Li Y. Curr Opin Chem Biol. 2006;10:272–281. doi: 10.1016/j.cbpa.2006.04.003. [DOI] [PubMed] [Google Scholar]
- 2.Sosnovik DE, Weissleder R. Curr Opin Biotechnol. 2007;18:4–10. doi: 10.1016/j.copbio.2006.11.001. [DOI] [PubMed] [Google Scholar]
- 3.Mizukami S, Takikawa R, Sugihara F, Hori Y, Tochio H, Waelchli M, Shirakawa M, Kikuchi K. J Am Chem Soc. 2008;130:794–795. doi: 10.1021/ja077058z. [DOI] [PubMed] [Google Scholar]
- 4.Mi L, Zhang X, Yang W, Wang L, Huang Q, Fan C, Hu J. J Nanosci Nanotechnol. 2009;9:2247–2255. doi: 10.1166/jnn.2009.se25. [DOI] [PubMed] [Google Scholar]
- 5.Mizukami S, Takikawa R, Sugihara F, Shirakawa M, Kikuchi K. Angew Chem, Int Ed. 2009;48:3641–3643. doi: 10.1002/anie.200806328. [DOI] [PubMed] [Google Scholar]
- 6.Fan C, Plaxco KW, Heeger AJ. Proc Natl Acad Sci U S A. 2003;100:9134–9137. doi: 10.1073/pnas.1633515100. [DOI] [PMC free article] [PubMed] [Google Scholar]
- 7.Chen P, He C. J Am Chem Soc. 2004;126:728–729. doi: 10.1021/ja0383975. [DOI] [PubMed] [Google Scholar]
- 8.Allen MJ, Meade TJ. Met Ions Biol Syst. 2004;42:1–38. [PubMed] [Google Scholar]
- 9.Jiang P, Guo Z. Coord Chem Rev. 2004;248:205–229. [Google Scholar]
- 10.Fowler CC, Li Y. Chem Biol. 2007;14:736–738. doi: 10.1016/j.chembiol.2007.07.003. [DOI] [PubMed] [Google Scholar]
- 11.Zuo X, Song S, Zhang J, Pan D, Wang L, Fan C. J Am Chem Soc. 2007;129:1042–1043. doi: 10.1021/ja067024b. [DOI] [PubMed] [Google Scholar]
- 12.Lauffer RB. Chem Rev. 1987;87:901–927. [Google Scholar]
- 13.Caravan P, Ellison JJ, McMurry TJ, Lauffer RB. Chem Rev. 1999;99:2293–2352. doi: 10.1021/cr980440x. [DOI] [PubMed] [Google Scholar]
- 14.Meade TJ, Taylor AK, Bull SR. Curr Opin Neurobiol. 2003;13:597–602. doi: 10.1016/j.conb.2003.09.009. [DOI] [PubMed] [Google Scholar]
- 15.Que EL, Chang CJ. Chem Soc Rev. 2010;39:51–60. doi: 10.1039/b914348n. [DOI] [PubMed] [Google Scholar]
- 16.Kikuchi K. Chem Soc Rev. 2010;39:2048–2053. doi: 10.1039/b819316a. [DOI] [PubMed] [Google Scholar]
- 17.Li W-h, Fraser SE, Meade TJ. J Am Chem Soc. 1999;121:1413–1414. [Google Scholar]
- 18.Li W-h, Parigi G, Fragai M, Luchinat C, Meade TJ. Inorg Chem. 2002;41:4018–4024. doi: 10.1021/ic0200390. [DOI] [PubMed] [Google Scholar]
- 19.Hanaoka K, Kikuchi K, Urano Y, Nagano T. J Chem Soc, Perkin Trans. 2001;2:1840–1843. [Google Scholar]
- 20.Hanaoka K, Kikuchi K, Urano Y, Narazaki M, Yokawa T, Sakamoto S, Yamaguchi K, Nagano T. Chem Biol. 2002;9:1027–1032. doi: 10.1016/s1074-5521(02)00216-8. [DOI] [PubMed] [Google Scholar]
- 21.Que EL, Chang CJ. J Am Chem Soc. 2006;128:15942–15943. doi: 10.1021/ja065264l. [DOI] [PubMed] [Google Scholar]
- 22.Que EL, Gianolio E, Baker SL, Wong AP, Aime S, Chang CJ. J Am Chem Soc. 2009;131:8527–8536. doi: 10.1021/ja900884j. [DOI] [PubMed] [Google Scholar]
- 23.Que EL, Gianolio E, Baker SL, Aime S, Chang CJ. Dalton Trans. 2010;39:469–476. doi: 10.1039/b916931h. [DOI] [PubMed] [Google Scholar]
- 24.Moats RA, Fraser SE, Meade TJ. Angew Chem, Int Ed Engl. 1997;36:726–728. [Google Scholar]
- 25.Zhang S, Wu K, Sherry AD. Angew Chem, Int Ed. 1999;38:3192–3194. [PubMed] [Google Scholar]
- 26.Louie AY, Huber MM, Ahrens ET, Rothbacher U, Moats R, Jacobs RE, Fraser SE, Meade TJ. Nat Biotechnol. 2000;18:321–325. doi: 10.1038/73780. [DOI] [PubMed] [Google Scholar]
- 27.De Leon-Rodriguez LM, Ortiz A, Weiner AL, Zhang S, Kovacs Z, Kodadek T, Sherry AD. J Am Chem Soc. 2002;124:3514–3515. doi: 10.1021/ja025511v. [DOI] [PubMed] [Google Scholar]
- 28.Aime S, Delli Castelli D, Fedeli F, Terreno E. J Am Chem Soc. 2002;124:9364–9365. doi: 10.1021/ja0264044. [DOI] [PubMed] [Google Scholar]
- 29.Raghunand N, Howison C, Sherry AD, Zhang S, Gillies RJ. Magn Reson Med. 2003;49:249–257. doi: 10.1002/mrm.10347. [DOI] [PubMed] [Google Scholar]
- 30.Frullano L, Catana C, Benner T, Sherry AD, Caravan P. Angew Chem, Int Ed. 2010;49:2382–2384. doi: 10.1002/anie.201000075. [DOI] [PMC free article] [PubMed] [Google Scholar]
- 31.Caravan P. Acc Chem Res. 2009;42:851–862. doi: 10.1021/ar800220p. [DOI] [PubMed] [Google Scholar]
- 32.Bock LC, Griffin LC, Latham JA, Vermaas EH, Toole JJ. Nature. 1992;355:564–566. doi: 10.1038/355564a0. [DOI] [PubMed] [Google Scholar]
- 33.Ellington AD, Szostak JW. Nature. 1992;355:850–852. doi: 10.1038/355850a0. [DOI] [PubMed] [Google Scholar]
- 34.Gold L, Polisky B, Uhlenbeck O, Yarus M. Annu Rev Biochem. 1995;64:763–797. doi: 10.1146/annurev.bi.64.070195.003555. [DOI] [PubMed] [Google Scholar]
- 35.Breaker RR. Curr Opin Chem Biol. 1997;1:26–31. doi: 10.1016/s1367-5931(97)80105-6. [DOI] [PubMed] [Google Scholar]
- 36.Tuerk C, Gold L. Science. 1990;249:505–510. doi: 10.1126/science.2200121. [DOI] [PubMed] [Google Scholar]
- 37.Ellington AD, Szostak JW. Nature. 1990;346:818–822. doi: 10.1038/346818a0. [DOI] [PubMed] [Google Scholar]
- 38.Breaker RR, Joyce GF. Chem Biol. 1994;1:223–229. doi: 10.1016/1074-5521(94)90014-0. [DOI] [PubMed] [Google Scholar]
- 39.Li Y, Lu Y. Functional Nucleic Acids for Sensing and Other Analytical Applications. Springer; New York: 2009. [Google Scholar]
- 40.Liu J, Cao Z, Lu Y. Chem Rev. 2009;109:1948–1998. doi: 10.1021/cr030183i. [DOI] [PMC free article] [PubMed] [Google Scholar]
- 41.Nutiu R, Li Y. J Am Chem Soc. 2003;125:4771–4778. doi: 10.1021/ja028962o. [DOI] [PubMed] [Google Scholar]
- 42.Nutiu R, Li Y. Angew Chem, Int Ed. 2005;44:1061–1065. doi: 10.1002/anie.200461848. [DOI] [PubMed] [Google Scholar]
- 43.Xu W, Lu Y. Anal Chem. 2010;82:574–578. doi: 10.1021/ac9018473. [DOI] [PMC free article] [PubMed] [Google Scholar]
- 44.Liu J, Lu Y. Angew Chem, Int Ed. 2006;45:90–94. [Google Scholar]
- 45.Stojanovic MN, Landry DW. J Am Chem Soc. 2002;124:9678–9679. doi: 10.1021/ja0259483. [DOI] [PubMed] [Google Scholar]
- 46.Liu J, Lu Y. Nat Protoc. 2006;1:246–252. doi: 10.1038/nprot.2006.38. [DOI] [PubMed] [Google Scholar]
- 47.Xiao Y, Lubin AA, Heeger AJ, Plaxco KW. Angew Chem, Int Ed. 2005;44:5456–5459. doi: 10.1002/anie.200500989. [DOI] [PubMed] [Google Scholar]
- 48.Yigit MV, Mazumdar D, Kim HK, Lee JH, Odintsov B, Lu Y. ChemBioChem. 2007;8:1675–1678. doi: 10.1002/cbic.200700323. [DOI] [PubMed] [Google Scholar]
- 49.Yigit MV, Mazumdar D, Lu Y. Bioconjugate Chem. 2008;19:412–417. doi: 10.1021/bc7003928. [DOI] [PubMed] [Google Scholar]
- 50.Caravan P, Farrar CT, Frullano L, Uppal R. Contrast Media Mol Imaging. 2009;4:89–100. doi: 10.1002/cmmi.267. [DOI] [PMC free article] [PubMed] [Google Scholar]
- 51.Huizenga DE, Szostak JW. Biochemistry. 1995;34:656–665. doi: 10.1021/bi00002a033. [DOI] [PubMed] [Google Scholar]
Associated Data
This section collects any data citations, data availability statements, or supplementary materials included in this article.


