Abstract
The major components of the cartilage extracellular matrix are type II collagen and aggrecan. Matrix metalloproteinase 13 (MMP-13) has been implicated as the protease responsible for collagen degradation in cartilage during osteoarthritis (OA). In the present study, a triple-helical FRET substrate has been utilized for high throughput screening (HTS) of MMP-13 with the MLSCN compound library (n ~ 65,000). Thirty-four compounds from the HTS produced pharmacological dose-response curves. A secondary screen using RP-HPLC validated 25 compounds as MMP-13 inhibitors. Twelve of these compounds were selected for counter-screening with 6 representative MMP family members. Five compounds were found to be broad-spectrum MMP inhibitors, 3 inhibited MMP-13 and one other MMP, and 4 were selective for MMP-13. One of the selective inhibitors was more active against MMP-13 triple-helical peptidase activity compared with single-stranded peptidase activity. Since the THP FRET substrate has distinct conformational features that may interact with MMP secondary binding sites (exosites), novel non-active site binding inhibitors may be identified via HTS protocols utilizing such assays.
1. Introduction
Collagen is vital in stabilizing connective tissue and maintaining the structural integrity of the human body (reviewed in 1). The natural breakdown of collagen is critical to physiological processes such as embryogenesis and bone remodeling. On the other hand, the hydrolysis of collagen triple-helical structure (collagenolysis) can also give rise to a variety of pathologies, including tumor cell spreading (metastasis), arthritis, glomerulonephritis, periodontal disease, and tissue ulcerations 2–7.
Osteoarthritis (OA) is an age-related debilitating disease affecting more than 80% of people over the age of 75, caused by the destruction of articular cartilage 8. Extracellular matrix (ECM) proteins make up approximately 90% of the dry weight of human cartilage 9. The major components of the cartilage ECM are type II collagen and the chondroitin sulfate proteoglycan, aggrecan. Type II collagen provides cartilage with its tensile strength, while the water-binding capacity of aggrecan provides compressibility and elasticity 10. Cartilage destruction associated with OA has been shown to be due to increased catabolism rather than decreased synthesis 11. The triple-helical structure of collagen bestows resistance to degradation by many mammalian proteases. However, the matrix metalloprotease (MMP) family has several members that can cleave collagen. Therefore, the study of collagenolytic MMPs has been pursued in reference to OA.
Proteases with potential roles in OA include MMP-1, MMP-13, and members of the a disintegrin and metalloproteinase with thrombospondin motifs (ADAMTS) family (i.e., ADAMTS-4 and ADAMTS-5) 12–16. MMP-13 is believed to be the more prominent collagenase than MMP-1 in OA 12,17. Thus, a goal of OA researchers is the design of selective MMP-13 inhibitors 18–21. To obtain novel lead compounds that are pharmacologically active against MMP-13, high throughput screening (HTS) protocols have been utilized 18,20.
A continuous assay method, such as one that utilizes an increase in fluorescence upon hydrolysis, allows for rapid and convenient kinetic evaluation of proteases, both in solution and cell surface bound. For the specific application of collagenolytic MMPs, triple-helical peptides (THPs) have been developed as substrates to measure MMP activities. These triple-helical substrates utilize fluorescence resonance energy transfer (FRET)/intramolecular fluorescence energy transfer via incorporation of the (7-methoxycoumarin-4-yl)acetyl (Mca) derivative as the fluorophore and the 2,4-dinitrophenyl (Dnp) group as the quencher within the same peptide chain 22–24. Typically, the P5′ position of the substrate accommodates Lys(Dnp) while the P5 position accommodates Lys(Mca).
FRET THP (fTHP) substrate assays have been utilized with 96- and 384-well plates 22,23,25–30. HTS for MMPs has been previously established using FRET substrates with Mca as fluorophore and Dnp as quencher 31–35. Because the THPs have distinct conformational features that interact with protease secondary binding sites (exosites) 30, these substrates can be utilized for the identification of non-active site binding inhibitors. Exosites have been shown to represent unique opportunities for the design of selective inhibitors 36,37. Initial clinical trials with MMP inhibitors were disappointing, with one of the problematic features being a lack of selectivity 38–40. Selective exosite-binding inhibitors for MMP-13 could represent a potential next generation in metalloproteinase therapeutics for OA.
The THP substrate fTHP-15 [(Gly-Pro-Hyp)5-Gly-Pro-Lys(Mca)-Gly-Pro-Gln-Gly~Leu-Arg-Gly-Gln-Lys(Dnp)-Gly-Val-Arg-(Gly-Pro-Hyp)5-NH2] has been utilized in the present study for screening of a compound library (n ~ 65,000) against MMP-13 in a 1536-well format. The overall quality of the screen was extensively examined. Inhibitory compounds from the primary screen were then confirmed by an RP-HPLC secondary screen. The selectivity of inhibitors confirmed in the secondary screen was examined by a counter-screening against other MMPs and a single-stranded substrate.
2. Results
2.1. Primary HTS campaign to identify inhibitors of MMP-13
In order to discover novel inhibitors of MMP-13 a publicly available library was screened under the auspices of the Molecular Library Screening Center Network (MLSCN), an initiative sponsored by the National Institutes of Health (NIH). The MLSCN screening file, consisting of 64,928 unique compounds, was tested as a single batch within an 8 h window. At steady state throughput was approximately ten 1536-well plates/h.
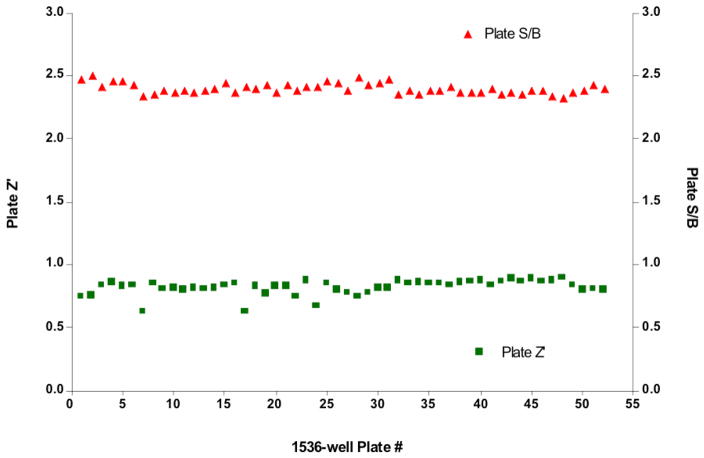
The MMP-13 primary HTS campaign yielded consistent plate-to-plate results (Figure 1). Despite a relatively low average plate S/B of 2.4 ± 0.04 (n = 52 plates), the average Z′-factor of all plates tested was 0.82 ± 0.06, signifying that the assay window was acceptable for the campaign. Additionally, the positive control [pyrimidine-4,6-dicarboxylic acid, bis-(4-fluoro-3-methyl-benzylamide)] had a reproducible IC50 (105 nM ± 1.03). When tested with a linear substrate its IC50 against MMP-13 was 8 nM 41. These results are consistent with another recent study, where different IC50 values were observed for pyrimidine-4,6-dicarboxylic acid, bis-(4-fluoro-3-methyl-benzylamide) inhibition of MMP-13 activities towards single-stranded and triple-helical substrates 42. The apparent change in potency of the inhibition control compound can be attributed to the differences in interactions between linear and triple-helical substrates with MMP-13. fTHP-15 was designed to mimic a MMP-13 cognate substrate, collagen, and thus, hypothetically, interacts with the enzyme utilizing more collagen-binding exosites than a linear, non-collagen-like, substrate 23. Pyrimidine-4,6-dicarboxylic acid, bis-(4-fluoro-3-methyl-benzylamide) targets an exosite of MMP-13 41 and thus different IC50 values based on the substrate assayed are understandable.
Figure 1.
MMP-13 primary campaign plate statistics. Graphs represent the quality control statistics for each plate tested in the primary HTS campaign (n = 52). As defined by plate Z′-factor (solid squares) and plate S/B (solid triangles) the MMP-13 primary HTS campaign yielded consistent plate-to-plate results. The average Z′-factor of all plates tested was 0.82 ± 0.06, with an average plate S/B of 2.4 ± 0.04 (n = 52 plates). Details of data treatment are given in the text.
Described in detail below, the calculated plate Z-factors of the primary HTS campaign were highly variable, attributed to the presence of fluorescent compounds in the MLSCN screening file. Due to this assay artifact, a modified rule was used to determine active compounds (“hits”), described in detail in Experimental. Application of this rule yielded a cutoff of 13.85% inhibition, resulting in 46 nominally active compounds (Table 1). This constituted a hit rate of 0.07% for the primary HTS campaign.
Table 1.
Summarized HTS campaign results for the inhibitors of MMP-13 triple-helical peptidase activity
| Statistics | Cutoff Parameter, % Inhibition | |||||
|---|---|---|---|---|---|---|
| Testing Stage | MMP-13 actives (#) | Total hit rate (%) | Artifacts (#) | Compounds tested (#) | 3SD + Ave | 3SD − Ave |
| Primary Assay | 46 | 0.07 | 5458 | 64,928 | 13.85 | −10.66 |
| Dose-response Assay (non-fluorescent) | 30 | 0.05 | N/A | 42 | N/A | N/A |
| Autofluorescent Assay | 8 | 0.16 | N/A | 5,149 | 68.46 | N/A |
| Dose-response Assay (autofluorescent) | 4 | 0.08 | N/A | 8 | N/A | N/A |
2.2. Observation and treatment of primary HTS data influenced by the presence of fluorescent test compounds
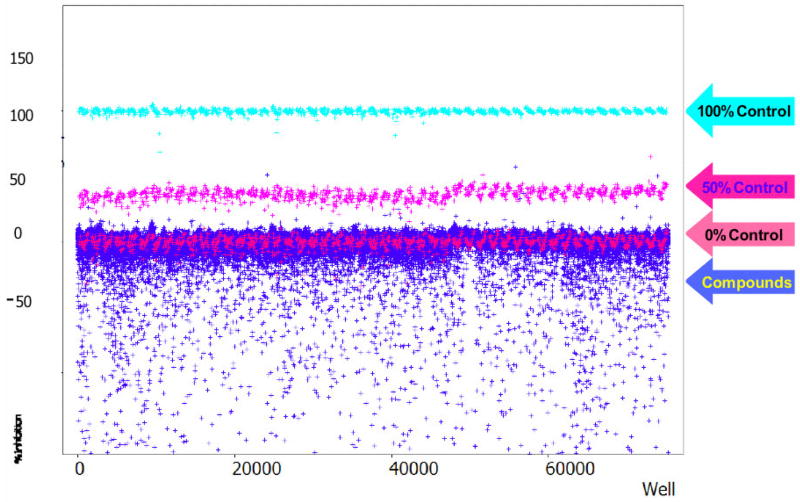
As mentioned above, despite its high Z′-factor the test compound results of the primary HTS campaign revealed a relatively large amount of scatter in negative inhibition values (Figure 2). This scatter had a deleterious effect on the calculated plate Z-factor (Z = −0.42 ± 0.55, n = 52). The majority of this scatter was attributed to a detection format artifact. Namely, the substrate fluorophore, 7-methoxycoumarin, was excited at a wavelength bandpass of 325 ± 75 nm, overlapping the UV absorbance spectrum of aromatic and conjugated hydrocarbons found in typical screening files. Interference due to test compound “autofluorescence” can be a liability of Mca-based assays as documented elsewhere 43–46.
Figure 2.
MMP-13 primary HTS campaign scattergram. Graphed are the percent inhibition values for every well tested in the primary HTS campaign. Definitions of the controls are given in detail in the text. Note the large amount of “negative inhibitors” in the bottom part of the plot. The negative inhibition scatter is attributed to the substrate fluorophore (7-methoxycoumarin) excitation wavelength, making the primary HTS campaign assay prone to the interference from fluorescent compounds contained in the screening file.
The interference precluded using a common approach to determine hit rate in the primary HTS campaign, i.e., one that employs a multiple of the standard deviation of all test compound results as a cutoff parameter 47. In its place we used the sum of an average and three standard deviations of one of the control plates (modified 3SD ± Ave rule), which did not use any of the test compounds in the sample field. This treatment of the data had the desired effect; a relatively small number of compounds exceeded the cutoff parameter (n = 46), and allowed us to focus on this subset for our lower-throughput follow-up assays.
In order to quantitatively identify the subset of fluorescent compounds responsible for the interference, a modified cutoff, similar to that used for inhibitors, was applied (see Experimental). Based on this calculation, a well that had an inhibition value of lower than −10.66% indicated the presence of a fluorescent test compound in the assay well (Table 1). This cutoff would also include other well artifacts that behaved similar to a fluorescent compound, e.g. lint or dust.
2.3. Primary HTS assay frequency distribution analysis
To determine whether all primary HTS data behaved as a Gaussian distribution, we conducted a distribution frequency analysis of the primary campaign results. Two separate analyses were performed; one with the results from the fluorescent compounds included in the primary HTS campaign data set, and the other with their results excluded. The primary HTS campaign exhibited a mean inhibition value of 0.833% ± 0.031 (R2 = 0.990; n = 64,928) (Figure 3A). As expected, the presence of fluorescent compounds was readily apparent as the tail of the plotted frequency distribution. When the HTS data was re-plotted without these fluorescent artifacts (Figure 3B), the primary campaign had a mean inhibition value of 0.835% ± 0.026 (n = 59,470). The fit to the bell-shaped Gaussian distribution was improved for this data set (R2 = 0.993), an expected result of removing the non-random fluorescent artifact from random pharmacologic inhibition data. Overall, the results of all frequency distribution analyses were concordant with Gaussian distribution (as evidenced by R2 values) whether the analysis was conducted with or without the fluorescent assay artifacts. Additionally, the mean inhibition value also was not significantly affected by the presence of artifacts, thus validating the usage of statistical 3SD + Ave rule for hit-picking.
Figure 3.
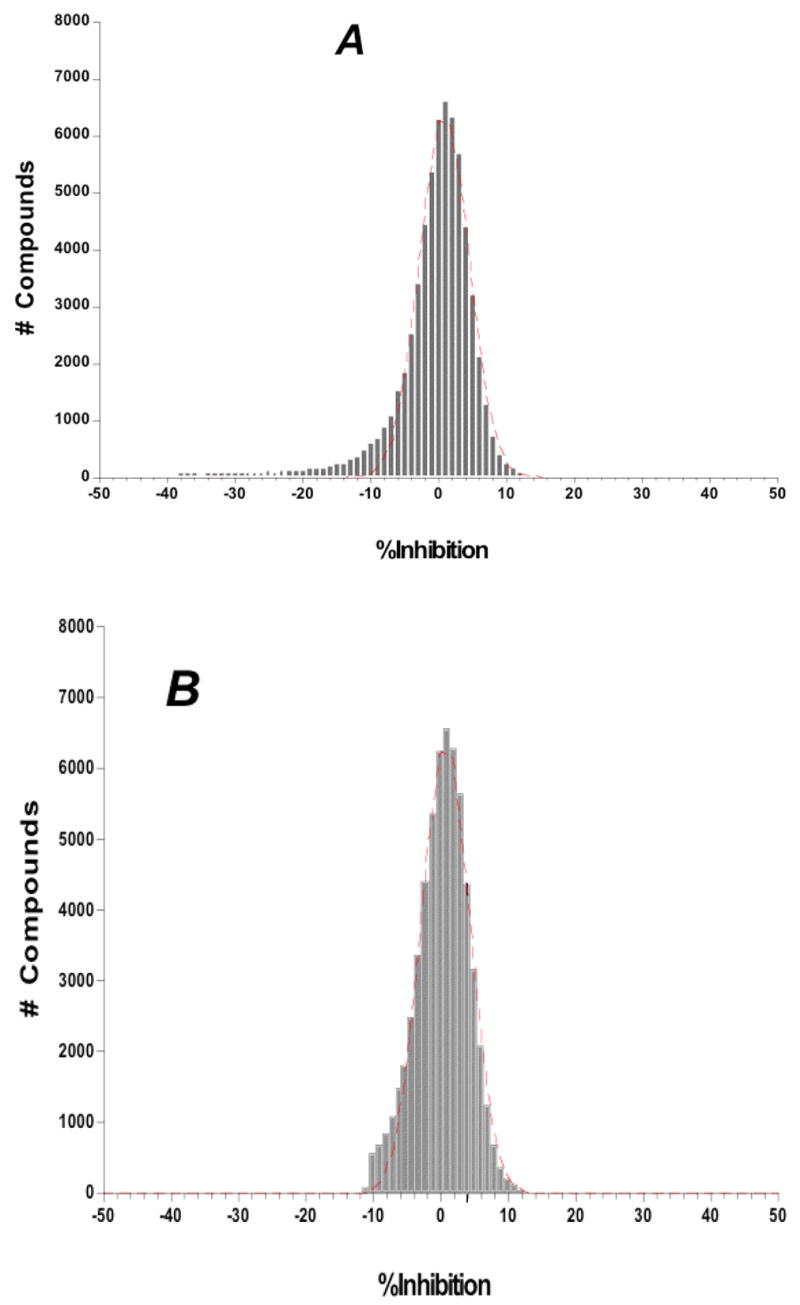
Frequency distribution analysis from the MMP-13 primary HTS campaign and the screening assay for autofluorescent inhibitors of MMP-13. Shown are the results of the primary HTS campaign (A) with fluorescent artifacts included in the analysis and (B) without the fluorescent artifacts included. The primary campaign exhibited a mean inhibition value of 0.833% ± 0.031 (R2 = 0.990; n = 64,928). When plotted without the fluorescent artifacts the primary campaign had a mean inhibition value of 0.835% ± 0.026 (R2 = 0.993; n = 59,470). Note the larger negative inhibition tail in (A), ameliorated in (B), which is attributed to fluorescent compounds within the screening file. In the case of the Gaussian distribution analysis all the % inhibition values were binned in 1% wide bins and Ave +/− SD was calculated based on these bins instead of raw % inhibition values that were used to determine the hit cutoff parameter.
2.4. Assay to identify inhibitors of MMP-13 within the large subset of autofluorescent compounds found in the primary HTS campaign
An importance of the HTS campaign was to identify all possible inhibitors of MMP-13, regardless of their intrinsic fluorescent properties. To this end a secondary assay was devised to measure MMP-13 inhibition of compounds suspected to be fluorescent from the primary HTS campaign. Due to the long incubation time (4 h) of the enzymatic reaction, fluorescence emanating from substrate turnover was determined to be negligible if measured immediately after the start of the reaction. This fact influenced our decision to subtract background fluorescence (which would include the component of fluorescence due to test compound) at enzymatic reaction initiation from the signal of fluorophore released from the substrate by the MMP-13 activity after 4 h of incubation. Most importantly, the pharmacology of the positive control [pyrimidine-4,6-dicarboxylic acid, bis-(4-fluoro-3-methyl-benzylamide)] was unaffected by this approach. Its IC50 value of 91 nM ± 1.01 (n = 16) calculated using the • RFU normalization approach was comparable with the IC50 values calculated by “raw RFU” approach (see Table 2).
Table 2.
Summarized quality control parameters for the different 1536-well format assays to discover inhibitors of MMP-13 triple-helical peptidase activity
| Testing Stage | Plate Z′, Mean ± SD | QC Parameter Plate S/B, Mean ± SD | Pharmacology control IC50 (nM) (n=16) |
|---|---|---|---|
| Primary HTS Assay (n = 52) | 0.86 ± 0.05 | 2.8 ± 0.14 | 105 ± 1.03 |
| Dose Response Assay (non-fluorescent) (n = 3) | 0.77 ± 0.12 | 2.5 ± 0.01 | 89 ± 1.02 |
| Autofluorescent Assay (n = 15) | 0.82 ± 0.07 | 2.9 ± 0.10 | 91 ± 1.01 |
| Dose Response Assay (autofluorescent) (n = 3) | 0.83 ± 0.01 | 2.4 ± 0.04 | 229 ± 2.1 |
As implemented, this assay had a different robotic protocol compared to the original primary HTS assay protocol. To facilitate the identification of fluorescent artifacts, well fluorescence was measured immediately after the addition of test compound, enzyme, and substrate to the microtiter plate. Similar to the HTS campaign, autofluorescent compounds (n = 5,149) were tested in triplicate at single concentration of 4 μM. Using a standardized 68.46% inhibition cutoff parameter (see Experimental) 47, 8 compounds were scored as possible MMP-13 inhibitors (see Table 1). For this assay, the average plate Z′-factor was 0.82 ± 0.07, and plate S/B was 2.9 ± 0.01. The average plate Z-factor was found to be dramatically improved (Ave Z = 0.31 ± 0.12, n = 15) as compared to the primary HTS campaign (Ave Z = −0.42 ± 0.55, n = 52).
2.5. Dose-response assay for non-fluorescent MMP-13 inhibitors
Of the 46 compounds total that were scored as active during the primary HTS campaign, 42 were tested in dose-response experiments. Of these, 30 compounds produced pharmacological dose response curves (see Table 1). For this assay, the average plate Z′-factor and S/B were 0.77 ± 0.12 (n = 3) and 2.5 ± 0.01 (n = 3), respectively. These values were comparable to those of the primary HTS campaign. Similarly, the positive control compound IC50 was 89 ± 1.02 nM (see Table 2).
2.6. Dose-response assay for autofluorescent MMP-13 inhibitors
All 8 compounds that were scored as nominally active in the assay for autofluorescent MMP-13 inhibitors were tested in dose-response experiments in triplicate, using 10 point, 1:3 serial dilutions starting at a nominal test concentration of 40 μM. In these experiments, 4 out of 8 tested compounds produced pharmacological dose response curves (see Table 1). The average plate Z′-factor was 0.83 ± 0.01, S/B was 2.4 ± 0.04, and the positive control compound IC50 was 229 nM ± 2.1 (n = 16) (see Table 2).
2.7. Secondary screen of MMP-13 inhibitors
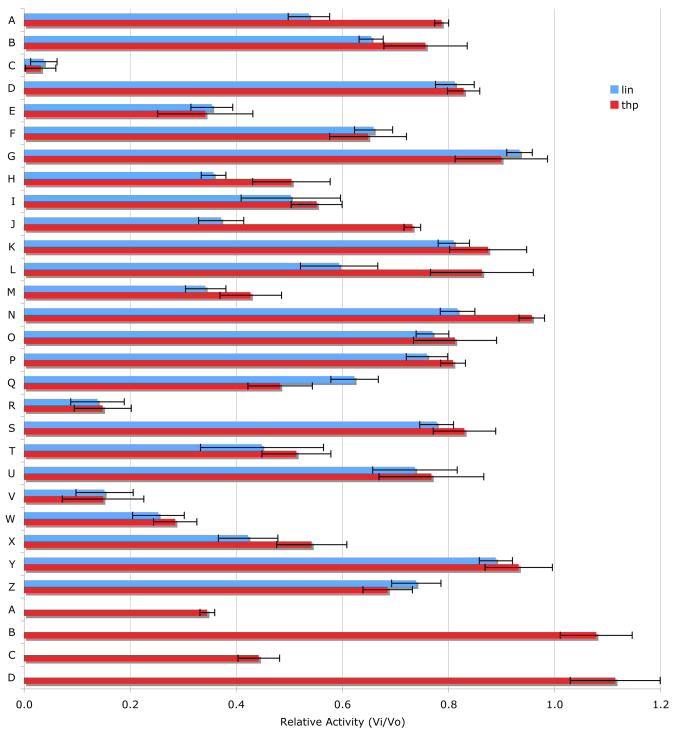
Thirty four compounds from the HTS produced pharmacological dose-response curves. An RP-HPLC based secondary screen was performed on 30 of these compounds (Table 3). Compounds were chosen based on their commercial availability. Two substrates were utilized, one single-stranded (Knight fSSP) and one triple-helical (fTHP-15). The assay was initiated in 384-well plate format and fluorescence intensity of the wells was read over time. After 1.5–4 h the samples were analyzed by RP-HPLC and the yield of products was determined by integration of the peaks. The results obtained by the two methods were compared. Of the initial 30 compounds, 25 inhibited MMP-13 activity (Figure 4). Amongst the most interesting results, compounds C, R, V, W, A′, and C′ were the best inhibitors (Figure 4). Compounds J and L were better inhibitors against the SSP substrate, while compound Q was a better inhibitor against the THP substrate.
Table 3.
Compounds examined in the secondary screen
| Code | MLS # | Vendor | Vendor Cat # | IC50 (μM) |
|---|---|---|---|---|
| A | MLS000075845 | Asinex | BAS 08769335 | 13.3 |
| B | MLS000035239 | Asinex | ASN 05830127 | 4.7 |
| C | MLS000075919 | Asinex | BAS 07869980 | 2.1 |
| D | MLS000035419 | Asinex | BAS 06754276 | 9.9 |
| E | MLS000073086 | Asinex | BAS 04834866 | 2.5 |
| F | MLS000068249 | Asinex | ASN 04363458 | 9.4 |
| G | MLS000027771 | Asinex | BAS 09533241 | 15.3 |
| H | MLS000031372 | Asinex | BAS 00506290 | 10.9 |
| I | MLS000071970 | Asinex | BAS 00506281 | 24.7 |
| N | MLS000051260 | ChemBridge | 7925560 | 6.8 |
| P | MLS000111675 | ChemBridge | 6370266 | >40 |
| J | MLS000105542 | ChemBridge | 5161874 | 12.6 |
| O | MLS000108799 | ChemBridge | 5927508 | 7.7 |
| M | MLS000049833 | ChemBridge | 7894782 | 16.5 |
| L | MLS000096979 | ChemBridge | 7685300 | >40 |
| R | MLS000062315 | ChemBridge | 6624994 | 3.6 |
| Q | MLS000062185 | ChemBridge | 6512965 | 3.4 |
| K | MLS000104229 | ChemBridge | 5215570 | 10.3 |
| C′ | MLS000047713 | ChemDiv | 2324-0448 | 12.0 |
| B′ | MLS000092741 | ChemDiv | C656-0067 | 23.3 |
| W | MLS000109390 | Deltagen | 4065-0146 | 4.3 |
| V | MLS000073581 | Deltagen | K408-0544 | 4.8 |
| X | MLS000057191 | EnAmine | T5347014 | 8.4 |
| Y | MLS000057778 | EnAmine | T0511-0376 | 13.3 |
| Z | MLS000055414 | EnAmine | T0507-2864 | 8.1 |
| U | MLS000069631 | Sigma | C1386 | 10.3 |
| T | MLS000043319 | ChemBridge | 7461374 | 0.9 |
| S | MLS000106248 | ChemBridge | 5344221 | 1.7 |
| A′ | MLS000045466 | ChemDiv | C505-0274 | 3.5 |
| D′ | MLS000041467 | ChemDiv | 6917-0116 | 4.0 |
Figure 4.
Inhibition of MMP-13 by 30 different compounds, as monitored by RP-HPLC and fluorescence spectroscopy. The change in RP-HPLC peak areas or relative fluorescence units for 10 nM MMP-13 hydrolysis of 10 μM fTHP-15 or 5 μM Knight fSSP was monitored at an inhibitor concentration of 100 μM as described in Experimental. Assays were performed in triplicate.
Twelve compounds were selected for counter-screening with a variety of MMPs (MMP-1, MMP-2, MMP-3, MMP-8, MMP-9, and MMP-12). Selection of compounds was based on the relative level of inhibition and uniqueness of the substrate profile. Compounds H, Q, X, and C′ were selective for MMP-13, while compounds C, E, M, V, and R were broad-spectrum MMP inhibitors [often with the exception of MMP-3 (C, E, M, R) or MMP-1 (M, V)] (Table 4). Other inhibitors offered differing selectivities. Compound W was most effective against MMP-2 and MMP-13, while compounds T and A′ inhibited MMP-8 and MMP-13 effectively (Table 4).
Table 4.
Relative percent activity of MMPs in the presence of 100 μM inhibitor
| Inhibitor | MMP-1 | MMP-2 | MMP-3 | MMP-8 | MMP-9 | MMP-12 | MMP-13 |
|---|---|---|---|---|---|---|---|
C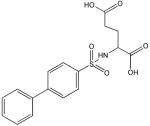
|
25 | 7 | 63 | 2 | 14 | 2 | 4 |
E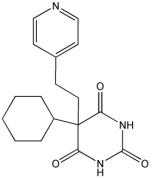
|
47 | 49 | 96 | 50 | 27 | 21 | 35 |
H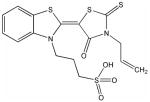
|
96 | 100 | 100 | 100 | 100 | 100 | 36 |
M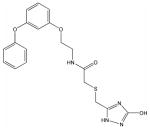
|
85 | 19 | 96 | 34 | 27 | 33 | 35 |
Q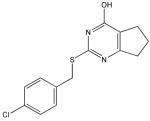
|
94 | 100 | 96 | 80 | 99 | 100 | 62 |
R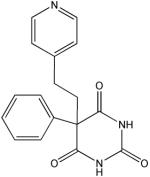
|
27 | 17 | 87 | 8 | 3 | 1 | 14 |
T
|
68 | 100 | 75 | 32 | 100 | 75 | 45 |
V
|
91 | 0 | 43 | 10 | 0 | 0 | 15 |
W
|
98 | 47 | 97 | 80 | 66 | 72 | 25 |
X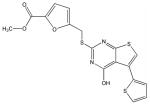
|
93 | 100 | 92 | 94 | 100 | 92 | 42 |
A′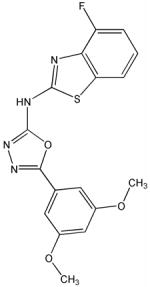
|
96 | 73 | 95 | 36 | 75 | 64 | 35 |
C′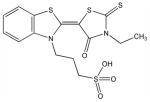
|
88 | 80 | 90 | 100 | 81 | 94 | 44 |
3. Discussion
HTS for MMPs has been previously established using FRET substrates with Mca as fluorophore and Dnp as quencher 31–35. The present HTS approach utilized a THP substrate to potentially identify unique MMP-13 inhibitors. THP substrates have distinct conformational features that interact with secondary binding sites (exosites) found within MMPs 30. Thus, use of substrates such as fTHP-15 could allow for the identification of novel MMP-13 exosite inhibitors. MMP-13 has good activity towards fTHP-15, with KM = 8.60 μM and kcat = 0.015 sec−1 48. In the present screening study, [S] = 4 μM, resulting in [S]/KM = 0.47. These near balanced conditions (ideal would be [S]/KM = 1, which was achieved in the secondary screen) allow for evaluation of all inhibition mechanisms 49.
A particular problem noted with the FRET-based assay used herein is that compounds being screened may have absorption maxima that coincide with the excitation or emission wavelength of the fluorophore. In the former case, fluorescent compounds that have similar excitation and emission maxima as the fluorophore will fluoresce during the assay, and may not be recognized as inhibitors. In the latter case, the compound will quench the substrate fluorescence and be incorrectly designated as an inhibitor. In the present study, a modification of the screening protocol allowed for the proper evaluation of autofluorescent compounds. As noted by George et al. for HTS of MMP-3, the CyDye pair of Cy3/Cy5Q was much less susceptible to false results than the Mca/Dnp pair, as <1% of a random library were auto-fluorescent at Cy3 wavelengths while >10% of the same library could not be screened using Mca/Dnp due to autofluorescence and interference 44. One could create complimentary substrates differing only by their respective fluorophore/quencher pairs, and use these different substrates to screen potential inhibitors. Compounds would need to exhibit activity in both assays to be classified as inhibitor hits, and thus those that interfered with fluorescence or quenching for one substrate would be inactive in the other assay. The fTHP-15 substrate could be easily modified to incorporate other donor/quencher pairs.
The present screening protocol initially profiled ~65,000 compounds at a 4 μM concentration for each compound. In general, hits were selected based upon a statistical cutoff, which turned out to be 13.85% inhibition. The quality of a hit was evaluated by dose-dependence. An RP-HPLC-based secondary screen was performed to eliminate compounds that inhibit non-specifically (e.g., interact with the substrate) or interfere with fluorescence of the Mca-containing peptide fragment. The secondary screen also compared inhibition towards two substrates, one triple-helical (fTHP-15) and one single-stranded (Knight fSSP). Finally, a counter-screen was performed to evaluate the selectivity of compounds within the MMP family. Ultimately, 25 compounds were confirmed as MMP-13 inhibitors. Within a 12 compound subset of this group, 5 were found to be broad-spectrum MMP inhibitors, 3 offered some selectivity for MMP-13, and 4 were selective for MMP-13. Two compounds were better inhibitors towards the single-stranded substrate versus the triple-helical one, while one compound was a better inhibitor for the triple-helical substrate.
Structural analysis of the compounds identified in this screen, as well as comparison with prior reports, allows us to identify novel compounds and speculate on unique modes of action. Compounds E and R, which were broad-spectrum inhibitors, possess 5,5-disubstitutedpyrimidine-2,4,6-triones, which represent a general class of MMP inhibitors 50,51. The 5,5-disubstituted pyrimidine-2,4,6-trione (barbituric acid) binds to the MMP active site Zn2+ 50–53. Compounds C and V are novel broad-spectrum MMP inhibitors. They most likely bind the MMP active site Zn2+ due to their carboxylic acid functionalities. These two compounds were also shown to be broad-spectrum metalloprotease inhibitors via ABPP profiling 54 (where compound C = compound 4 and compound V = compound 3). The fifth broad-spectrum inhibitor, compound M, does not appear to be analogous to known MMP inhibitors, and does not have a readily apparent Zn2+-binding group. The same is true for the selective compounds H, T, A′, and C′. Compounds H and C′ are virtually identical structurally (Table 4). Compounds T and A′ are autofluorescent.
Compound X is selective and has a central core with similarity to the thiazolopyrimidine core in a recently described MMP-13 selective, exosite inhibitor 21. Selective compounds Q and W have some similarity to the Warner-Lambert pyrimidinediones, which have been characterized as allosteric MMP-13 selective inhibitors 18. These two compounds were also shown to be discriminatory for MMP-13 via ABPP profiling 54 (where compound Q = compound 1 and compound W = compound 2). Compound Q is perhaps the most interesting one found in the present study. In addition to being selective for MMP-13, it may be mechanistically distinct from the other inhibitors identified here. It is the only inhibitor that was more effective against MMP-13 triple-helical peptidase activity compared with MMP-13 single-stranded peptidase activity (Figure 4), and thus may interact with an MMP-13 collagen-binding exosite. Compound Q inhibits MMP-13 possibly by a distinct mechanism from compounds W, V, and C 54. Further studies will evaluate the precise mode of action of compound Q.
Several exosite binding, selective MMP-13 inhibitors have been described previously. Initially, Chen et al. found that N-[4-(4-morpholinyl)butyl]-2-benzofurancarboxamide hydrochloride inhibited MMP-13 with an IC50 value of 10 μM but had no activity towards MMP-1, MMP-9, or TACE 55. HTS campaigns from Warner-Lambert led to the identification of a benzothiadiazine derivative which exhibited an IC50 value of 4.85 nM for MMP-13 and IC50 values of 104–105 nM for MMP-1, MMP-3, MMP-7, MMP-9, and MMP-14 18,20. Engel et al. found a pyrimidine dicarboxamide that was completely selective for MMP-13 compared to MMP-1, MMP-2, MMP-3, MMP-7, MMP-8, MMP-9, MMP-10, MMP-11, MMP-12, MMP-14, and MMP-16 41,42. Structure-based optimization led to pyrimidine-4,6-dicarboxylic acid, bis-(4-fluoro-3-methyl-benzylamide), which has an IC50 value of 8 nM for MMP-13 (see earlier discussions) 20,41. Johnson et al. used HTS to discover 6-benzyl-5,7-dioxo-6,7-dihydro-5H-thiazolo[3,2-c]pyrimidine-2-carboxylic acid benzyl ester, which inhibits MMP-13 with an IC50 value of 30 nM and has no activity towards MMP-1, MMP-2, MMP-3, MMP-7, MMP-8, MMP-9, MMP-12, MMP-14, and MMP-17 21. A derivative of this compound, 4-[1-methyl-2,4-dioxo-6-(3-phenyl-prop-1-ynyl)-1,4-dihydro-2H-quinazolin-3-ylmethyl]-benzoic acid, offered the same selectivity with an improved IC50 value (0.67 nM) for MMP-13 21. These latter inhibitors are selective based on their ability to confer an ordered structure to the MMP-13 S1′ specificity loop. 4-[1-Methyl-2,4-dioxo-6-(3-phenyl-prop-1-ynyl)-1,4-dihydro-2H-quinazolin-3-ylmethyl]-benzoic acid was also found to inhibit cartilage damage in vivo without the joint fibroplasia side effects often observed with broad-spectrum MMP inhibitors 21.
4. Conclusion
Several of the broad-spectrum and selective inhibitors described in the present study do not appear to be Zn2+-binding and are distinct from those described in prior studies. Additionally, most of the compounds identified in the HTS have little or no activity in numerous other biological assays (Figure 5). Exosite inhibitors could be further developed and/or covalently linked to active site inhibitors, creating high affinity and selective lead compounds. Exosites/allosteric sites have been shown to represent unique opportunities for the design of selective inhibitors 36,37,56. Particularly exciting would be the development of MMP-13 inhibitors that target collagenolytic activity while sparing other MMP-13 functions.
Figure 5.
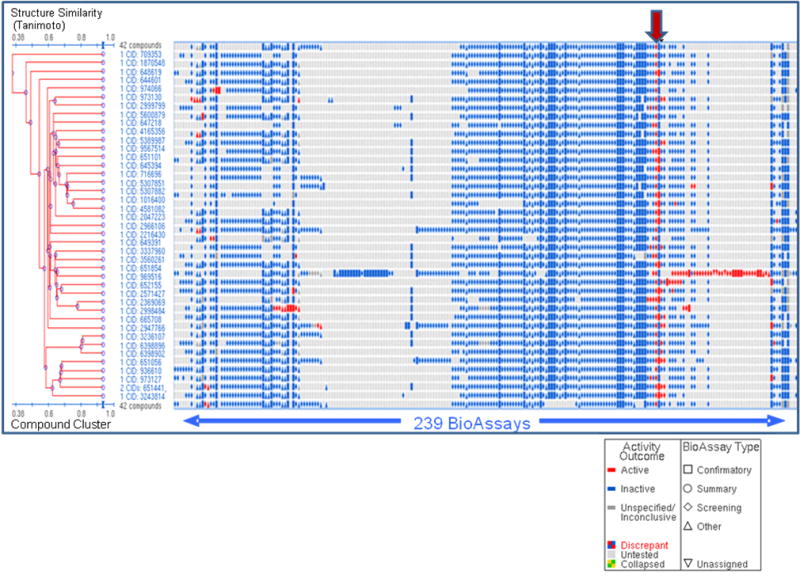
Bioactivity clustering (structure-activity analysis) of 42 compounds tested in dose response experiment for non-fluorescent compounds. Results from a cheminformatics tool contained within the PubChem website are shown. Compound cluster tree is on the Y axis (structures are clustered based on Tanimoto similarity score) plotted vs. assays deposited into the NCBI PubChem website on X axis. Assay results are deposited by different screening centers under the auspices of MLSCN NIH roadmap initiative. Red arrow indicates columns containing MMP-13 primary HTS and dose-response experiment results.
5. Experimental
5.1. Chemicals and substrates
All standard chemicals were purchased from VWR (Atlanta, GA). MMP-13 inhibitor [(pyrimidine-4,6-dicarboxylic acid, bis-(4-fluoro-3-methyl-benzylamide)] was obtained from EMD Biosciences/Calbiochem (product # 444283; San Diego, CA). Individual inhibitors were obtained from suppliers listed in Table 3. The synthesis, purification, and characterization of fTHP-15 and Knight fSSP [Mca-Lys-Pro-Leu-Gly-Leu-Lys(Dnp)-Ala-Arg-NH2] have been described 48,57,58. The melting temperature (Tm) of fTHP-15 is 58 °C.
5.2. Matrix metalloproteinases
Full-length recombinant human proMMP-13 was purchased from R&D Systems (product # 511-MM; Minneapolis, MN). The zymogen form of MMP-13 was converted to the active form by incubating proMMP-13 with 1 mM p-aminophenylmercuric acid (APMA) for 2 h at 37 °C 59. The amount of active MMP-13 was determined by titration with recombinant N-TIMP-1 48. The stock of active MMP-13 was diluted to 1 μM and stored at −80 °C. ProMMP-1 and proMMP-3 were expressed in E. coli and folded from the inclusion bodies as described previously 27,60. ProMMP-1 was activated by reacting with 1 mM APMA and 0.1 equiv of MMP-3(Δ248–460) at 37 °C for 6 h. After activation, MMP-3(Δ248–460) was completely removed from MMP-1 by size-exclusion chromatography. ProMMP-3 was activated by reacting with 5 μg/mL chymotrypsin at 37 °C for 2 h. Chymotrypsin was inactivated with 2 mM diisopropylfluorophosphate. ProMMP-2 was purified from the culture medium of human uterine cervical fibroblasts 61 and activated by incubating with 1 mM APMA for 1 h at 37 °C. ProMMP-8 was expressed in CHO-K1 cells as described previously 62. ProMMP-8 was activated by incubating with 1 mM APMA for 1 h at 37 °C. Recombinant proMMP-9 was purchased from Chemicon (Temecula, CA) and activated with 1 mM APMA for 1 h at 37 °C. Recombinant MMP-12 was expressed in active form as recently described 63. The concentrations of active MMP-1, MMP-2, MMP-3, MMP-8, MMP-9, and MMP-12 were determined by titration with recombinant N-TIMP-1 64. Active site titrations utilized either Knight fSSP or NFF-3 as substrate 57,58,65.
5.3. 1536-well plate format MMP-13 inhibition assay
All experiments were performed in 1536-well white microtiter plates (Greiner Bio-One, Monroe, NC). To begin the assay 2.5 μL of 8 μM fTHP-15 in enzyme assay buffer (EAB; 50 mM Tris• HCl, pH 7.5, 100 mM NaCl, 10 mM CaCl2, 0.05% Brij-35) was added to the wells using a FRD™ IB Workstation (Aurora Discovery, Carlsbad, CA). 20 nL of DMSO–water (3:1) containing the control compounds, test compounds, or no compounds was dispensed using a 1536-head Pintool system (GNF Systems, San Diego, CA). Final assay concentrations for inhibition control compounds were 80 nM of MMP-13 inhibitor for 50% inhibition control wells and 8 μM of MMP-13 inhibitor for 100% inhibition (positive) control wells. Test compounds were present in the assay at a final nominal concentration of 4 μM. The DMSO concentration in the assay was 0.3%. Reactions were initiated by addition of 2.5 μL of 2.66 nM MMP-13 in EAB. After 4 h of incubation at 25 °C the reaction was stopped by addition of 5 μL of 50 mM EDTA (product # E7889; Invitrogen, Carlsbad, CA). All reagents were dispensed at ambient temperature. Plates were incubated for 10 min at 25 °C and emission fluorescence was read on the Viewlux (Perkin-Elmer, Turku, Finland) microplate reader (λexcitation = 325 nm, λemission = 450 nm).
5.4. Robotic screening platform
All assays, including validation experiments, HTS campaign, and dose response experiments were executed on GNF/Kalypsys uHTS platform, using integrated liquid handlers, incubators, and a Viewlux multi-mode plate reader.
5.5. MMP-13 inhibition assay for robotic validation and primary HTS campaign
Assay protocols were identical to those described above for 1536-well assay development. Validation experiments were performed with a small subset of the NIH Molecular Library Screening Center Network (MLSCN) screening file. Assay parameters were identical between the validation and HTS campaigns. All compounds were tested once at a final concentration of 4 μM. As described in detail above, wells containing the MMP-13 inhibitor were used as a pharmacologic (positive) control, whereas wells containing DMSO were used as the negative control. The MMP-13 inhibitor IC50 was monitored throughout the entire campaign to ensure the robustness of each individual assay. Results of this screen are publicly available on the MLSCN PubChem website under Assay ID 570 (http://pubchem.ncbi.nlm.nih.gov/assay/assay.cgi?aid=570).
5.6. Dose-response assay for inhibitors of MMP-13
Assay protocols were identical to those described above for 1536-well assay development, with the following exception: each compound was assayed in triplicate, using 10 point, 1:3 serial dilutions starting at a nominal test concentration of 40 μM. Results of this experiment are publicly available on the MLSCN PubChem website under Assay ID 735 (http://pubchem.ncbi.nlm.nih.gov/assay/assay.cgi?aid=735.
5.7. MMP-13 screening assay for autofluorescent inhibitors of MMP-13
Assay protocols were identical to those of the primary HTS campaign, with the exception that each compound was assayed in triplicate. Also, two additional fluorescence measurements were taken in order to reduce the contribution of test compound intrinsic fluorescence to the measured RFU signal. Specifically, an initial fluorescence reading was conducted immediately following enzyme addition (RFUt0) and another after completion of the 4 h enzymatic reaction protocol step (RFUt4). For each test well the difference between these two measurements (defined as • RFU) was calculated prior to percent inhibition calculations. Results of this screen are publicly available on the MLSCN PubChem website under Assay ID 734 (http://pubchem.ncbi.nlm.nih.gov/assay/assay.cgi?aid=734).
5.8. Data normalization for all 1536-well format assays
From the raw fluorescence intensity values (RFU450), the percent inhibition for each well was calculated as follows:
where “test compound” is the well containing test compound, “positive control” is defined as test wells containing 8 μM MMP-13 inhibitor, and “negative control” is defined as test wells containing DMSO only. Data normalization for all assays employed an identical formula, with the exception that the autofluorescent inhibitor assays replaced the RFU450 value with a • RFU value.
5.9. Dose-response assay for autofluorescent inhibitors of MMP-13
Assay protocols were identical to those described above for the autofluorescent inhibitors assay. Each compound was assayed in triplicate, using 10 point, 1:3 serial dilutions starting at a nominal test concentration of 40 μM. Results of this experiment are publicly available on the MLSCN PubChem website under Assay ID 769 (http://pubchem.ncbi.nlm.nih.gov/assay/assay.cgi?aid=769).
5.10. MMP-13 inhibitor IC50 determination
To determine IC50 values for each compound, percentage inhibitions were plotted against compound concentration. A four parameter equation describing a sigmoidal dose-response curve was then fitted with adjustable baseline using Assay Explorer software (MDL Information Systems). The reported IC50 values were generated from fitted curves by solving for the X intercept at the 50% inhibition level of the Y intercept. In cases where the highest concentration tested (i.e., 40 μM) did not result in greater than 50% inhibition, the IC50 was determined manually as greater than 40 μM.
5.11. Quality control and hit selection criteria for the primary HTS campaign
In the case of the primary HTS campaign we could not use the standard hit selection criteria (described in detail below for other assays) due to the presence of a large number of fluorescent compounds in the MLSCN screening file. In its place we used a modified 3SD + Ave approach, using the sample field of a DMSO control plate that did not contain any compounds. Two values were calculated: (a) the average percent inhibition of all sample field wells in the control plate tested; and (b) three times their standard deviation. The sum of these two values was used as a cutoff parameter, i.e., any compound that exhibited greater % inhibition than the cutoff parameter was declared nominally active. As a corollary, the difference of these same two values was used as a fluorescent artifact cutoff parameter, i.e., any well that exhibited an inhibition value less than the negative cutoff parameter was declared to be a fluorescent artifact, and therefore subject to further analysis in downstream assays.
5.12. Quality control and hit selection criteria for autofluorescent inhibitor and dose-response HTS assays
For all autofluorescent inhibitor and dose-response assay results, standard hit selection criteria were used (see below). Three parameters were calculated on a per-plate basis: (a) the signal-to-background ratio (S/B); (b) the coefficient for variation [CV; CV = (standard deviation/mean) × 100)] for all compound test wells; and (c) the Z- or Z′-factor 66. Z takes into account the effect of test compounds on the assay window, while Z′ is based on controls.
A mathematical algorithm was used to determine nominally inhibitory compounds (“hits”). Two values were calculated: (a) the average percent inhibition of all compounds tested; and (b) three times their standard deviation. The sum of these two values was used as a cutoff parameter, i.e., any compound that exhibited greater % inhibition than the cutoff parameter was declared nominally active 47.
5.13. Frequency distribution analysis
Statistical analyses were performed using GraphPad Prism (version 4.03). Inhibition values were binned in 1% wide bins and plotted as number of compounds per bin vs. inhibition (expressed as %). Concordance of inhibition distribution to a normal (bell-shaped) distribution was assessed using non-linear regression analysis for Gaussian distribution.
5.14. Cheminformatics
Results of each experiment were deposited into the NIH’s NCBI PubChem database (http://pubchem.ncbi.nlm.nih.gov/), a publicly accessible repository for results of HTS experiments performed under the auspices of the NIH’s MLSCN. In this database, assays were identified uniquely by Assay ID (AID). Clustering of the deposited data was performed using the tools contained within the NCBI PubChem website.
5.15. Secondary screen
Inhibitors were prepared as 10 mM solutions in DMSO and then further diluted with EAB. MMP-13 assays were conducted in EAB by pretreating 1–10 nM enzyme with 100 μM inhibitor for 1 h at 37 °C, then incubating 10 μM fTHP-15 or 5 μM Knight fSSP for 1.5–4 h. Fluorescence readings (λ excitation = 324 nm and λemission = 393 nm) were obtained over time on a Molecular Devices SPECTRAmax Gemini EM Dual-Scanning Microplate Spectrofluorimeter, and the reaction was quenched by addition of 25 mM EDTA. Rates of hydrolysis (ΔRFU) were obtained from plots of fluorescence versus time, using data points from only the linear portion of the hydrolysis curve. After the final reading, the reaction solution was analyzed by RP-HPLC. Analytical RP-HPLC was performed on a Hewlett Packard 1100 Liquid Chromatograph equipped with a Vydac 218TP5415 protein and peptide C18 column (15–10 μm particle size, 300 Å pore size, 150 × 4.1 mm). Eluants were 0.1% TFA in water (A) and 0.1% TFA in acetonitrile (B). The elution gradient was 0–40% B in 20 min with a flow of 1 ml/min. Detection was at λ = 220, 324, and 363 nm. Reaction yields in the presence of inhibitors were evaluated by the integration of the λ = 324, and 363 nm RP-HPLC peaks formed and compared to the enzyme reaction without inhibitor present. Hydrolyzed substrate was examined before and after inhibitor addition to evaluate fluorescence interference. Substrate hydrolysis product identification was achieved by MALDI-TOF-MS on an ABD DE-STR Voyager mass spectrometer using α-cyano-4-hydroxycinnamic acid matrix.
Acknowledgments
We gratefully acknowledge Dr. Hideaki Nagase for supplying the MMP-1 plasmid and MMP-2 and MMP-3, Dr. Christopher Overall for supplying the MMP-8 plasmid, and Dr. Steven Van Doren for supplying MMP-12. This work was supported by the National Institutes of Health (MH 078948 and CA 98799 to G.B.F.). The National Institutes of Health Molecular Library Screening Center Network (5U54MH074404, H. Rosen, Principal Investigator) supported in part the research efforts of P.C., P.B., P.H., D.M., and S.A.S.
Footnotes
Publisher's Disclaimer: This is a PDF file of an unedited manuscript that has been accepted for publication. As a service to our customers we are providing this early version of the manuscript. The manuscript will undergo copyediting, typesetting, and review of the resulting proof before it is published in its final citable form. Please note that during the production process errors may be discovered which could affect the content, and all legal disclaimers that apply to the journal pertain.
References
- 1.Baronas-Lowell D, Lauer-Fields JL, Fields GB. J Liq Chromatogr Rel Technol. 2003;26:2225–2254. [Google Scholar]
- 2.Liotta LA. Scientific American. 1992;266(2):54–63. doi: 10.1038/scientificamerican0292-54. [DOI] [PubMed] [Google Scholar]
- 3.Birkedal-Hansen H, Moore WGI, Bodden MK, Windsor LJ, Birkedal-Hansen B, DeCarlo A, Engler JA. Crit Rev Oral Biol Med. 1993;4:197–250. doi: 10.1177/10454411930040020401. [DOI] [PubMed] [Google Scholar]
- 4.Nagase H. In: Zinc Metalloproteases In Health and Disease. Hooper NM, editor. Taylor & Francis; London: 1996. pp. 153–204. [Google Scholar]
- 5.Chambers AF, Matrisian LM. J Nat CancerInst. 1997;89:1260–1270. doi: 10.1093/jnci/89.17.1260. [DOI] [PubMed] [Google Scholar]
- 6.Kleiner DE, Stetler-Stevenson WG. Cancer Chemother Pharmacol. 1999;43(Suppl):S42–S51. doi: 10.1007/s002800051097. [DOI] [PubMed] [Google Scholar]
- 7.Nelson AR, Fingleton B, Rothenberg ML, Matrisian LMJ. Clin Oncol. 2000;18:1135–1149. doi: 10.1200/JCO.2000.18.5.1135. [DOI] [PubMed] [Google Scholar]
- 8.Felson DT. Seminars Arthritis Rheum. 1990;20:42–50. doi: 10.1016/0049-0172(90)90046-i. [DOI] [PubMed] [Google Scholar]
- 9.Nagase H, Kashiwagi M. Arthritis Res Ther. 2003;5:94–103. doi: 10.1186/ar630. [DOI] [PMC free article] [PubMed] [Google Scholar]
- 10.Knudson CB, Knudson W. Seminars Cell Dev Biol. 2001;12:69–78. doi: 10.1006/scdb.2000.0243. [DOI] [PubMed] [Google Scholar]
- 11.Wang J, Verdonk P, Elewaut D, Yveys EM, Verbruggen G. Osteoarthritis Cartilage. 2003;11:801–809. doi: 10.1016/s1063-4584(03)00168-7. [DOI] [PubMed] [Google Scholar]
- 12.Billinghurst RC, Dahlberg L, Ionescu M, Reiner A, Bourne R, Rorabeck C, Mitchell P, Hambor J, Diekmann O, Tschesche H, Chen J, Van Wart H, Poole R. J Clin Invest. 1997;99:1534–1545. doi: 10.1172/JCI119316. [DOI] [PMC free article] [PubMed] [Google Scholar]
- 13.Tortorella MD, Burn TC, Pratta MA, Abbaszade I, Hollis JM, Liu R, Rosenfeld SA, Copeland RA, Decicco CP, Wynn R, Rockwell A, Yang F, Duke JL, Solomon K, George H, Bruckner R, Nagase H, Itoh Y, Ellis DM, Ross H, Wiswall BH, Murphy K, Hillman MC, Jr, Hollis GF, Newton RC, Magolda RL, Trzaskos JM, Arner EC. Science. 1999;284:1664–1666. doi: 10.1126/science.284.5420.1664. [DOI] [PubMed] [Google Scholar]
- 14.Abbaszade I, Liu R-Q, Yang F, Rosenfeld SA, Ross OH, Link JR, Ellis DM, Tortorella MD, Pratta MA, Hollis JM, Wynn R, Duke JL, George HL, Hillman MC, Jr, Murphy K, Wiswall BH, Copeland RA, Decicco CP, Bruckner R, Nagase H, Itoh Y, Newton RC, Magolda RL, Trzaskos JM, Hollis GF, Arner EC, Burn TC. J Biol Chem. 1999;274:23443–23450. doi: 10.1074/jbc.274.33.23443. [DOI] [PubMed] [Google Scholar]
- 15.Vincenti MP, Brinckerhoff CE. Arthritis Res. 2002;4:157–164. doi: 10.1186/ar401. [DOI] [PMC free article] [PubMed] [Google Scholar]
- 16.Wu W, Billinghurst RC, Pidoux I, Antoniou J, Zukor D, Tanzer M, Poole AR. Arthritis Rheum. 2002;46:2087–2094. doi: 10.1002/art.10428. [DOI] [PubMed] [Google Scholar]
- 17.Stickens D, Behonick DJ, Ortega N, Heyer B, Hartenstein B, Yu Y, Fosang AJ, Schorpp-Kistner M, Angel P, Werb Z. Development. 2004;131:5883–5895. doi: 10.1242/dev.01461. [DOI] [PMC free article] [PubMed] [Google Scholar]
- 18.Breuer E, Frant J, Reich R. Expert Opin Ther Patents. 2005;15:253–269. [Google Scholar]
- 19.Anonymous. Expert Opin Ther Patents. 2005;15:237–241. [Google Scholar]
- 20.Priard B. Drug Discovery Today. 2007;12:640–646. doi: 10.1016/j.drudis.2007.06.003. [DOI] [PubMed] [Google Scholar]
- 21.Johnson AR, Pavlovsky AG, Ortwine DF, Prior F, Man CF, Bornemeier DA, Banotai CA, Mueller WT, McConnell P, Yan C, Baragi V, Lesch C, Roark WH, Wilson M, Datta K, Guzman R, Han HK, Dyer RD. J Biol Chem. 2007;282:27781–27791. doi: 10.1074/jbc.M703286200. [DOI] [PubMed] [Google Scholar]
- 22.Lauer-Fields JL, Broder T, Sritharan T, Nagase H, Fields GB. Biochemistry. 2001;40:5795–5803. doi: 10.1021/bi0101190. [DOI] [PubMed] [Google Scholar]
- 23.Lauer-Fields JL, Fields GB. Biol Chem. 2002;383:1095–1105. doi: 10.1515/BC.2002.118. [DOI] [PubMed] [Google Scholar]
- 24.Lauer-Fields JL, Juska D, Fields GB. Biopolymers (Peptide Sci) 2002;66:19–32. doi: 10.1002/bip.10201. [DOI] [PubMed] [Google Scholar]
- 25.Lauer-Fields JL, Sritharan T, Stack MS, Nagase H, Fields GB. J Biol Chem. 2003;278:18140–18145. doi: 10.1074/jbc.M211330200. [DOI] [PubMed] [Google Scholar]
- 26.Lauer-Fields JL, Kele P, Sui G, Nagase H, Leblanc RM, Fields GB. Anal Biochem. 2003;321:105–115. doi: 10.1016/s0003-2697(03)00460-3. [DOI] [PubMed] [Google Scholar]
- 27.Lauer-Fields JL, Nagase H, Fields GBJ. Biomolecular Techniques. 2004;15:305–316. [PMC free article] [PubMed] [Google Scholar]
- 28.Baronas-Lowell D, Lauer-Fields JL, Borgia JA, Sferrazza GF, Al-Ghoul M, Minond D, Fields GB. J Biol Chem. 2004;279:43503–43513. doi: 10.1074/jbc.M405979200. [DOI] [PubMed] [Google Scholar]
- 29.Minond D, Lauer-Fields JL, Nagase H, Fields GB. Biochemistry. 2004;43:11474–11481. doi: 10.1021/bi048938i. [DOI] [PubMed] [Google Scholar]
- 30.Lauer-Fields JL, Minond D, Baronas-Lowell D, Chalmers MJ, Busby SA, Griffin PR, Nagase H, Fields GB. In: Understanding Biology Using Peptides. Blondelle SE, editor. American Peptide Society; San Diego: 2006. pp. 315–319. [Google Scholar]
- 31.Schullek JR, Butler JH, Zhi-Jie N, Chen D, Yuan Z. Anal Biochem. 1997;246:20–29. doi: 10.1006/abio.1996.9958. [DOI] [PubMed] [Google Scholar]
- 32.Szardenings AK, Antonenko V, Campbell DA, DeFrancisco N, Ida S, Shi L, Sharkov N, Tien D, Wang Y, Navre M. J Med Chem. 1999;42:1348–1357. doi: 10.1021/jm980475p. [DOI] [PubMed] [Google Scholar]
- 33.Vassiliou S, Mucha A, Cuniasse P, Georgiadis D, Lucet-Levannier K, Beau F, Kannan R, Murphy G, Knauper V, Rio MC, Basset P, Yiotakis A, Dive V. J Med Chem. 1999;42:2610–2620. doi: 10.1021/jm9900164. [DOI] [PubMed] [Google Scholar]
- 34.Buchardt J, Schiodt CB, Krog-Jensen C, Delaissé JM, Foged NT, Meldal M. J Comb Chem. 2000;2:624–638. doi: 10.1021/cc000031q. [DOI] [PubMed] [Google Scholar]
- 35.Schiodt CB, Buchardt J, Terp GE, Christensen U, Brink M, Larsen YB, Meldal M, Foged NT. Current Med Chem. 2001;8:967–976. doi: 10.2174/0929867013372670. [DOI] [PubMed] [Google Scholar]
- 36.Dennis MS, Eigenbrot C, Skelton NJ, Ultsch MH, Santell L, Dwyer MA, O’Connell MP, Lazarus RA. Nature. 2000;404:465–470. doi: 10.1038/35006574. [DOI] [PubMed] [Google Scholar]
- 37.Roberge M, Santell L, Dennis MS, Eigenbrot C, Dwyer MA, Lazarus RA. Biochemistry. 2001;40:9522–9531. doi: 10.1021/bi010592d. [DOI] [PubMed] [Google Scholar]
- 38.Overall CM, Lopez-Otin C. Nat Rev Cancer. 2002;2:657–672. doi: 10.1038/nrc884. [DOI] [PubMed] [Google Scholar]
- 39.Saghatelian A, Jessani N, Joseph A, Humphrey M, Cravatt BF. Proc Natl Acad Sci USA. 2004;101:10000–10005. doi: 10.1073/pnas.0402784101. [DOI] [PMC free article] [PubMed] [Google Scholar]
- 40.Rao BG. Curr Pharm Design. 2005;11:295–322. doi: 10.2174/1381612053382115. [DOI] [PubMed] [Google Scholar]
- 41.Engel CK, Pirard B, Schimanski S, Kirsch R, Habermann J, Klingler O, Schlotte V, Weithmann KU, Wendt KU. Chem Biol. 2005;12:181–189. doi: 10.1016/j.chembiol.2004.11.014. [DOI] [PubMed] [Google Scholar]
- 42.Gooljarsingh LT, Lakdawala A, Coppo F, Luo L, Fields GB, Tummino PJ, Gontarek R. Protein Sci. 2008;17:66–71. doi: 10.1110/ps.073130208. [DOI] [PMC free article] [PubMed] [Google Scholar]
- 43.Hemmilä IA. Applications of Fluorescence in Immunoassays. 1. Wiley-Interscience; New York, NY: 1991. p. 117. [Google Scholar]
- 44.George J, Teear ML, Norey CG, Burns DD. J Biomol Screen. 2003;8:72–80. doi: 10.1177/1087057102239778. [DOI] [PubMed] [Google Scholar]
- 45.Turek-Etienne TC, Small EC, Soh SC, Xin TA, Gaitonde PV, Barrabee EB, Hart RF, Bryant RW. J BiomolScreen. 2003;8:176–84. doi: 10.1177/1087057103252304. [DOI] [PubMed] [Google Scholar]
- 46.Lauer-Fields JL, Spicer TP, Chase PS, Cudic M, Burstein GD, Nagase H, Hodder P, Fields GB. Anal Biochem. 2008;373:43–51. doi: 10.1016/j.ab.2007.09.014. [DOI] [PMC free article] [PubMed] [Google Scholar]
- 47.Hodder PS, Cassaday J, Peltier R, Berry K, Inglese J, Feuston B, Culberson C, Bleicher L, Cosford NDP, Bayly C, Suto C, Varney M, Strulovici B. Anal Biochem. 2003;313:246–254. doi: 10.1016/s0003-2697(02)00608-5. [DOI] [PubMed] [Google Scholar]
- 48.Minond D, Lauer-Fields JL, Cudic M, Overall CM, Pei D, Brew K, Visse R, Nagase H, Fields GB. J Biol Chem. 2006;281:38302–38313. doi: 10.1074/jbc.M606004200. [DOI] [PubMed] [Google Scholar]
- 49.Copeland RA. In: Evaluation of Enzyme Inhibitors in Drug Discovery. Copeland RA, editor. John Wiley & Sons, Inc; Hoboken, NJ: 2005. pp. 82–110. [Google Scholar]
- 50.Foley LH, Palermo R, Dunten P, Wang P. Bioorg Med Chem Lett. 2001;11:969–972. doi: 10.1016/s0960-894x(01)00104-4. [DOI] [PubMed] [Google Scholar]
- 51.Reiter LA, Freeman-Cook KD, Jones CS, Martinelli GJ, Antipas AS, Berliner MA, Datta K, Downs JT, Eskra JD, Forman MD, Greer EM, Guzman R, Hardink JR, Janat F, Keene NF, Laird ER, Liras JL, Lopresti-Morrow LL, Mitchell PG, Pandit J, Robertson D, Sperger D, Vaughn-Bower ML, Waller DM, Yocum SA. Bioorg Med Chem Lett. 2006;16:5822–5826. doi: 10.1016/j.bmcl.2006.08.066. [DOI] [PubMed] [Google Scholar]
- 52.Grams F, Brandstetter H, D’Alò S, Geppert D, Krell HW, Leinert H, Livi V, Menta E, Oliva A, Zimmermann G. Biol Chem. 2001;382:1277–1285. doi: 10.1515/BC.2001.159. [DOI] [PubMed] [Google Scholar]
- 53.Brandstetter H, Grams F, Glitz D, Lang A, Huber R, Bode W, Krell HW, Engh RA. J Biol Chem. 2001;276:17405–17412. doi: 10.1074/jbc.M007475200. [DOI] [PubMed] [Google Scholar]
- 54.Nakai R, Salisbury CM, Rosen H, Cravatt BF. Bioorg Med Chem. 2008 doi: 10.1016/j.bmc.2008.03.018. submitted. [DOI] [PMC free article] [PubMed] [Google Scholar]
- 55.Chen JM, Nelson FC, Levin JI, Mobilio D, Moy FJ, Nilakantan R, Zask A, Powers R. J Am Chem Soc. 2000;122:9648–9654. [Google Scholar]
- 56.Scheer JM, Romanowski MJ, Wells JA. Proc Natl Acad Sci USA. 2006;103:7595–7600. doi: 10.1073/pnas.0602571103. [DOI] [PMC free article] [PubMed] [Google Scholar]
- 57.Nagase H, Fields CG, Fields GB. J Biol Chem. 1994;269:20952–20957. [PubMed] [Google Scholar]
- 58.Neumann U, Kubota H, Frei K, Ganu V, Leppert D. Anal Biochem. 2004;328:166–173. doi: 10.1016/j.ab.2003.12.035. [DOI] [PubMed] [Google Scholar]
- 59.Knäuper V, López-Otin C, Smith B, Knight G, Murphy G. J Biol Chem. 1996;271:1544–1550. doi: 10.1074/jbc.271.3.1544. [DOI] [PubMed] [Google Scholar]
- 60.Chung L, Shimokawa K, Dinakarpandian D, Grams F, Fields GB, Nagase H. J Biol Chem. 2000;275:29610–29617. doi: 10.1074/jbc.M004039200. [DOI] [PubMed] [Google Scholar]
- 61.Itoh Y, Binner S, Nagase H. Biochem J. 1995;308:645–651. doi: 10.1042/bj3080645. [DOI] [PMC free article] [PubMed] [Google Scholar]
- 62.Pelman GR, Morrison CJ, Overall CM. J Biol Chem. 2005;280:2370–2377. doi: 10.1074/jbc.M409603200. [DOI] [PubMed] [Google Scholar]
- 63.Bhaskaran R, Palmier MO, Bagegni NA, Liang X, Van Doren SR. J Mol Biol. 2007;374:1333–1344. doi: 10.1016/j.jmb.2007.10.028. [DOI] [PMC free article] [PubMed] [Google Scholar]
- 64.Huang W, Suzuki K, Nagase H, Arumugam S, Van Doren S, Brew K. FEBS Lett. 1996;384:155–161. doi: 10.1016/0014-5793(96)00304-3. [DOI] [PubMed] [Google Scholar]
- 65.Knight CG, Willenbrock F, Murphy G. FEBS Lett. 1992;296:263–266. doi: 10.1016/0014-5793(92)80300-6. [DOI] [PubMed] [Google Scholar]
- 66.Zhang JH, Chung TD, Oldenburg KR. J Biomol Screen. 1999;4:67–73. doi: 10.1177/108705719900400206. [DOI] [PubMed] [Google Scholar]


