

Abstract
Vulnerability of motoneurons in amyotrophic lateral sclerosis (ALS) arises from a combination of several mechanisms, including protein misfolding and aggregation, mitochondrial dysfunction and oxidative damage. Protein aggregates are found in motoneurons in models for ALS linked to a mutation in the gene coding for Cu,Zn superoxide dismutase (SOD1) and in ALS patients as well. Aggregation of mutant SOD1 in the cytoplasm and/or into mitochondria has been repeatedly proposed as a main culprit for the degeneration of motoneurons. It is, however, still debated whether SOD1 aggregates represent a cause, a correlate or a consequence of processes leading to cell death. We have exploited the ability of glutaredoxins (Grxs) to reduce mixed disulfides to protein thiols either in the cytoplasm and in the IMS (Grx1) or in the mitochondrial matrix (Grx2) as a tool for restoring a correct redox environment and preventing the aggregation of mutant SOD1. Here we show that the overexpression of Grx1 increases the solubility of mutant SOD1 in the cytosol but does not inhibit mitochondrial damage and apoptosis induced by mutant SOD1 in neuronal cells (SH-SY5Y) or in immortalized motoneurons (NSC-34). Conversely, the overexpression of Grx2 increases the solubility of mutant SOD1 in mitochondria, interferes with mitochondrial fragmentation by modifying the expression pattern of proteins involved in mitochondrial dynamics, preserves mitochondrial function and strongly protects neuronal cells from apoptosis. The toxicity of mutant SOD1, therefore, mostly arises from mitochondrial dysfunction and rescue of mitochondrial damage may represent a promising therapeutic strategy.
INTRODUCTION
Vulnerability of motoneurons in amyotrophic lateral sclerosis (ALS) likely results from a combination of several mechanisms, including protein misfolding and aggregation, mitochondrial dysfunction, oxidative damage, defective axonal transport, excitotoxicity, insufficient growth factor signaling and inflammation (1). It is widely accepted that the pathological phenotype of familial ALS (fALS) associated with mutations in the gene coding for Cu,Zn superoxide dismutase (SOD1) is due to the acquisition of new noxious functions. Protein aggregates are found in motoneurons in models for SOD1-linked fALS and in other ALS patients as well, and the aggregation of mutant SOD1 (mutSOD1) in the cytoplasm and/or into mitochondria has been repeatedly proposed as a main culprit for the degeneration of motoneurons. It is, however, still debated whether SOD1 aggregates represent a cause, a correlate or a consequence of processes leading to cell death and whether the localization of such aggregates is relevant for the toxic function.
Aggregation of mutSOD1s is reportedly mediated by metal deficiency, unfolding and formation of incorrect disulfide bridges via oxidative alteration of reactive cysteine residues (2). We have proposed that the tendency to accumulate and aggregate into mitochondria is a feature common to all mutSOD1s and that it may depend on the oxidation status of exposed cysteine residues, secondary to the relatively pro-oxidant motoneuronal mitochondrial environment and to partial unfolding of mutSOD1s (3,4). Mutant SOD1s accumulated in the mitochondrial fraction of motoneurons cause a shift in the redox state of these organelles (even in the absence of a significant oxidative stress in the cytosol) in terms of a shift in the ratio between reduced and oxidized glutathione (GSH/GSSG) and this results in impairment of respiratory complexes and ATP production (3).
Although there are several redox couples, which collectively establish the cellular redox state, the most abundant is the GSH/GSSG pair. GSH is oxidized to GSSG by reactive oxygen species (ROS) and by glutathione peroxidases, whereas glutathione reductase continually recycles GSSG back to GSH keeping the GSH/GSSG ratio high. However, this ratio is decreased during oxidative stress (5), and this constitutes one of the mechanisms by which ROS alter the overall cellular redox state, through the oxidation of free and protein-bound accessible thiols. Thus, oxidation of the mitochondrial GSH pool may contribute to the inactivation of mitochondrial complexes and to the increased ROS production accompanying several neurodegenerative conditions, including ALS.
Glutaredoxins (Grxs) are thiol–disulfide oxidoreductases involved in the catalysis of thiol–disulfide interchange reactions. Grxs specifically reduce protein–glutathione mixed disulfides to protein thiols in the presence of GSH (6). Mammalian cells contain two main dithiol Grxs that differ in size, sub-cellular localization and catalytic properties. Grx1 and Grx2 mRNAs are ubiquitously synthesized, with vast differences in abundance depending on the tissue. In the brain, Grx1 shows a variable, region-specific expression pattern and a predominant neuronal localization (7,8). Grx1 and Grx2 differ for their ability to respond to oxidative stress, most likely reflecting adaptations to their different sub-cellular localizations. Grx1 is mostly cytosolic, with a small fraction localized in the IMS, whereas Grx2 is largely localized into the mitochondrial matrix, although a Grx2 splicing variant isoform is partially targeted to the nucleus (9–12). The two enzymes also have different regulatory functions in vivo (13). Grx2 is pivotal to the reversible interactions of protein thiols with the mitochondrial glutathione pool (14); it has been demonstrated that Grx2 catalyzes glutathionylation and deglutathionylation of complex I in mitochondrial membranes and glutathionylation correlates with the loss of complex I activity (15). Grx2 also exerts a protective role against apoptotic and/or oxidant stimuli (16,17). A role in the modulation of the apoptotic process in non-neuronal (18,19) as well as in neuronal cells after neurotoxic insults (20) has been proposed also for Grx1.
A functional relationship between Grx1 and SOD1 has been already suggested by Carroll et al. (21), which demonstrated a role of the major yeast Grx in SOD1 activation and stabilization. More recently, we have reported the ability of Grx1 to increase mutSOD1 solubility in a neuronal experimental model (22). However, the putative protective role of Grx1 against mutSOD1 toxicity has not been addressed.
In the present work, we explored the hypothesis that Grxs may preserve neuronal cells from mutSOD1 toxicity by interfering with its oligomerization in different cellular compartments and/or by protecting proteins involved in mitochondrial metabolism. We have analyzed the effects of genetically manipulated levels of Grx1 or Grx2 in a neuronal environment where mutSOD1 is expressed. Collectively, our data indicate that the ability of Grx2 to maintain a correct thiol redox state into mitochondria is sufficient to prevent the aggregation of mutSOD1 and rescue normal mitochondrial function and cell viability, whereas the overexpression of Grx1 increases the solubility of mutSOD1 in the cytosol but does not ameliorate the mitochondrial phenotype and does not inhibit apoptosis induced by mutSOD1.
RESULTS
Grx1 prevents the formation of cytosolic aggregates by mutSOD1, while failing in protecting from mutSOD1 toxicity
To investigate the putative protective role of Grx1 against mutSOD1 toxicity, we have generated both murine motoneuronal NSC-34 and human neuroblastoma SH-SY5Y cell lines overexpressing Grx1. The two sets of monoclonal cell lines stably expressing Grx1 were screened by measuring enzymatic activity and levels of protein expression; out of about 10 clones isolated independently for each cell line, three clones were chosen for the highest expression of Grx1. All the clones gave consistent results and data from a single clone are shown (Fig. 1A). The same number of cells was infected for each line with an adenoviral vector leading the transient expression of either wild-type human SOD1 or the fALS-associated mutSOD1 G93A for 72 h. In this system, the efficiency of infection is consistently very high (more than 90% in SH-SY5Y) and this was checked in preliminary experiments (Supplementary Material, Fig. S1). As shown in Figure 1B, the overexpression of Grx1 prevents the formation of insolubile forms of mutSOD1 in the cytosol of both NSC-34- and SH-SY5Y-derived cells, whereas it does not affect the solubility of mitochondria-associated mutSOD1 (Fig. 1C). However, increased mutSOD1 solubility in the cytosol is not sufficient to inhibit cell death induced by this protein. Expression of mutSOD1 increases the number of active-caspase-3-positive SH-SY5Y cells (Fig. 2A), caspase-3 enzymatic activity and the following poly(ADP-ribose) polymerase (PARP) cleavage/activation (Fig. 2B). The induction of the apoptotic pathway triggered by mutSOD1 is accompanied by a general cell derangement as measured by MTS assay in the same cell lines (Fig. 2C). All of these stress markers, and the alteration of overall mitochondria morphology induced by mutSOD1 (see Supplementary Material, Fig. S2), are not decreased when Grx1 is constitutively expressed (Fig. 2A–C). Thus, interfering with the tendency of mutSOD1 to form insoluble aggregates in the cytosol is not sufficient to revert the mitochondria-mediated death phenotype induced by its expression in these cellular models.
Figure 1.
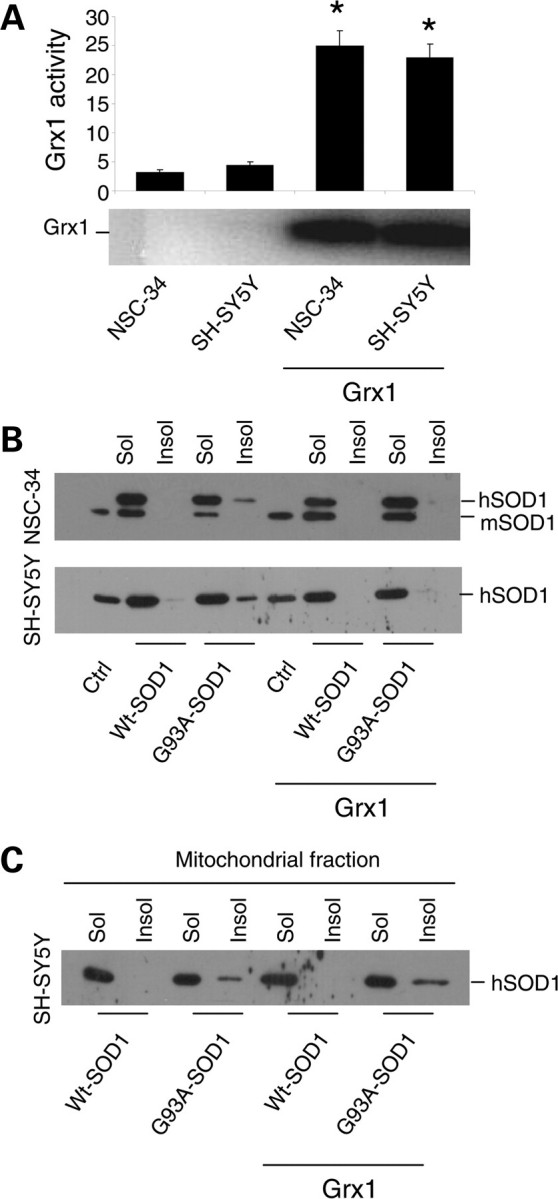
Effect of Grx1 on SOD1 solubility in neuronal cells. (A) Evaluation of enzymatic activity of Grx1 expressed in μmol/NADH/min/mg protein in total extracts from both NSC-34 and SH-SY5Y cells either untransfected or overexpressing Grx1 (upper panel) and the western blot analysis of Grx1 expression levels in the same cell lines (lower panel). Results represent mean ± SD from three independent experiments. Values significantly different from relative controls are indicated with an asterisk when P < 0.01. (B) NSC-34 and SH-SY5Y cells, either untransfected or overexpressing Grx1, were infected with an adenoviral vector leading the transient expression of wild-type SOD1 or G93A-SOD1. The soluble and insoluble protein fractions were collected from cellular lysates and equal amounts of proteins were subjected to a denaturing PAGE as described in Materials and Methods, followed by western blot analysis with an anti-SOD1 antibody. Endogenous mouse SOD1 (mSOD1) serves as an internal loading control. (C) SH-SY5Y cells, either untransfected or overexpressing Grx1, were infected with an adenoviral vector leading the transient expression of wild-type SOD1 or G93A-SOD1. Cells were sub-fractionated on gradients; the soluble and insoluble protein fractions were collected from mitochondrial fractions and subjected to a denaturing PAGE as described in Materials and Methods, followed by western blot analysis with an anti-SOD1 antibody. The blot shown is representative of three independent experiments.
Figure 2.
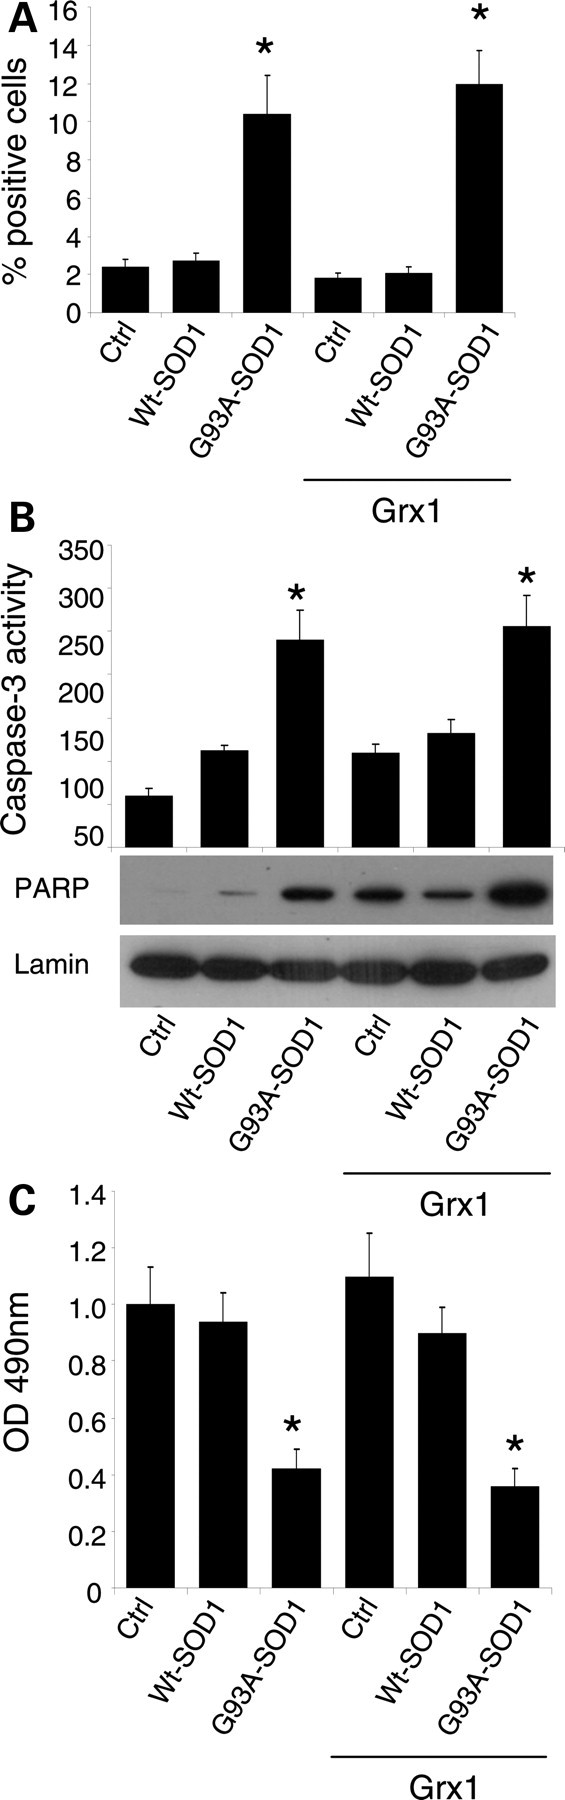
Effect of Grx1 on neuronal cells viability. SH-SY5Y cells, either untransfected or overexpressing Grx1, were infected with an adenoviral vector leading the transient expression of wild-type SOD1 or G93A-SOD1. Cells were labeled with an antibody recognizing the active fragment of caspase-3 and the percentage of positive cells was determined and reported as the mean ± SD of three independent experiments. In all, 100 cells were analyzed in each examined field and three randomly chosen fields for each experimental condition were counted. Values significantly different from relative controls are indicated with an asterisk when P < 0.01. (B) Caspase-3 activity as determined by a fluorescence enzymatic assay and reported in arbitrary fluorescence units (mean ± SD of three independent experiments). Values significantly different from relative controls are indicated with an asterisk when P < 0.01 (n = 3). The same cell lines were analyzed in western blot for cleaved (active) PARP expression; lamin B served as the internal loading control. (C) Cell viability was assessed by an MTS assay. Absorbances at 490 nm are expressed as percent of the relative untreated control cells and reported as the mean ± SD of three independent experiments. Values significantly different from relative controls are indicated with an asterisk when P < 0.01.
Grx2 diminishes the propensity of mutSOD1 to form insoluble aggregates in mitochondria
As mentioned above, we have demonstrated previously that many different fALS mutSOD1s are associated with mitochondria of motoneuronal cells to a greater extent than wild-type SOD1 and that this effect may depend on the oxidation of Cys residues. To investigate whether Grx2 modifies mitochondrial SOD1 solubility, both murine motoneuronal NSC-34 and human neuroblastoma SH-SY5Y cells were stably tranfected with a plasmid coding for the overexpression of mitochondrial Grx2. The two sets of monoclonal lines were screened by measuring Grx2 enzymatic activity (Fig. 3A) and two lines (selected as mentioned above for Grx1) were infected with an adenoviral vector leading the transient expression of either wild-type human SOD1 or the mutSOD1 G93A for 72 h (Fig. 3B). In these conditions, whereas total (cytosolic) mutSOD1 aggregates are not affected by the presence of Grx2 (Fig. 3C), the overexpression of Grx2 correlates with the disappearance of mutSOD1 from the mitochondrial insoluble fraction in both cell lines (Fig. 3D). This is paralleled by a lower tendency of IMS-targeted SOD1 to form disulfide-linked oligomers in the presence of Grx2 (Supplementary Material, Fig. S3), a tendency not observed for IMS-targeted SOD1 in the presence of Grx1 (Supplementary Material, Fig. S4).
Figure 3.

Effect of Grx2 on SOD1 solubility in neuronal cells. (A) Evaluation of enzymatic activity of Grx2 in NSC-34 and SH-SY5Y cells, either untransfected or overexpressing Grx2. Activity was determined on the mitochondrial fraction and is expressed in μmol/NADH/min/mg protein and reported as the mean ± SD of three independent experiments. Values significantly different from relative controls are indicated with an asterisk when P < 0.01. (B) NSC-34 and SH-SY5Y cells, either untransfected or overexpressing Grx2, were infected with an adenoviral vector leading the transient expression of wild-type SOD1 or G93A-SOD1. Total SOD1 was determined by the western blot analysis. β-Actin served as the loading control in extracts from SH-SY5Y-derived cells, whereas endogenous mouse SOD1 (mSOD1) served as the control in extracts from NSC-34-derived cells. The blots shown are representative of three independent experiments. (C) SH-SY5Y cells, either untransfected or overexpressing Grx2, were infected with an adenoviral vector leading the transient expression of wild-type SOD1 or G93A-SOD1. The soluble and insoluble protein fractions were collected from cellular lysates and subjected to a denaturing PAGE as described in Materials and Methods, followed by the western blot analysis with an anti-SOD1 antibody. The blot shown is representative of three independent experiments. (D) SH-SY5Y cells (left) and NSC-34 cells (right), either untransfected or overexpressing Grx2, were infected with an adenoviral vector leading the transient expression of wild-type SOD1 or G93A-SOD1. Cells were sub-fractionated on gradients; the soluble and insoluble protein fractions were collected from mitochondrial fractions and subjected to a denaturing PAGE as described in Materials and Methods, followed by the western blot analysis with an anti-SOD1 antibody. The blots shown are representative of five independent experiments.
Grx2 overexpression prevents mitochondrial fragmentation induced by mutSOD1
Expression of mutSOD1 in neuronal cell lines induces alterations in mitochondrial morphology. Immunofluorescence analysis of mitochondrial morphology of both NSC-34 and SH-SY5Y expressing mutSOD1 shows that this protein induces mitochondrial fragmentation in most cells, whereas wild-type SOD1 does not (Fig. 4). The overexpression of Grx2 in the same lines is able to strongly inhibit mitochondrial fragmentation induced by mutSOD1 expression and restore a correct overall morphology in most cells. This is confirmed by electron microscopy analysis (Fig. 5) showing that SH-SY5Y cells infected with adenoviral vectors coding for mutSOD1 (for 72 h) display several swollen mitochondria, with barely recognizable cristae, while the same cells also overexpressing Grx2 display a partially rescued phenotype, with most mitochondria showing normal features and a minority with altered morphology.
Figure 4.

Effect of Grx2 on mitochondrial morphology. Top panel: NSC-34 cells expressing the cDNA encoding G93A mutSOD1 under control of the inducible Tet-On promoter as described in Materials and Methods and transfected with a plasmid coding for mitochondrial Grx2 were stained with an antibody recognizing the mitochondrial enzyme SOD2 (green) and an antibody against Grx2 (red). (A) and (B) are enlargements of the corresponding insets. Bottom panel: SH-SY5Y cells, either untransfected or stably overexpressing Grx2, were infected as indicated with an adenoviral vector leading the expression of SOD1 (wild-type or mutant G93A-SOD1). Staining: SOD2 (red) and Hoechst (nuclei).
Figure 5.
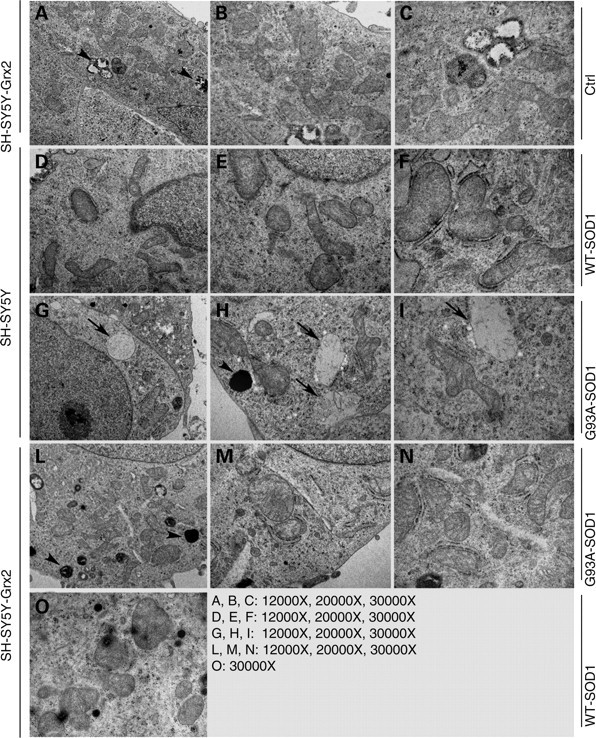
Effect of Grx2 on mitochondrial ultrastructure. Electron microscopic analysis of mitochondrial structure in SH-SY5Y cells either untransfected (SH-SY5Y) or expressing Grx2 (SH-SY5Y-Grx2). Cells were infected as indicated with an adenoviral vector leading the expression of SOD1 (wild-type or mutant G93A-SOD1). Ctrl, uninfected SH-SY5Y-Grx2. Arrows indicate swollen mitochondria and arrowheads indicate lysosomes.
Interestingly, the overall morphological alterations induced by mutSOD1 are paralleled by alterations in the expression pattern of two proteins that are known to control mitochondria dynamics, i.e. OPA1 (optical atrophy 1), which is a pro-fusion factor, and DRP1 (dynamin related protein 1), a protein that causes fragmentation when associated with mitochondria. As shown in Figure 6, western blot analysis demonstrates that mutSOD1 affects the level of both proteins, increasing the expression of OPA1 and decreasing the mitochondrial level of DRP1. Again, the overexpression of Grx2 is able to revert such alterations, restoring the expression levels of both proteins in both cell models. These results have been confirmed by the immunofluorescence analysis of the expression level of OPA1 and of the active form of DRP1, which is phosphorylated on Ser616. As clearly shown in Figure 7, the overexpression of Grx2 prevents the disappearance of OPA1 induced by mutSOD1 while lowering the expression of the active phospho-DRP1 already at 24 h after infection (Fig. 8). Noticeably, this effect is specific for Grx2, since under the same conditions Grx1 has no influence on the level of active phospho-DRP1 (see Supplementary Material, Fig. S5).
Figure 6.

Effect of Grx2 on the expression of proteins controlling mitochondrial dynamics. NSC-34 (top) and SH-SY5Y (bottom) cells, either untransfected or overexpressing Grx2, were infected with an adenoviral vector leading the transient expression of wild-type SOD1 or G93A-SOD1. Lysates from crude mitochondrial fractions were analyzed in western blot for total OPA1 and DRP1 expression levels. The mitochondrial protein VDAC1 was used as the loading control.
Figure 7.
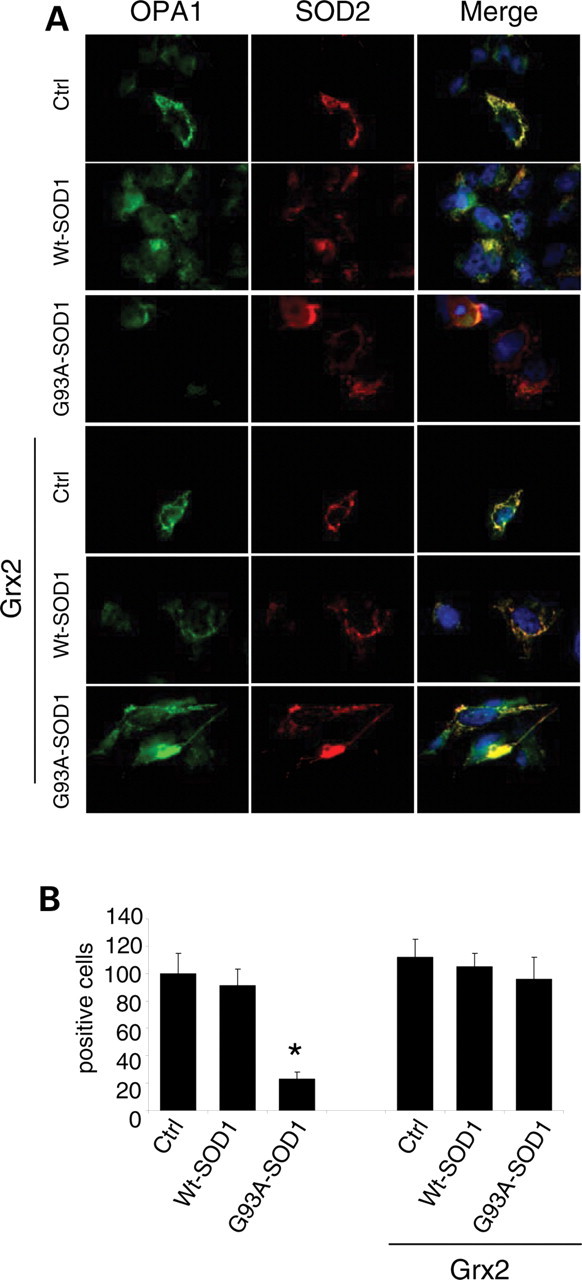
Effect of Grx2 on OPA1 expression in neuronal cells. SH-SY5Y cells, either untransfected or overexpressing Grx2, were infected with an adenoviral vector leading the transient expression of wild-type SOD1 or G93A-SOD1. (A) The cell lines were stained with antibodies recognizing the mitochondrial enzyme SOD2 (red) and OPA1 (green). Nuclei were stained with Hoechst 33342. (B) The proportion of OPA1 positive cells was scored (mean ± SD of three independent experiments). For each experimental condition, about 100 cells were counted in each of three randomly chosen fields. Values significantly different from relative controls are indicated with an asterisk when P < 0.01 (n = 3).
Figure 8.
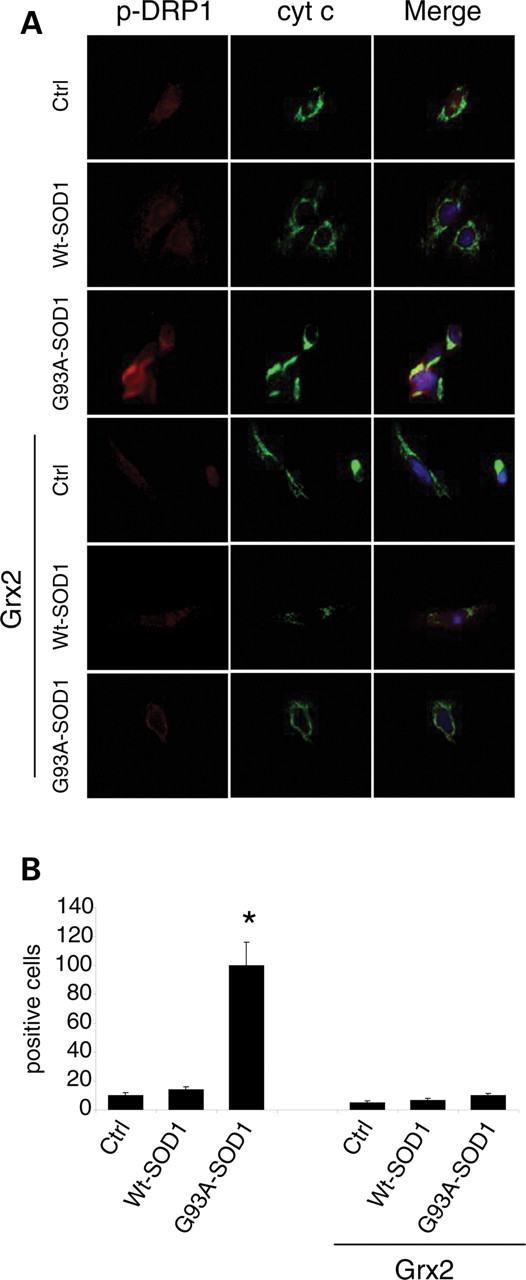
Effect of Grx2 on DRP1 activation in neuronal cells. SH-SY5Y cells, either untransfected or overexpressing Grx2, were infected with an adenoviral vector leading the transient expression of wild-type SOD1 or G93A-SOD1. (A) Cells were stained with antibodies recognizing the mitochondrial enzyme cytochrome c (green) and the active form of DRP1 (phospho-DRP1, red). Nuclei were stained with Hoechst 33342. (B) The proportion of phospho-DRP1 positive cells was scored (mean ± SD of three independent experiments). For each experimental condition, about 100 cells were counted in each of three randomly chosen fields. Values significantly different from relative controls are indicated with an asterisk when P < 0.01 (n = 3).
Grx2 protects mitochondrial metabolism from mutSOD1 toxicity
The effect of Grx2 on mitochondrial morphology parallels with a protective effect on mitochondrial metabolism. In fact, as shown in Figure 9A, Grx2 restores the activity of both complexes I and IV which are affected by mutSOD1 in SH-SY5Y cells already after 48 h of expression. Interestingly, the expression of mutSOD1 in SH-SY5Y cells for 72 h also induces the expression of PINK1 (PTEN-induced kinase 1), a mitochondria-targeted Ser/Thr kinase, selectively interacting with damaged/depolarized mitochondria (23) (Fig. 9B), and the overexpression of Grx2 prevents this effect induced by mutSOD1 and the following activation of the autophagy marker LC3 (microtubule-associated protein1 light chain 3). Finally, as we described previously in NSC-34 cells (3), the expression of mutSOD1 contributes to creating a pro-oxidant environment that may facilitate mutSOD1 oxidation/aggregation also in the mitochondria of SH-SY5Y cells (Fig. 9C, left). Strikingly, the overexpression of Grx2 increases the level of GSH lowering the oxidized form in mitochondria, and this reducing environment is not perturbed by the expression of mutSOD1 (Fig. 9C, right).
Figure 9.

Effect of Grx2 on mitochondrial metabolism in neuronal cells. Crude mitochondrial fractions were prepared from SH-SY5Y cells either untransfected or overexpressing Grx2 and infected with an adenoviral vector leading the transient expression of wild-type SOD1 or G93A-SOD1. (A) The activity of electron transport chain complexes I (left) and IV (right) was measured by spectrophotometric assays, normalized for protein content and expressed in nmol/min/mg. Values significantly different from relative controls are indicated with an asterisk when P < 0.01 (n = 3). (B) Top: western blot analysis of PINK1 expression levels. The mitochondrial protein VDAC was used as the loading control. One representative blot out of three is shown. Bottom: western blot analysis of active LC3 expression levels. β-Actin was used as the loading control. (C) Mitochondrial GSH/GSSG ratio. Note that the scale bar for cell expressing Grx2 (right) is different from that for untransfected cells (left).
Grx2 abolishes cell death induced by mutSOD1
The expression of mutSOD1 for 72 h in SH-SY5Y cells induces the activation of the apoptotic pathway, as clearly demonstrated by active caspase-3 immunolabeling and caspase-3 enzymatic activity (Fig. 10A), by the western blot analysis of the active/cleaved form of PARP (Fig. 10B), by cell damage as measured with MTS assay (Fig. 10A) and by the count of apoptotic nuclei (data not shown). All these effects are almost totally abrogated by Grx2 overexpression in SH-SY5Y cells. To demonstrate that this effect is directly related to Grx2 overexpression, we have partially silenced the endogenous expression of Grx2 in SH-SY5Y cells delivering an shRNA recognizing Grx2mRNA. For the experiments described below, we used a single clone of siRandom-SH-SY5Y cells and a single clone of siGrx2-SH-SY5Y cells, which showed an inhibition of Grx2 transcript of 62% with respect to controls, as measured by real-time RT–PCR (Fig. 10C). These lines were then infected with adenoviral vectors coding for mutSOD1. As shown in Figure 10D, siRNA-mediated downregulation of endogenous Grx2 expression increases caspase-3 and PARP activation in SH-SY5Y cells expressing mutSOD1 with respect to the same cell lines with a normal Grx2 expression.
Figure 10.

Effect of Grx2 on neuronal viability. (A) SH-SY5Y cells either untransfected or overexpressing Grx2 and infected with an adenoviral vector leading the transient expression of wild-type SOD1 or G93A-SOD1. Left panel: quantitative analysis of the numbers of caspase-3 positive cells, immunolabeled with an antibody recognizing the active fragment of caspase-3. For each experimental condition, about 100 cells were counted in each of three randomly chosen fields. Values are mean ± SD of three independent experiments; values significantly different from relative controls are indicated with an asterisk when P < 0.01. Center panel: determination of caspase-3 activity expressed in AFU (arbitrary fluorescence units) × 105 (mean ± SD). Values significantly different from relative controls are indicated with an asterisk when P < 0.01. Right panel: cell viability as assessed by an MTS assay. Absorbances at 490 nm (mean ± SD of three independent experiments) are expressed as percent of the relative untreated control cells. Values significantly different from relative controls are indicated with an asterisk when P < 0.01. (B) Western blot analysis for cleaved (active) PARP expression. Lamin serves as the loading control. Values significantly different from relative controls are indicated with an asterisk when P < 0.01 (n = 3). (C) Expression of Grx2 as measured by real-time RT–PCR on total RNA extracted from control SH-SY5Y cells (Ctrl), SH-SY5Y cells engineered for Grx2 downregulation (siGrx2) or with a random sequence that has no homology with any human transcript (siRandom). Values significantly different from relative controls are indicated with an asterisk when P < 0.01 (n = 3). (D) Top: caspase-3 activity in SH-SY5Y cells, either untransfected or overexpressing Grx2, infected with an adenoviral vector leading the transient expression of wild-type SOD1 or G93A-SOD1 and engineered for Grx2 downregulation, as indicated. AFU = arbitrary fluorescence units (mean ± SD). Values significantly different from relative controls are indicated with an asterisk when P < 0.01 (n = 3). Bottom: western blot analysis for cleaved (active) PARP expression. Values significantly different from relative controls are indicated with an asterisk when P < 0.01 (n = 3).
DISCUSSION
A large number of proteins (especially those localized in mitochondria) contain free thiols (24) that can be modified by the formation of internal disulfides or by mixed disulfides with low-molecular-mass thiols (5). The majority of these latter modifications result from the interaction of protein thiols with the endogenous glutathione pool. Loss of protein sulfhydryl groups and glutathionylation or thiolation may impair the function of proteins, and therefore the maintenance of thiol homeostasis is important for a normal cell activity. In this context, it is important to notice that physiological GSH/GSSG ratios affect the redox state of mitochondrial membrane protein thiols. For instance, maintenance of complex I with an oxidized GSH/GSSG ratio leads to a reversible loss of activity, via glutathionylation, and increases the production of H2O2 (14,25).
The fact that the oxidation state of cysteines represents a susceptibility factor for wild-type SOD1 stability and aggregation in vitro has been previously described. O'Halloran and co-worker have found that the demetallated, reduced monomers of human SOD1 cross-link with each other by forming intermolecular disulfide bonds under mild oxidative stress conditions such as increased levels of GSSG (26). The tendency to aggregate may be greatly enhanced for mutSOD1s linked to fALS. Spinal cords from ALS transgenic mice contain mutSOD1 cross-linked via intermolecular disulfide bonds (27,28) and mutSOD1s accumulate in the CNS of the same mice in a monomeric/misfolded form with a reduced disulfide bond (29,30). We have previously observed that mutSOD1 aggregates also accumulate in the mitochondrial fraction of spinal cord from G93A mice (4). A relevant role for the non-conserved Cys residues (Cys6 and Cys111) in the mutSOD1 aggregation process has been proposed by two independent studies performed in neuronal cell models (22,31) where an aberrant intermolecular disulfide bond between Cys6 and Cys111 has been indicated as crucial for high-molecular-weight aggregate formation, insolubility and neurotoxicity of the mutant protein. It is therefore clear that the protein disulfide metabolism, affected by the cellular redox environment, is deeply implicated in the process. Thus, the overexpression of either Grx1 or Grx2, by modifying the intracellular disulfide status under conditions of oxidative stress, may prevent the cysteine-mediated aggregation of mutSOD1 in the cytoplasm and into mitochondria. Indeed, evidence of a direct interaction between Grx and SOD1 had been reported by Carroll et al. (21), who showed that the yeast major cytosolic Grx reduces the intramolecular disulfide of mutSOD1 A4V in vivo and in vitro. Moreover, we have shown that overexpressed Grx1 increases the solubility of mutSOD1 in NSC-34 cells (22), suggesting that Grx1 can reduce the intermolecular disulfides that stabilize oligomeric structures, thus contributing to the solubility of mutSOD1.
Whether mutSOD1 aggregation is a causative event in fALS is controversial. For instance, while accumulation of mutSOD1 and ubiquitinated deposits in the spinal cord of G93A-SOD1 mice during motoneuron disease progression correlates with a decrease in proteasome activity (32) and inhibition of the induction of immunoproteasome decreases survival in a rat model of ALS (33), ubiquitination occurs only after SOD1 aggregation (34) indicating that damage through the formation of intracellular protein deposits may be secondary to other toxic properties of mutSOD1. The cellular localization of its aggregates may be relevant for mutSOD1 toxicity. For instance, G93A transgenic mice overexpressing CCS have an enhanced pathological phenotype, with a dramatic shortening of lifespan and a severe mitochondrial pathology associated with enhanced mitochondrial localization of mutSOD1, in the absence of clear cytosolic SOD1 inclusions (35,36). Overall, the results of this work corroborate this latter hypothesis. In fact, the overexpression of Grx1, which is mostly cytosolic, diminishes mutSOD1 aggregation and increases mutSOD1 solubility in the cytosol of neuronal cells, but does not interfere with the aggregation of mutSOD1 in mitochondria and with the activation of the cell death pathway induced by the mutant enzyme. On the other hand, mitochondrial Grx2 exerts a strong protective effect against mutSOD1 toxicity, abrogating the apoptotic processes while increasing the solubility of the mutant protein in mitochondria.
Several papers demonstrated that mutSOD1s associate with mitochondria regardless of the mutation (3), localizing in the outer membrane, in the intermembrane space and possibly also in the matrix of brain mitochondria from ALS mice (37–42). Localization of mutSOD1 in mitochondria parallels the impairment of mitochondrial oxidative metabolism and the induction of cell death programs in different ALS experimental models (43). We have recently demonstrated that the obligatory expression of mutSOD1 G93A in the intermembrane space of mitochondria promotes mitochondrial SOD1 oligomerization and induction of a cell death program in neuronal cells and that this phenotype is abrogated by mutation of the Cys111 residue, which is relevant for aberrant protein–protein interactions (4). However, removal of this Cys residue does not totally inhibit mutSOD1 toxicity since mitochondrial fragmentation is observed also in cells expressing the artificial double mutSOD1 (G93A/C111S). In the present work, we have observed that Grx2 also acts on mitochondrial morphology, promoting mitochondrial fusion and restoring the correct expression levels of two proteins deeply involved in the regulation of mitochondrial dynamics that are altered by the expression of mutSOD1. This observation prompts us to hypothesize that Grx2 may not just interact directly with mutSOD1 reducing spurious disulfide bridges that lead to its oligomerization, but may also protect mitochondrial metabolism, a role already proposed for this protein by other authors (6). In particular, Grx2 knock-down via siRNA increases cellular sensitivity to stress-inducing agents in HeLa cells (16), whereas its overexpression decreases the susceptibility of the same cells to apoptotic stimuli (17) and abolishes toxicity mediated by the neurotoxicant MPP+ in Neuro2a (44). In line with these observations, in our neuronal models, Grx2 overexpression prevents or reverts the inhibition of respiratory complexes and inhibits the strong association of PINK1 with mitochondria induced by mutSOD1. PINK1 has a serine/threonine kinase functional domain sharing a high degree of homology with that of the Ca2+/calmodulin kinase family. It localizes into mitochondria and a mutant form of this protein is associated with familial Parkinson disease (45). The role of PINK1 in the mitochondrial compartment is still debated, but a recent work described a possible mechanism by which PINK1 associates selectively with depolarized/damaged mitochondria (23). Interestingly, following the onset of disease, PINK1 expression is increased in the spinal motoneurons of G93ASOD1 transgenic mice (46). In light of this evidence, the observed strong increase in PINK1 in cells expressing mutSOD1 may be interpreted as a further marker of mitochondrial injury that is inhibited by the overexpression of Grx2.
Finally, Grx2 has a known role in the protection of complex I from oxidative glutathionylation (14), and depletion of mitochondrial glutathione pool evokes a dose-dependent inhibition of Grx2 that decreases iron incorporation into complex I and aconitase (47). Thus, Grx2 may act more generally as an antioxidant enzyme in mitochondria, protecting respiratory complexes from oxidative injuries. We have previously reported that the impairment of the respiratory chain and the shift in the mitochondrial GSH/GSSG ratio toward more oxidizing conditions are important consequences of the presence of mutSOD1s in mitochondria (3). Mitochondrial association may descend by glutathione-mediated modification of cysteine residues, causing mutSOD1s to accumulate in an oxidized, aggregate state and be trapped into the organelle. In line with these observations, the ability of Grx2 to increase the mitochondrial concentration of the reduced form of glutathione may explain the higher solubility of mutSOD1 in mitochondria with respect to cell lines that do not overexpress Grx2.
In summary, we have demonstrated that the interception of aggregation of mutSOD1 in the cytosol, but not in mitochondria, through the overexpression of Grx1 is not sufficient to prevent cell damage in neuronal cells lines Conversely, the overexpression of Grx2 in mitochondria not only abolishes mutSOD1 aggregation in this compartment, but also restores several parameters of mitochondrial function and healthy cell viability. Grx2 may act directly on mutSOD1 and/or indirectly, providing a more favorable mitochondrial environment that prevents SOD1 aggregation. The preferential localization of Grx2 in the matrix suggests that a direct interaction between Grx2 and mutSOD1 in the IMS is not likely to occur and that Grx2 may just provide protection through its pro-survival, redox action on mitochondria. On the other hand, that Grx1 is not able to prevent the formation of insoluble forms of mutSOD1 in the IMS is puzzling.
A likely explanation is that mutSOD1 associates with mitochondria as an unfolded monomer and causes mitochondrial damage in a pre-aggregated state. This is in line with the very recent report (48) that misfolded mutSOD1, detected with conformation-specific antibodies, binds directly to the voltage-dependent anion channel (VDAC1), an integral membrane protein embedded in the outer mitochondrial membrane, in early symptomatic transgenics mutSOD1 rats and mice. Once that mitochondria are misfunctioning and that their redox state is altered, mutSOD1 tends to aggregate and further damage mitochondria. Grx2 is able to prevent the primary mitochondrial damage, most probably improving respiratory chain activity and mitochondrial metabolism. Therefore, Grx2 prevents further oxidative stress and aggregation of mutSOD1 in the IMS. On the other hand, Grx1 is not able to restore a healthy mitochondrial condition and a correct mitochondrial redox state and therefore can neither rescue cells from death nor prevent aggregation of mutSOD1 in the IMS. Paradoxically, that Grx1 resolves cytosolic aggregates may even increase the fraction of unfolded monomeric mutSOD1 that associates with mitochondria and thus contribute to perpetuate damage.
Although this model needs further validation in vivo, our results offer the proof of concept that interception of mitochondrial damage is feasible and is a promising approach for several neurodegenerative conditions, including non-SOD1 linked ALS.
MATERIALS AND METHODS
Plasmids
Mouse glutaredoxin-1 (glrx1, accession no. NM053108) and mouse mitochondrial splicing variant glutaredoxin-2 (glrx2a, NM001038592.1) were cloned by RT–PCR from mouse brain cDNA. Grx1 was cloned using the forward primer 5′-AAAAAGCTTATGGCTCAGGAGTTTGTGAAC-3′ and the reverse primer 5′-AAAGGATCCTTATAACTGCAGAGCTCCAATC-3′; the resulting PCR fragment was inserted into HindIII/BamHI restriction sites of pcDNA3 (Invitrogen, Paisley, UK). Grx2 was cloned using the forward primer 5′-AAAGGATCCATGTCCTGGCGCCGC-3′ and the reverse primer 5′-AAAGCGGCCGCTCAATGTCTTTCCTCTTGTTTTTTT-3′; the resulting PCR fragment was inserted into BamHI/NotI restriction sites of pcDNA3 (Invitrogen).
Transfection for either transient or stable expression of each vector was obtained with Lipofectamine Plus reagent (Invitrogen) according to the manufacturer's instruction as described previously (22).
Viral infection
Human cDNAs coding for wild-type SOD1 and mutant G93A-SOD1 were cloned in pAdeno-X vector (Clontech, Mountain View, CA, USA) and adenoviral particles were produced and titrated using the Adenoviral-X Expression System 1 (Clontech).
Cells were infected with adenoviral particles (500–1000 plaque-forming units/cell) in Optimem (Invitrogen) and incubated at 37°C for 1 h. The infected cells (usually more than 95% expressing SOD1) were harvested at 72 h after infection unless differently indicated.
Cell lines
All of the cell lines used in this study, derived either from mouse motoneuronal cell line NSC-34 (neuroblastoma × spinal cord hybrid, a gift of N. R. Cashman, University of Toronto, Canada) or from human neuroblastoma SH-SY5Y cell line (originally obtained from European collection of cell cultures, ECACC), were grown in Dulbecco's modified Eagle's/F-12 medium supplemented with 10% FCS at 37°C in an atmosphere of 5% CO2 in air, as described elsewhere (3,22). To obtain constitutive expression of Grxs, both cell lines were transfected with the pcDNA3-derived plasmids described above using Lipofectamine Plus (Invitrogen) according to the manufacturer's guideline. Single clones were isolated after 3 weeks of selection with 400 µg/ml G418 (Gibco, Paisley, UK) and screened by western blot and determination of enzymatic activity. The lines with higher activity were chosen for further experiments.
Where indicated, cell lines derived from NSC-34 and expressing either human wtSOD1 or human fALS typical mutSOD1s under control of the inducible Tet-On promoter have been used. This model has been previously set up and described by us (3).
Cell viability was assessed by a colorimetric assay, using the 3(4,5-dimethylthiazol-2yl)-5-(3-carboxymethoxyphenyl)-2-(4-sulfophenyl)-2H-tetrazolium (MTS) assay (CellTiter 96 Aqueous one solution assay; Promega), according to the manufacturer's instructions. Absorbance at 490 nm was measured in a multilabel counter (Victor3-V; PerkinElmer Life Sciences, Waltham, MA, USA).
SiRNA
Silencing of Glrx2a in SH-SY5Y cells was obtained by retroviral mediated expression of shRNA AATGAAGCCTATGAGTGTCAGCCTGTCTC (sense) and AACTGACACTCATAGGCTTCACCTGTCTC (antisense) using pRETRO-Super vector, as described previously (49).
As a control, an unspecific ‘scrambled' (si-random) siRNA with the following oligonucleotides: AACATTCACTCAGGTCATCAGCCTGTCTC (sense) and AACTGATGACCTGAGTGAATGCCTGTCTC (antisense) was used.
The obtained monoclonal cell lines were screened by real-time PCR. Total RNA (2 μg) was retrotranscribed according to standard procedures and one-tenth of the cDNA was used to quantify the transcripts by real-time RT–PCR using probes from the Universal ProbeLibrary (Roche Applied Science Indianapolis, IN, USA) and gene-specific primers designed by the Probe Finder software (Roche Applied Science Indianapolis). Relative quantities were calculated relative to β-actin mRNA and assumed to be constant. The real-time PCR was performed with the 7900HT Fast Real-Time PCR System by Applied Biosystem.
Cell lysis and western blot
Total cell lysates were obtained by resuspending cells in RIPA buffer (50 mm Tris–HCl pH 7.4, 0.5% Triton X-100, 0.25% Na-deoxycholate, 0.1% SDS, 150 mm NaCl, 1 mm EDTA and 5 mm MgCl2) containing a 1:1000 dilution of protease inhibitor mixture (Sigma-Aldrich, St Louis, MO, USA). A clear supernatant was obtained by centrifugation of lysates at 17 000g for 10 min. Protein content was determined using Bradford protein assay (Bio-Rad, Hercules, CA, USA). Western blot was performed on nitrocellulose membranes (Amersham Pharmacia, Piscataway, NJ, USA). Filters were incubated with the appropriate antibody at the following dilution: β-actin, mouse monoclonal antibody (Sigma-Aldrich) 1:5000; DRP1, rabbit polyclonal antibody (Novus Biologicals, Littleton, CO) 1:2500; Grx1, goat polyclonal antibody (R&D Systems, Minneapolis, MN, USA) 1:1000; LC3 Rabbit Polyclonal antibody (MBL, Naga-ku, Japan) 1:1000: this antibody detects both forms of LC3; OPA1, mouse monoclonal antibody (BD Biosciences, San Jose, CA, USA) 1:2500; cleaved PARP, rabbit polyclonal antibody (Cell Signaling Technology, Danvers, MA, USA) 1:2500; PINK1, rabbit polyclonal antibody (Neuromics, Edina, MN, USA) 1:1000; SOD1, rabbit polyclonal antibody (Assay Designs, Stressgen, Ann Arbor, MI, USA) 1:5000; VDAC (Calbiochem, San Diego, CA, USA) 1:5000.
Filters were incubated with the appropriate peroxidase-conjugated secondary antibodies (Bio-Rad Hercules, CA, USA) and developed using the HRP chemiluminescence detection system (Roche, Indianapolis, IN, USA). Immunoblots were digitalized and quantified with Image Quant TL software v2003.02 (Amersham Pharmacia Biosciences, Piscataway, NJ, USA).
Where indicated, the cytosolic and mitochondrial fractions were obtained as described previously (3).
Biochemical assays
The activities of complexes I and IV were measured by spectrophotometric assays as described previously (3) on mitochondria isolated from neuronal cells (5 × 10⁷) homogenized in a buffer containing 210 mm mannitol, 70 mm sucrose, 1 mm EDTA and 10 mm HEPES KOH at pH 7.5 in a potter homogenizer with a Teflon piston and following the isolation procedure described by Frezza et al. (50).
Grx activity was determined in extracts from cells lyzed on ice in lysis buffer (50 mm Tris–HCl pH 8, 1 mm EDTA, 20% glycerol, 0.5% NP-40) containing a 1:1000 dilution of protease inhibitor mixture (Sigma-Aldrich). A clear supernatant was obtained by centrifugation of lysates at 17 000g for 10 min. Enzymatic activity of Grxs was determined using hydroxyethyl disulfide (HED) as a substrate according to Hashemy et al. (13). The decrease in absorbance at 340 nm was followed using a Perkin Elmer lambda-25 spectrophotometer. Activity was expressed as μmol NADPH oxidized/min using a molar extinction coefficient of 6200 m−1cm−1. This assay does not discriminate between Grx1 and Grx2 activities. Since Grx2 activity is less than 1% of total Grx activity, Grx activity measured in total extracts is a good estimate of Grx1, while Grx2 was evaluated on purified mitochondria.
Caspase 3 activity was measured with a TruePoint Caspase 3 assay kit (PerkinElmer Waltham, MA, USA), according to the manufacturer's instructions.
Solubility of the various SOD1s was assessed as follows: cells were lyzed in RIPA Buffer (50 mm Tris–HCl pH 7.4, 0.5% Triton X-100, 0.25% Na-deoxycholate, 0.1% SDS, 150 mm NaCl, 1 mm EDTA and 5 mm MgCl2) containing a 1:1000 dilution of protease inhibitor mixture (Sigma-Aldrich) and centrifuged at 20 000g for 15 min to obtain detergent-soluble supernatant and detergent-insoluble pellet fractions. Pellets were washed three times in RIPA Buffer, solubilized in 1× sample buffer (55 mm Tris pH 6.8, 10% glycerol, 1% SDS, 5% β-mercaptoethanol and 0.1% bromophenol blue) and heated at 100°C for 5 min. Loading of samples was 5 μg total protein for each cytosolic supernatant and 10 μg total protein for each mitochondrial supernatant in 1× sample buffer. Insoluble pellets were resuspended in the same volume as the supernatant; an aliquot corresponding to the same volume loaded for the supernatant was run on the gel.
Determination of intracellular glutathione cells was performed by HPLC as described previously (3).
Immunocytochemical analysis
Cells were fixed at room temperature for 10 min with 4% paraformaldehyde in PBS and permeabilized with 0.2% Triton X-100. Cells were stained for the following proteins using the appropriate antibody at the following dilution: cytochrome c, mouse monoclonal antibody (BD Biosciences) 1:300; cleaved caspase-3, rabbit polyclonal antibody (Cell Signaling Technology) 1:300; DRP1, rabbit polyclonal antibody (Novus Biologicals, Littleton, CO, USA) 1:500; phospho-DRP1, rabbit polyclonal antibody (Cell Signaling Technology) 1:1000; Grx2, mouse polyclonal antibody (Abnova, Taiwan) 1:300; OPA1, mouse monoclonal antibody (BD Biosciences) 1:500; SOD1 (G11), mouse monoclonal antibody (Santa Cruz Biotechnology, Santa Cruz, CA, USA) 1:100; SOD2, rabbit polyclonal antibody (Assay Designs, Stressgen) 1:200, followed by a fluorescein-conjugated secondary antibody by Stressgen. After rinsing in PBS, cells were counterstained with 1 μg/ml Hoechst 33342 (Sigma-Aldrich) and examined under a fluorescence microscope (BX51, Olympus) equipped with an F-View digital camera and the Cell-F Digital Imaging Software. Fluorescence images were processed using Adobe Photoshop.
Electron microscopy
For ultrastructural studies, cells were grown on permanox chamber slides (LAB-TEK Brand Products, Nalge Nunc Int., Rochester, NY, USA). Cultures were briefly rinsed in 0.1 m cacodylate buffer, pH 7.4, and then fixed in 2.5% glutaraldehyde in the same buffer, for 45 min, rinsed again and post-fixed with 1% osmium tetroxide in buffer, for 45 min at 4°C, in the dark. After rinsing in buffer, slides were gradually dehydrated in ethanol. All the steps of the above procedure were carried out at 4°C. Cells were then infiltrated with graded mixtures of ethanol and Epon 812 (TAAB, Reading, UK), and finally embedded in the same resin, allowing specimens to polymerize at 60°C for 3 days. Blocks were cut by a Reichert Ultracut S ultramicrotome, thus obtaining ultrathin sections (60–70 nm) which were collected on nickel grids. Sections were briefly contrasted with 1% uranyl acetate, then observed in a Philips CM 120 electron microscope equipped with a Philips Megaview III videocamera. Images were electronically captured by an AnalySys 2.0 software and composed in an Adobe Photoshop CS2 format.
Statistical analysis
The results are presented as means ± SD of n ≥ 3 independent experiments. Statistical evaluation was conducted by simple Student's t-test, and values significantly different from the relative control are indicated with an asterisk when P < 0.01.
SUPPLEMENTARY MATERIAL
Supplementary Material is available at HMG online.
Conflict of Interest statement. None declared.
FUNDING
This work was supported by ALS Association (grant number 1706 to M.T.C.), Telethon-Italy (grant number GGP07018 to M.T.C.) and MIUR (PRIN 2008J2LRWZ_002 to A.F.).
Supplementary Material
REFERENCES
- 1.Cozzolino M., Ferri A., Carri M.T. Amyotrophic lateral sclerosis: from current developments in the laboratory to clinical implications. Antioxid. Redox Signal. 2008;10:405–443. doi: 10.1089/ars.2007.1760. doi:10.1089/ars.2007.1760. [DOI] [PubMed] [Google Scholar]
- 2.Chattopadhyay M., Valentine J.S. Aggregation of copper-zinc superoxide dismutase in familial and sporadic ALS. Antioxid. Redox Signal. 2009;11:1603–1614. doi: 10.1089/ars.2009.2536. doi:10.1089/ars.2009.2536. [DOI] [PMC free article] [PubMed] [Google Scholar]
- 3.Ferri A., Cozzolino M., Crosio C., Nencini M., Casciati A., Gralla E.B., Rotilio G., Valentine J.S., Carri M.T. Familial ALS-superoxide dismutases associate with mitochondria and shift their redox potentials. Proc. Natl Acad. Sci. USA. 2006;103:13860–13865. doi: 10.1073/pnas.0605814103. doi:10.1073/pnas.0605814103. [DOI] [PMC free article] [PubMed] [Google Scholar]
- 4.Cozzolino M., Pesaresi M.G., Amori I., Crosio C., Ferri A., Nencini M., Carri M.T. Oligomerization of mutant SOD1 in mitochondria of motoneuronal cells drives mitochondrial damage and cell toxicity. Antioxid. Redox Signal. 2009;11:1547–1558. doi: 10.1089/ars.2009.2545. doi:10.1089/ars.2009.2545. [DOI] [PubMed] [Google Scholar]
- 5.Hurd T.R., Filipovska A., Costa N.J., Dahm C.C., Murphy M.P. Disulphide formation on mitochondrial protein thiols. Biochem. Soc. Trans. 2005;33:1390–1393. doi: 10.1042/BST0331390. doi:10.1042/BST20051390. [DOI] [PubMed] [Google Scholar]
- 6.Lillig C.H., Berndt C., Holmgren A. Glutaredoxin systems. Biochim. Biophys. Acta. 2008;1780:1304–1317. doi: 10.1016/j.bbagen.2008.06.003. [DOI] [PubMed] [Google Scholar]
- 7.Balijepalli S., Boyd M.R., Ravindranath V. Human brain thioltransferase: constitutive expression and localization by fluorescence in situ hybridization. Brain Res. Mol. Brain Res. 2000;85:123–132. doi: 10.1016/s0169-328x(00)00206-0. doi:10.1016/S0169-328X(00)00206-0. [DOI] [PubMed] [Google Scholar]
- 8.Jurado J., Prieto-Alamo M.J., Madrid-Risquez J., Pueyo C. Absolute gene expression patterns of thioredoxin and glutaredoxin redox systems in mouse. J. Biol. Chem. 2003;278:45546–45554. doi: 10.1074/jbc.M307866200. doi:10.1074/jbc.M307866200. [DOI] [PubMed] [Google Scholar]
- 9.Gladyshev V.N., Liu A., Novoselov S.V., Krysan K., Sun Q.A., Kryukov V.M., Kryukov G.V., Lou M.F. Identification and characterization of a new mammalian glutaredoxin (thioltransferase), Grx2. J. Biol. Chem. 2001;276:30374–30380. doi: 10.1074/jbc.M100020200. doi:10.1074/jbc.M100020200. [DOI] [PubMed] [Google Scholar]
- 10.Lundberg M., Johansson C., Chandra J., Enoksson M., Jacobsson G., Ljung J., Johansson M., Holmgren A. Cloning and expression of a novel human glutaredoxin (Grx2) with mitochondrial and nuclear isoforms. J. Biol. Chem. 2001;276:26269–26275. doi: 10.1074/jbc.M011605200. doi:10.1074/jbc.M011605200. [DOI] [PubMed] [Google Scholar]
- 11.Lundberg M., Fernandes A.P., Kumar S., Holmgren A. Cellular and plasma levels of human glutaredoxin 1 and 2 detected by sensitive ELISA systems. Biochem Biophys Res Commun. 2004;319:801–809. doi: 10.1016/j.bbrc.2004.04.199. doi:10.1016/j.bbrc.2004.04.199. [DOI] [PubMed] [Google Scholar]
- 12.Hudemann C., Lonn M.E., Godoy J.R., Zahedi Avval F., Capani F., Holmgren A., Lillig C.H. Identification, expression pattern, and characterization of mouse glutaredoxin 2 isoforms. Antioxid. Redox Signal. 2009;11:1–14. doi: 10.1089/ars.2008.2068. doi:10.1089/ars.2008.2068. [DOI] [PubMed] [Google Scholar]
- 13.Hashemy S.I., Johansson C., Berndt C., Lillig C.H., Holmgren A. Oxidation and S-nitrosylation of cysteines in human cytosolic and mitochondrial glutaredoxins: effects on structure and activity. J. Biol. Chem. 2007;282:14428–14436. doi: 10.1074/jbc.M700927200. doi:10.1074/jbc.M700927200. [DOI] [PubMed] [Google Scholar]
- 14.Beer S.M., Taylor E.R., Brown S.E., Dahm C.C., Costa N.J., Runswick M.J., Murphy M.P. Glutaredoxin 2 catalyzes the reversible oxidation and glutathionylation of mitochondrial membrane thiol proteins: implications for mitochondrial redox regulation and antioxidant DEFENSE. J. Biol. Chem. 2004;279:47939–47951. doi: 10.1074/jbc.M408011200. doi:10.1074/jbc.M408011200. [DOI] [PubMed] [Google Scholar]
- 15.Hurd T.R., Requejo R., Filipovska A., Brown S., Prime T.A., Robinson A.J., Fearnley I.M., Murphy M.P. Complex I within oxidatively stressed bovine heart mitochondria is glutathionylated on Cys-531 and Cys-704 of the 75-kDa subunit: potential role of CYS residues in decreasing oxidative damage. J. Biol. Chem. 2008;283:24801–24815. doi: 10.1074/jbc.M803432200. doi:10.1074/jbc.M803432200. [DOI] [PMC free article] [PubMed] [Google Scholar]
- 16.Lillig C.H., Lonn M.E., Enoksson M., Fernandes A.P., Holmgren A. Short interfering RNA-mediated silencing of glutaredoxin 2 increases the sensitivity of HeLa cells toward doxorubicin and phenylarsine oxide. Proc. Natl Acad. Sci. USA. 2004;101:13227–13232. doi: 10.1073/pnas.0401896101. doi:10.1073/pnas.0401896101. [DOI] [PMC free article] [PubMed] [Google Scholar]
- 17.Enoksson M., Fernandes A.P., Prast S., Lillig C.H., Holmgren A., Orrenius S. Overexpression of glutaredoxin 2 attenuates apoptosis by preventing cytochrome c release. Biochem. Biophys. Res. Commun. 2005;327:774–779. doi: 10.1016/j.bbrc.2004.12.067. doi:10.1016/j.bbrc.2004.12.067. [DOI] [PubMed] [Google Scholar]
- 18.Gallogly M.M., Starke D.W., Mieyal J.J. Mechanistic and kinetic details of catalysis of thiol–disulfide exchange by glutaredoxins and potential mechanisms of regulation. Antioxid. Redox Signal. 2009;11:1059–1081. doi: 10.1089/ars.2008.2291. doi:10.1089/ars.2008.2291. [DOI] [PMC free article] [PubMed] [Google Scholar]
- 19.Anathy V., Aesif S.W., Guala A.S., Havermans M., Reynaert N.L., Ho Y.S., Budd R.C., Janssen-Heininger Y.M. Redox amplification of apoptosis by caspase-dependent cleavage of glutaredoxin 1 and S-glutathionylation of Fas. J. Cell Biol. 2009;184:241–252. doi: 10.1083/jcb.200807019. doi:10.1083/jcb.200807019. [DOI] [PMC free article] [PubMed] [Google Scholar]
- 20.Saeed U., Durgadoss L., Valli R.K., Joshi D.C., Joshi P.G., Ravindranath V. Knockdown of cytosolic glutaredoxin 1 leads to loss of mitochondrial membrane potential: implication in neurodegenerative diseases. PLoS ONE. 2008;3:e2459. doi: 10.1371/journal.pone.0002459. doi:10.1371/journal.pone.0002459. [DOI] [PMC free article] [PubMed] [Google Scholar]
- 21.Carroll M.C., Outten C.E., Proescher J.B., Rosenfeld L., Watson W.H., Whitson L.J., Hart P.J., Jensen L.T., Cizewski Culotta V. The effects of glutaredoxin and copper activation pathways on the disulfide and stability of Cu,Zn superoxide dismutase. J. Biol. Chem. 2006;281:28648–28656. doi: 10.1074/jbc.M600138200. doi:10.1074/jbc.M600138200. [DOI] [PMC free article] [PubMed] [Google Scholar]
- 22.Cozzolino M., Amori I., Pesaresi M.G., Ferri A., Nencini M., Carri M.T. Cysteine 111 affects aggregation and cytotoxicity of mutant Cu,Zn-superoxide dismutase associated with familial amyotrophic lateral sclerosis. J. Biol. Chem. 2008;283:866–874. doi: 10.1074/jbc.M705657200. doi:10.1074/jbc.M705657200. [DOI] [PMC free article] [PubMed] [Google Scholar]
- 23.Narendra D.P., Jin S.M., Tanaka A., Suen D.F., Gautier C.A., Shen J., Cookson M.R., Youle R.J. PINK1 is selectively stabilized on impaired mitochondria to activate Parkin. PLoS Biol. 2010;8:e1000298. doi: 10.1371/journal.pbio.1000298. [DOI] [PMC free article] [PubMed] [Google Scholar]
- 24.Requejo R., Hurd T.R., Costa N.J., Murphy M.P. Cysteine residues exposed on protein surfaces are the dominant intramitochondrial thiol and may protect against oxidative damage. FEBS J. 2010;277:1465–1480. doi: 10.1111/j.1742-4658.2010.07576.x. [DOI] [PMC free article] [PubMed] [Google Scholar]
- 25.Taylor E.R., Hurrell F., Shannon R.J., Lin T.K., Hirst J., Murphy M.P. Reversible glutathionylation of complex I increases mitochondrial superoxide formation. J. Biol. Chem. 2003;278:19603–19610. doi: 10.1074/jbc.M209359200. doi:10.1074/jbc.M209359200. [DOI] [PubMed] [Google Scholar]
- 26.Furukawa Y., O'Halloran T.V. Amyotrophic lateral sclerosis mutations have the greatest destabilizing effect on the apo- and reduced form of SOD1, leading to unfolding and oxidative aggregation. J. Biol. Chem. 2005;280:17266–17274. doi: 10.1074/jbc.M500482200. doi:10.1074/jbc.M500482200. [DOI] [PubMed] [Google Scholar]
- 27.Furukawa Y., Fu R., Deng H.X., Siddique T., O'Halloran T.V. Disulfide cross-linked protein represents a significant fraction of ALS-associated Cu, Zn-superoxide dismutase aggregates in spinal cords of model mice. Proc. Natl Acad. Sci. USA. 2006;103:7148–7153. doi: 10.1073/pnas.0602048103. doi:10.1073/pnas.0602048103. [DOI] [PMC free article] [PubMed] [Google Scholar]
- 28.Wang J., Xu G., Borchelt D.R. Mapping superoxide dismutase 1 domains of non-native interaction: roles of intra- and intermolecular disulfide bonding in aggregation. J. Neurochem. 2006;96:1277–1288. doi: 10.1111/j.1471-4159.2005.03642.x. doi:10.1111/j.1471-4159.2005.03642.x. [DOI] [PMC free article] [PubMed] [Google Scholar]
- 29.Jonsson P.A., Graffmo K.S., Andersen P.M., Brannstrom T., Lindberg M., Oliveberg M., Marklund S.L. Disulphide-reduced superoxide dismutase-1 in CNS of transgenic amyotrophic lateral sclerosis models. Brain. 2006;129:451–464. doi: 10.1093/brain/awh704. doi:10.1093/brain/awh704. [DOI] [PubMed] [Google Scholar]
- 30.Rakhit R., Robertson J., Vande Velde C., Horne P., Ruth D.M., Griffin J., Cleveland D.W., Cashman N.R., Chakrabartty A. An immunological epitope selective for pathological monomer-misfolded SOD1 in ALS. Nat. Med. 2007;13:754–759. doi: 10.1038/nm1559. doi:10.1038/nm1559. [DOI] [PubMed] [Google Scholar]
- 31.Niwa J., Yamada S., Ishigaki S., Sone J., Takahashi M., Katsuno M., Tanaka F., Doyu M., Sobue G. Disulfide bond mediates aggregation, toxicity, and ubiquitylation of familial amyotrophic lateral sclerosis-linked mutant SOD1. J. Biol. Chem. 2007;282:28087–28095. doi: 10.1074/jbc.M704465200. doi:10.1074/jbc.M704465200. [DOI] [PubMed] [Google Scholar]
- 32.Cheroni C., Peviani M., Cascio P., Debiasi S., Monti C., Bendotti C. Accumulation of human SOD1 and ubiquitinated deposits in the spinal cord of SOD1G93A mice during motor neuron disease progression correlates with a decrease of proteasome. Neurobiol. Dis. 2005;18:509–522. doi: 10.1016/j.nbd.2004.12.007. doi:10.1016/j.nbd.2004.12.007. [DOI] [PubMed] [Google Scholar]
- 33.Ahtoniemi T., Goldsteins G., Keksa-Goldsteine V., Malm T., Kanninen K., Salminen A., Koistinaho J. Pyrrolidine dithiocarbamate inhibits induction of immunoproteasome and decreases survival in a rat model of amyotrophic lateral sclerosis. Mol. Pharmacol. 2007;71:30–37. doi: 10.1124/mol.106.028415. doi:10.1124/mol.106.028415. [DOI] [PubMed] [Google Scholar]
- 34.Basso M., Massignan T., Samengo G., Cheroni C., De Biasi S., Salmona M., Bendotti C., Bonetto V. Insoluble mutant SOD1 is partly oligoubiquitinated in amyotrophic lateral sclerosis mice. J. Biol. Chem. 2006;281:33325–33335. doi: 10.1074/jbc.M603489200. doi:10.1074/jbc.M603489200. [DOI] [PubMed] [Google Scholar]
- 35.Son M., Puttaparthi K., Kawamata H., Rajendran B., Boyer P.J., Manfredi G., Elliott J.L. Overexpression of CCS in G93A-SOD1 mice leads to accelerated neurological deficits with severe mitochondrial pathology. Proc. Natl Acad. Sci. USA. 2007;104:6072–6077. doi: 10.1073/pnas.0610923104. doi:10.1073/pnas.0610923104. [DOI] [PMC free article] [PubMed] [Google Scholar]
- 36.Son M., Leary S.C., Romain N., Pierrel F., Winge D.R., Haller R.G., Elliott J.L. Isolated cytochrome c oxidase deficiency in G93A SOD1 mice overexpressing CCS protein. J. Biol. Chem. 2008;283:12267–12275. doi: 10.1074/jbc.M708523200. doi:10.1074/jbc.M708523200. [DOI] [PMC free article] [PubMed] [Google Scholar]
- 37.Higgins C.M., Jung C., Ding H., Xu Z. Mutant Cu, Zn superoxide dismutase that causes motoneuron degeneration is present in mitochondria in the CNS. J. Neurosci. 2002;22:RC215. doi: 10.1523/JNEUROSCI.22-06-j0001.2002. [DOI] [PMC free article] [PubMed] [Google Scholar]
- 38.Jaarsma D., Rognoni F., van Duijn W., Verspaget H.W., Haasdijk E.D., Holstege J.C. CuZn superoxide dismutase (SOD1) accumulates in vacuolated mitochondria in transgenic mice expressing amyotrophic lateral sclerosis-linked SOD1 mutations. Acta Neuropathol. 2001;102:293–305. doi: 10.1007/s004010100399. [DOI] [PubMed] [Google Scholar]
- 39.Mattiazzi M., D'Aurelio M., Gajewski C.D., Martushova K., Kiaei M., Beal M.F., Manfredi G. Mutated human SOD1 causes dysfunction of oxidative phosphorylation in mitochondria of transgenic mice. J. Biol. Chem. 2002;277:29626–29633. doi: 10.1074/jbc.M203065200. doi:10.1074/jbc.M203065200. [DOI] [PubMed] [Google Scholar]
- 40.Okado-Matsumoto A., Fridovich I. Subcellular distribution of superoxide dismutases (SOD) in rat liver: Cu,Zn-SOD in mitochondria. J. Biol. Chem. 2001;276:38388–38393. doi: 10.1074/jbc.M105395200. doi:10.1074/jbc.M105395200. [DOI] [PubMed] [Google Scholar]
- 41.Vande Velde C., Miller T.M., Cashman N.R., Cleveland D.W. Selective association of misfolded ALS-linked mutant SOD1 with the cytoplasmic face of mitochondria. Proc. Natl Acad. Sci. USA. 2008;105:4022–4027. doi: 10.1073/pnas.0712209105. doi:10.1073/pnas.0712209105. [DOI] [PMC free article] [PubMed] [Google Scholar]
- 42.Vijayvergiya C., Beal M.F., Buck J., Manfredi G. Mutant superoxide dismutase 1 forms aggregates in the brain mitochondrial matrix of amyotrophic lateral sclerosis mice. J. Neurosci. 2005;25:2463–2470. doi: 10.1523/JNEUROSCI.4385-04.2005. doi:10.1523/JNEUROSCI.4385-04.2005. [DOI] [PMC free article] [PubMed] [Google Scholar]
- 43.Kawamata H., Manfredi G. Mitochondrial dysfunction and intracellular calcium dysregulation in ALS. Mech. Ageing Dev. 2010;131:517–526. doi: 10.1016/j.mad.2010.05.003. [DOI] [PMC free article] [PubMed] [Google Scholar]
- 44.Karunakaran S., Saeed U., Ramakrishnan S., Koumar R.C., Ravindranath V. Constitutive expression and functional characterization of mitochondrial glutaredoxin (Grx2) in mouse and human brain. Brain Res. 2007;1185:8–17. doi: 10.1016/j.brainres.2007.09.019. doi:10.1016/j.brainres.2007.09.019. [DOI] [PubMed] [Google Scholar]
- 45.Deas E., Plun-Favreau H., Wood N.W. PINK1 function in health and disease. EMBO Mol. Med. 2009;1:152–165. doi: 10.1002/emmm.200900024. doi:10.1002/emmm.200900024. [DOI] [PMC free article] [PubMed] [Google Scholar]
- 46.Morimoto N., Nagai M., Miyazaki K., Ohta Y., Kurata T., Takehisa Y., Ikeda Y., Matsuura T., Asanuma M., Abe K. Induction of parkinsonism-related proteins in the spinal motor neurons of transgenic mouse carrying a mutant SOD1 gene. J. Neurosci. Res. 2010;88:1804–1811. doi: 10.1002/jnr.22341. [DOI] [PubMed] [Google Scholar]
- 47.Lee D.W., Kaur D., Chinta S.J., Rajagopalan S., Andersen J.K. A disruption in iron–sulfur center biogenesis via inhibition of mitochondrial dithiol glutaredoxin 2 may contribute to mitochondrial and cellular iron dysregulation in mammalian glutathione-depleted dopaminergic cells: implications for Parkinson's disease. Antioxid. Redox Signal. 2009;11:2083–2094. doi: 10.1089/ars.2009.2489. doi:10.1089/ars.2009.2489. [DOI] [PMC free article] [PubMed] [Google Scholar]
- 48.Israelson A., Arbel N., Da Cruz S., Ilieva H., Yamanaka K., Shoshan-Barmatz V., Cleveland D.W. Misfolded mutant SOD1 directly inhibits VDAC1 conductance in a mouse model of inherited ALS. Neuron. 2010;67:575–587. doi: 10.1016/j.neuron.2010.07.019. [DOI] [PMC free article] [PubMed] [Google Scholar]
- 49.Fiorenzo P., Mongiardi M.P., Dimitri D., Cozzolino M., Ferri A., Montano N., Trevisi G., Maira G., Battistini L., Falchetti M.L., et al. HIF1-positive and HIF1-negative glioblastoma cells compete in vitro but cooperate in tumor growth in vivo. Int. J. Oncol. 2010;36:785–791. doi: 10.3892/ijo_00000554. [DOI] [PubMed] [Google Scholar]
- 50.Frezza C., Cipolat S., Scorrano L. Organelle isolation: functional mitochondria from mouse liver, muscle and cultured fibroblasts. Nat. Protoc. 2007;2:287–295. doi: 10.1038/nprot.2006.478. doi:10.1038/nprot.2006.478. [DOI] [PubMed] [Google Scholar]
Associated Data
This section collects any data citations, data availability statements, or supplementary materials included in this article.