

Abstract
The GDI1 gene, responsible in human for X-linked non-specific mental retardation, encodes αGDI, a regulatory protein common to all GTPases of the Rab family. Its alteration, leading to membrane accumulation of different Rab GTPases, may affect multiple steps in neuronal intracellular traffic. Using electron microscopy and electrophysiology, we now report that lack of αGDI impairs several steps in synaptic vesicle (SV) biogenesis and recycling in the hippocampus. Alteration of the SV reserve pool (RP) and a 50% reduction in the total number of SV in adult synapses may be dependent on a defective endosomal-dependent recycling and may lead to the observed alterations in short-term plasticity. As predicted by the synaptic characteristics of the mutant mice, the short-term memory deficit, observed when using fear-conditioning protocols with short intervals between trials, disappeared when the Gdi1 mutants were allowed to have longer intervals between sessions. Likewise, previously observed deficits in radial maze learning could be corrected by providing less challenging pre-training. This implies that an intact RP of SVs is necessary for memory processing under challenging conditions in mice. The possibility to correct the learning deficit in mice may have clinical implication for future studies in human.
INTRODUCTION
Mental retardation (MR) is a common disorder that affects ∼2% of the human population. Symptoms appear early in post-natal life and are often associated to specific clinical features or behavioural characteristics. The cognitive defect may be often the only symptom and differential diagnosis is frequently impossible. The recent advancement in genome analysis has lead to identification of many genome abnormalities and new syndromes as well as novel single gene identification (1). Particularly fruitful has been the search for X-linked genes that have been mainly identified by systematic sequencing of familiar cases mapped to the X chromosome (http://www.ggc.org/xlmr.htm) (2). More than 30 genes have been identified in such a way and have helped to define neuronal components that seem to be more often associated to MR. Many synaptic proteins and transcription factors have been found among the X-linked genes for MR, largely indicating some of the pathways that may be primarily affected in the alteration of the cognitive functions. Among the X-linked non-specific mental retardation (XLMR) genes, GDI1 that encodes αGDI, one of the proteins controlling the activity of the small GTPases of the Rab family, pointed to an involvement of intracellular traffic pathways in synaptogenesis and synaptic function (3). Along the same line is the finding of mutations in Rab3 p130 GAP gene in Warburg Micro syndrome (4) and Martsolf syndrome (5), severe autosomal recessive disorders characterized by developmental defects and MR, and the Rab3a (6–8) and RIM1α-deficient mice (9) that present synaptic vesicle (SV) defects and cognitive deficits. Still however little is known of the fine molecular pathways involved and studies of mouse models carrying mutations in known genes for MR may help in this direction.
We have previously reported the construction of mice carrying a deletion of the Gdi1 gene (10). The mutants were viable and fertile and did not present visible morphological or neuropathological alterations. However, the lack of Gdi1 in mice impaired hippocampus-dependent short-term memory formation as well as greatly reduced mouse male aggression and modified their social interaction pattern. The finding of short-term memory defects, frequently associated to MR in human and the presence of behavioral alterations, also characteristic of MR, indicated that the Gdi1 knock-out (KO) represents a good model to study human MR and particularly to define the intracellular trafficking pathway(s) altered by lack of Gdi1.
The role of αGDI is to bind Rab GTPases in their GDP-bound inactive form, to retrieve them from membranes, and to maintain a soluble pool of inactive proteins ready to be reused (3). More than 60 Rab proteins have been described in humans, some are ubiquitous; others have a regulated expression, tissue or developmental specific. Each Rab has a characteristics subcellular distribution and they appear to serve as determinant of organelle identity as well as to recruit specific effectors molecules on target membranes (11,12). Biochemical analysis of Rab GTPases in the brain of Gdi1 KO mice revealed the expected increase in the membrane-bound form of many of the Rab proteins that could be studied (10). However, the alteration in the balance between membrane-bound and soluble form was particularly visible only for Rab GTPases involved in endosomal traffic, Rab4 and Rab5 whose amount and intracellular distribution appeared highly altered in brain extracts of the KO mice. The most abundant Rab GTPase in brain, Rab3a, involved in SV exocytosis (13), was not greatly affected by lack of αGDI, and the ubiquitous form of GDI, βGDI, was also not up-regulated (10). Altogether, the data suggested that lack of αGDI could affect mainly some of the Rab proteins in brain, and that GDI-dependent membrane detachment did not seem to be an important step in many Rab proteins function.
Despite the pleiotropic effect that lack of Gdi1 could cause, and the changes in the relative distribution of many Rab proteins in the mutants, the preliminary electrophysiological analysis suggested that synaptic transmission was not greatly affected. Here we show that Gdi1 KO hippocampal synapses present a large decrease in the reserve pool (RP) of SVs that did not affect long-term potentiation (LTP) but resulted in a slow SV recovery after SV depletion. The latter defect leads to a slow recovery from synaptic depression, and may cause the short-term memory deficit in mice. In support of the hypothesis we show that memory formation in Gdi1 KO mice depends from the training protocol used and may just be a question of the time allowed to process and store information.
RESULTS
Gdi1 KO mice suffer from a massive reduction in SV density
Synapses in stratum radiatum of CA1 were analyzed by electron microscopy (EM) in Gdi1 KO and wild-type (WT) mice at post-natal day (P) 10, P23 and as adults at P90. Gdi1 KO mice showed a massive depletion of SVs in synaptic terminals at P90 when compared with WT mice (Fig. 1A). All synapses analyzed were similarly affected and no difference between excitatory (asymmetric) and inhibitory (symmetric) synapses could be detected.
Figure 1.
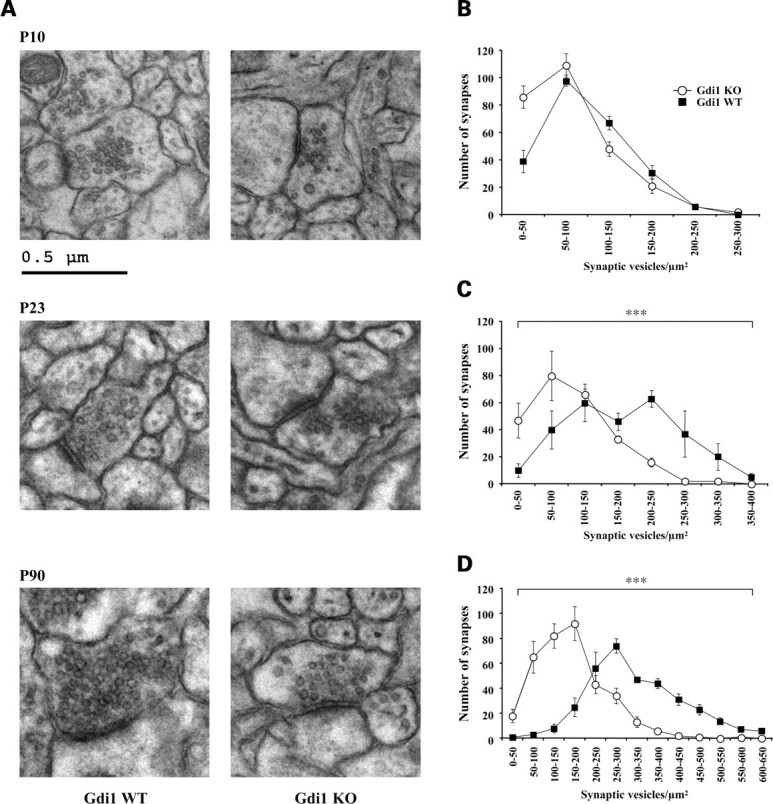
Altered distribution of SV density during synaptogenesis in hippocampal CA1 synapses of Gdi1 mutant mice. (A) Representative electron micrograph of synaptic contacts in the stratum radiatum of the CA1 region of the hippocampus from WT mice (left) and Gdi1 KO mice (right) at post-natal developmental stages indicated. Note the progressive depletion of SVs far away from active presynaptic zone of KO axon terminals over post-natal development. Bar, 0.5 µm. (B–D) Distributions of SVs density (SV number/μm2) per synapses of the stratum radiatum of the CA1 region of the hippocampus. The values of SV density were divided into bins of 50 SVs/μm2 and the mean number (±SEM) of sampled axon terminals falling into each bin were plotted as histogram profiles for WT and Gdi1 KO mice. Data are the result obtained from the analysis of 25 EM images randomly sampled for each animal at the different developmental stages. (B) P10 WT (n = 3; 241 synapses) and KO (n = 3; 272 synapses); (C) P23 WT (n = 3; 280 synapses) and KO (n = 3; 278 synapses); (D) P90 WT (n = 4; 342 synapses) and KO (n = 4; 357 synapses). ***P < 0.001, Mann–Wihitney U-test KO versus WT.
To quantify the changes in SV density during synapse development, 240– 350 synapses were counted at all developmental stages for each genotype. The results of the morphometric analysis are shown in Table 1 and Fig. 1B–D. The reduction in SV density in Gdi1 KO terminals was significant at P23 and at the adult stage P90. The distributions of synaptic density were significantly shifted towards synapses containing less SVs (Mann–Whitney U-test; P23 and P90, KO versus WT, P < 0.0001, both age levels). The average SV density was reduced to 42 and 50% of that of WT mice at P23 and P90, respectively. At P10 a small and not significant decrease of 20% in SV density could be ascribed to a 50% increase of the number of synapses containing less than 50 SVs. No differences could be detected in the average synaptic area or in the active zone (AZ) length (Table 1). Similar reduction in SV density was found in the somatosensory cortex terminals (data not shown).
Table 1.
Morphometric analysis of synaptic ultrastructure in the stratum radiatum of the hippocampal CA1 region
| P10 |
P23 |
P90 |
||||
|---|---|---|---|---|---|---|
| WT | KO | WT | KO | WT | KO | |
| No. of mice analyzed | 3 | 3 | 3 | 3 | 4 | 4 |
| No. of synapses analyzed | 241 | 272 | 281 | 246 | 342 | 357 |
| Synapses area (μm2) | 0.239 ± 0.009 | 0.234 ± 0.007 | 0.141 ± 0.005 | 0.128 ± 0.002 | 0.192 ± 0.007 | 0.201 ± 0.007 |
| AZ length (μm) | 0.219 ± 0.005 | 0.210 ± 0.005 | 0.182 ± 0.005 | 0.162 ± 0.004 | 0.174 ± 0.003 | 0.175 ± 0.003 |
| SV density (SV/μm2) | 97 ± 3.18 | 79 ± 3.23 | 183 ± 4.8 | 105 ± 4.3 | 332 ± 6.4 | 164 ± 4.4** |
Statistical analysis was performed using the unpaired Student’s t-test KO versus WT. **P < 0.01.
Since SV seemed to cluster near the AZ, we analyzed the number of SVs at progressively larger distance from the AZ, as described in Materials and Methods (Fig. 2A). The number of docked SVs, 0–50 nm from the AZ (Fig. 2A) or manually counted (Fig. 2B), was unchanged. The same was found for SVs within 200–250 nm from the AZ (Fig. 2A). Highly statistical significant differences between WT and Gdi1 KO synapses were observed at distances ≥250 nm from the AZ (Mann–Whitney U-test KO versus WT, P = 0.0003) (Fig. 2A). The ratio between the number of SVs in KO and WT synapses decreased sharply to about 5.5 times less SVs in KO mice (mean ± SEM: 13.2 ± 2.9) when compared with WT mice (mean ± SEM: 73.5 ± 22.2) synapses at 500 nm from the AZ (Fig. 2A). Thus, the morphometric analysis indicates that the lack of αGDI markedly impaired the RP of SVs, while it left the readily releasable pool (RRP) relatively unaffected.
Figure 2.

Gdi1 mutant mice showed altered SV reserve pool. (A) Distribution of absolute number of SVs (means ± SEM) located within successive 50 nm thick shells from the AZ was calculated, by using the Excel macro. The analysis was done from 342 synaptic terminals of P90 WT (n = 4) and 357 synaptic terminal Gdi1 KO (n = 4) mice in CA1 region of the hippocampus. ***P < 0.001, Mann–Whitney U-test KO versus WT, for the intervals between 250 and 550 nm. (B) Manually counting of docked SVs from 342 synaptic terminal of P90 WT (n = 4) and 357 synaptic terminal Gdi1 KO (n = 4) mice hippocampus and plotted as means (±SEM).
The total amount of SV proteins is not altered in Gdi1 KO mice
To establish whether the SV proteome was altered by the mutation, integral SV proteins, Rab3a interacting proteins, proteins involved in SV exocytosis and recycling and Rab GTPases were analyzed by western blot in enriched SV membrane fraction (LP2) and synaptosolic (LS2) fractions, from total brain or hippocampus of WT and Gdi1 KO animals (Fig. 3). Equal amounts of proteins were fractionated by SDS-PAGE and the amount of each SV protein tested was quantified by immunoblotting and normalized to the amount of ERK1,2. Surprisingly, none of the proteins analyzed except for Rab proteins were altered in mutant SV fractions. The amount of Rab3a was similar in both the LP2 and LS2 fractions as previously reported (10). The levels of the soluble forms of the endosomal Rab proteins Rab4 and Rab5 were decreased in the LS2 fraction (Rab4 mean ± SEM: WT = 1.08 ± 0.2 and KO = 0.41 ± 0.06; Rab5: WT = 0.2 ± 0.14 and KO = 0.03 ± 0.03). The membrane-associated form was increased in the LP2 fraction (Rab4: WT = 2.8 ± 1.19 and KO = 3.46 ± 1.95; Rab5: WT = 1.25 ± 0.7 and KO = 1.91 ± 0.97), confirming the previous results (10) (Fig. 3).
Figure 3.
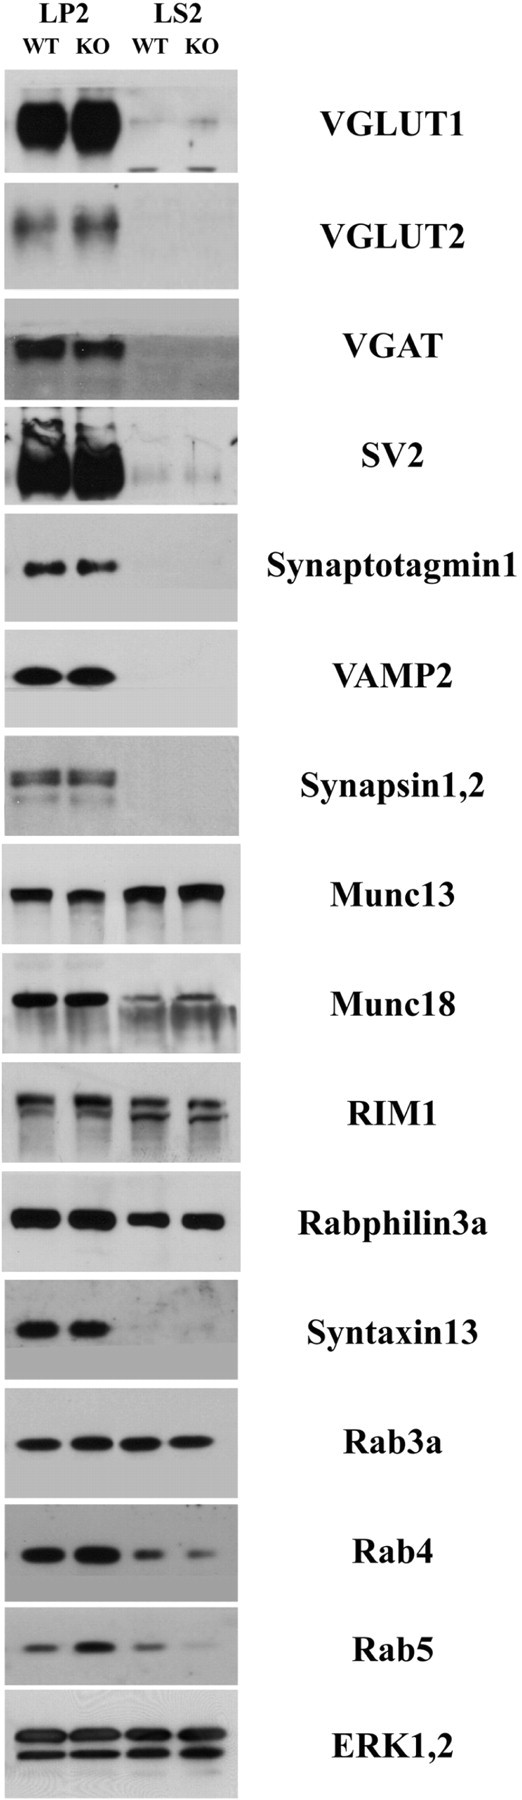
Analysis of SV and Rab proteins in nerve terminal fractions of wild-type and Gdi1 mutant mice. Crude SV fractions (LP2) and synaptosol (LS2) prepared from total brain of WT (n = 3) and Gdi1 KO (n = 3) P90 mice were analyzed by SDS-PAGE and immunoblotting. A battery of antibodies (listed in Supplementary Material, Table S1) against SV proteins, Rab3a interacting proteins, exo- and endocytosis markers and Rab proteins, and ERK1,2 to normalize the total amount of proteins loaded, were used. A difference between genotypes was observed for Rab4 and Rab5 (LP2 fraction: Rab4: WT = 2.8 ± 1.19 and KO = 3.46 ± 1.95; Rab5: WT = 1.25 ± 0.7 and KO = 1.91 ± 0.97; LS2 fraction: Rab4: WT = 1.08 ± 0.2 and KO = 0.41 ± 0.06; Rab5: WT = 0.2 ± 0.14 and KO = 0.03 ± 0.03). VGLUT, vesicular glutamate transporter; VGAT, vesicular GABA transporter; SV2, SV protein-2.
Short-term plasticity and recovery from synaptic depression are altered in Gdi1 KO mice
Previous data from Gdi1 null mutants indicated that short-term plasticity was affected in Gdi1 KO mice, while long-term plasticity appeared normal (14). Moreover, it was observed that a 30 s train of pulses at 5 Hz was followed by a pronounced post-tetanic depression that suggested depletion of the SV pools in the mutant mice (10). To better define the characteristics of synaptic plasticity in Gdi1 KO mice, we analyzed paired-pulse facilitation (PPF), post-tetanic potentiation (PTP) and synaptic depression at excitatory synapses of the CA1 region of the hippocampus.
Extracellular field excitatory postsynaptic potential (fEPSP) were recorded in the stratum radiatum of the CA1 region of acute hippocampal slices collected from adult mice by stimulating the Schaffer collateral pathway. The post-synaptic component of the field potential was totally inhibited by the addition of 6-cyano-7-nitroquinoxaline-2,3-dione (CNQX) (10 µm), which isolated the fast fiber volley spike due to the activation of voltage-gated Na+ channels, while the successive application of tetrodotoxin (TTX) (1 µm) completely suppressed the fiber volley wave (Supplementary Material, Fig. S1A). Fibers volley amplitudes were monitored in both experimental groups to ensure stable field potential recordings and showed a similar long-lasting stability in the number of recruited afferent fibers by the extracellular stimulation in both WT and Gdi1 KO slices (Supplementary Material, Fig. S1B).
When Schaffer collaterals pathways were stimulated by two consecutive stimuli administered at interpulse intervals ranging between 10 and 250 ms (Fig. 4A), the magnitude of PPF was significantly greater in Gdi1 KO mice than in WT littermates (Fig. 4B) at all tested time intervals. The ratio of the second to the first fEPSP slope at 50 ms interstimulus interval was 1.31 ± 0.05 (WT = 12) and 1.50 ± 0.057 (KO = 12) in WT and Gdi1 KO mice, respectively (P < 0.05; n = 12; Fig. 4B). The strongly enhanced PPF observed in mutant mice is in partial agreement with previously reported results, which reported a PPF increase limited to interpulse intervals shorter than 50 ms (14). This result is compatible with either lower release probability, larger build-up of Ca2+ ions, or higher rate of fast SV recycling mechanisms.
Figure 4.
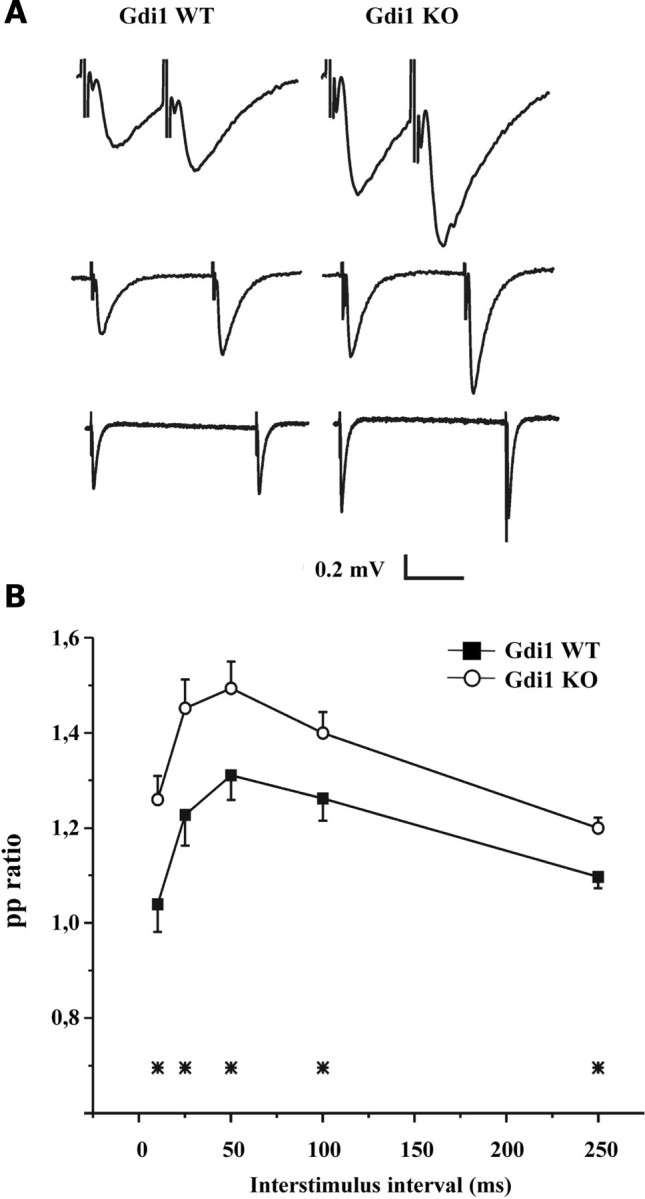
Gdi1 mutant mice show enhanced PPF. (A) fEPSPs recorded from the stratum radiatum of the hippocampal CA1 region of WT (left traces) and Gdi1 KO (right traces) mice in response to paired stimuli delivered to the Schaffer collateral commissural pathway at 10 (top traces), 50 (middle traces) and 250 (bottom traces) ms interstimulus intervals (time scale: 10, 35, 125 ms) in the presence of 100 µM D-AP5 and 10 µM CGP. (B) Mean (±SEM) paired-pulse (PP) ratios of the second to the first fEPSP slope in WT (n = 12) and Gdi1 KO (n = 12) mice are plotted as a function of the interstimulus interval. PP ratios were significantly different between the two groups at all tested interstimulus intervals (*P < 0.05, unpaired Student’s t-test).
To evaluate synaptic depression, the Schaffer collateral pathway was stimulated with a train of 300 stimuli delivered at a frequency of 10 Hz. The progressive change in fEPSP slope ratio during the train and the subsequent recovery from depression, obtained by returning the stimulation frequency to 0.1 Hz, were compared in WT and mutant slices. In WT mice, the long-lasting repetitive stimulation elicited an initial moderate facilitation of 130 ± 9% with respect to basal transmission before the train followed by a decremented phase that reached a depression of 42.5 ± 4.5% at the end of the stimulation train (Fig. 5A). In contrast, Gdi1 KO synapses displayed a larger facilitation during the initial phase of tetanic stimulation (174 ± 11%) and a subsequent depression characterized by a kinetic similar to that observed in WT synapses. At the end of the train, Gdi1 KO synapses reached a milder depression plateau of 60.6 ± 8.3% (P < 0.05 KO versus WT; n = 9 for both WT and KO slices; Fig. 5A). The initial larger facilitation observed in Gdi1 KO slices is similar to what we observed in the PPF and the milder depression is likely due to the more intense facilitation observed at the beginning of the train.
Figure 5.
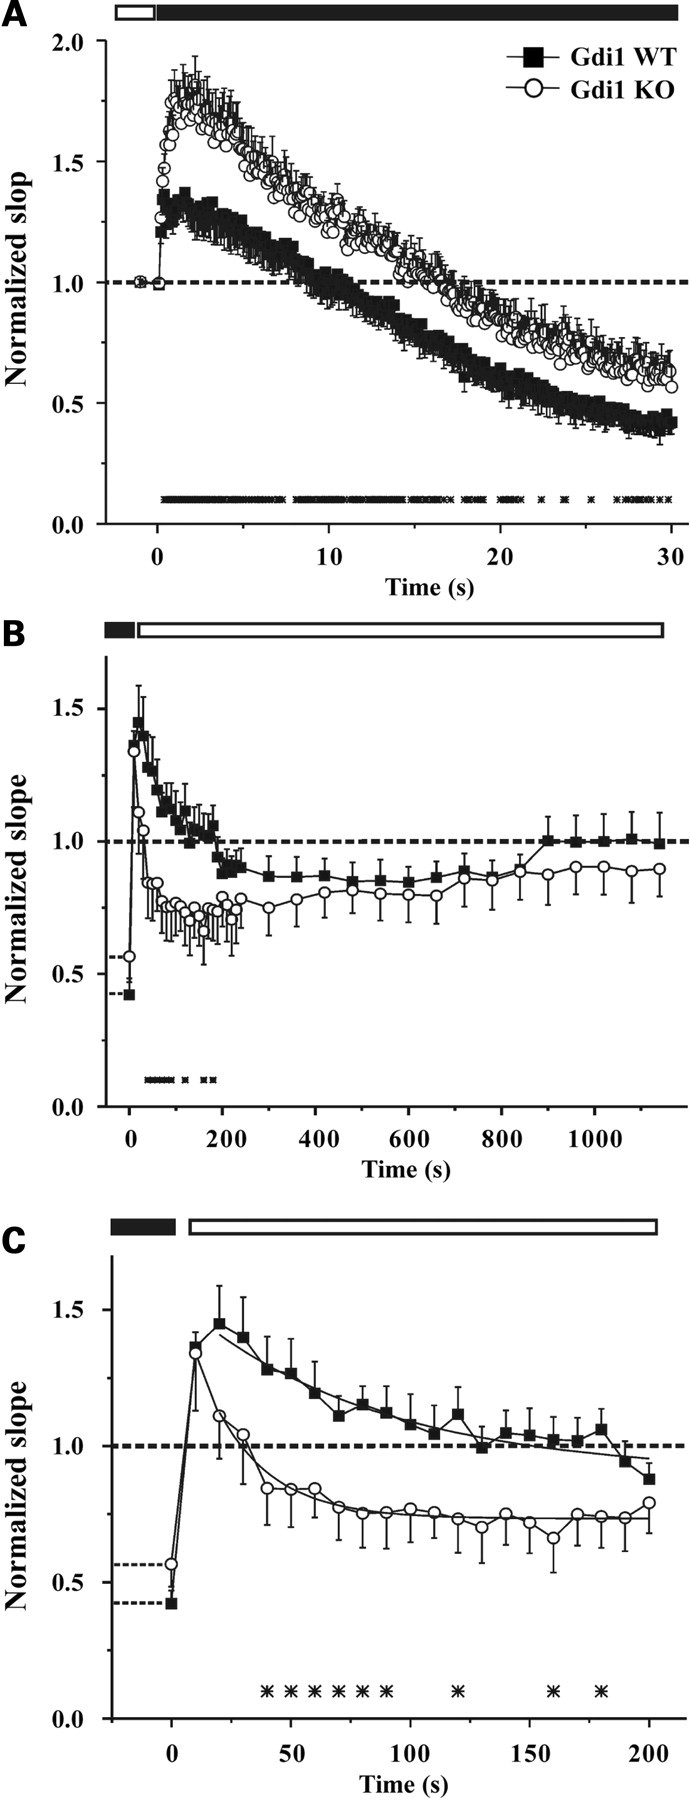
Depression and recovery from depression are altered in Gdi1 mutant neurons subjected to high-frequency stimulation. (A) fEPSP normalized relative to the baseline, was plotted as means ± SEM versus time during repetitive stimulation at 10 Hz for 30 s (n = 9 for both WT and KO slices). (B) The recovery from depression was analyzed by lowering the stimulation frequency from 10 to 0.1 Hz. The time-course of recovery was studied for 20 min after the end of the train in WT (n = 8) and KO mice (n = 7). (C) In an expanded time scale, a detail of the first 3 min of the recovery phase shown in (B) reveals that PTP lasted 2 min in WT slices, while it was rapidly lost and replaced by a phase of depression in KO slices. The time course of the PTP loss was fitted using the monoexponential function: y = yo + A1 × exp(−t/t) yielding the following values: t = 60.76 ± 10 and 19.36 ± 4.7 s. In all panels, the differences between the two genotypes were significant at the time points marked with asterisks (*P < 0.05, unpaired Student’s t-test).
When the stimulation frequency was returned to 0.1 Hz both WT and Gdi1 KO synapses revealed a similar extent of PTP (136 ± 5.4 and 134 ± 21% in WT and KO mice, respectively), a transient increase in synaptic strength caused by Ca2+ accumulation within the presynaptic terminal (15). In WT mice, the PTP phase lasted for 2 min and was slowly and progressively replaced by a moderate depression phase lasting 11 min and reaching a depression plateau of 85.6 ± 6.7% (Fig. 5B). On the contrary, PTP lasted <30 s in Gdi1 KO mice, and was soon replaced by a phase of intense depression that reached a plateau level of 71.3 ± 12%, 3 min after the end of the train (P < 0.05 KO versus WT; n = 7 and n = 8 for WT and KO mice, respectively; Fig. 5B). The fitting of the first 3 min of the recovery phase with a monoexponential curve revealed a faster decay of the PTP phase in KO slices (t = 60.76 ± 10 and 19.36 ± 4.7 s for WT and KO mice, respectively; Fig. 5C). This effect could be the consequence of the strong SV depletion observed in the KO synapses by EM, which alter the SV recruitment from the RP.
Glutamate release in response to KCl is decreased in Gdi1 KO synaptosomes
To better define the release properties of the Gdi1 KO mice, release experiments were conducted in hippocampal synaptosomes purified from adult mice and exposed to KCl, known to evoke voltage-gated Ca2+-channel-dependent release (16,17). Synaptosomes were purified from the hippocampus of Gdi1 KO and WT mice and exposed in superfusion to KCl, to monitor the stimulus-evoked overflow of endogenous glutamate. During the first 36 min of superfusion with standard medium the spontaneous outflow asymptotically diminished to a constant level; a 90 s exposure to the stimulus at t = 39 min produced a transient increase of neurotransmitter release that soon returned to the basal levels (Supplementary Material, Fig. S2A). The release induced by 50 mm KCl appeared only partly dependent on external Ca2+, as reported for rat brain synaptosomes (18,19) (Supplementary Material, Fig. S2B).
Evoked glutamate release from hippocampal synaptosomes was directly related to the strength of the applied stimulus. As shown in Fig. 6A, glutamate overflow elicited by 15 mm KCl was significantly reduced by ∼30–40% in mutant synaptosomes with respect to WT synaptosomes. However, when higher KCl concentrations (50 mm) were used, the glutamate overflow was similar in WT and KO synaptosomes (Fig. 6A). We also measured the extent of glutamate release in response to three sequential depolarizing pulses of 15 mm KCl applied at 9 min interpulse intervals (Fig. 6B). Consistent with previous reports (20), glutamate overflow from WT synaptosomes progressively decreased in response to sequential stimuli, as a result of the SV depletion from RRP. Interestingly, glutamate overflow from KO synaptosomes was significantly less depressed after repetitive pulses (Fig. 6B). The lower release of glutamate from purified KO synaptosomes in response to KCl stimulation suggest a change in release probability that does not depend on the number of docked SV in the RRP, which is in fact unchanged in the mutants.
Figure 6.
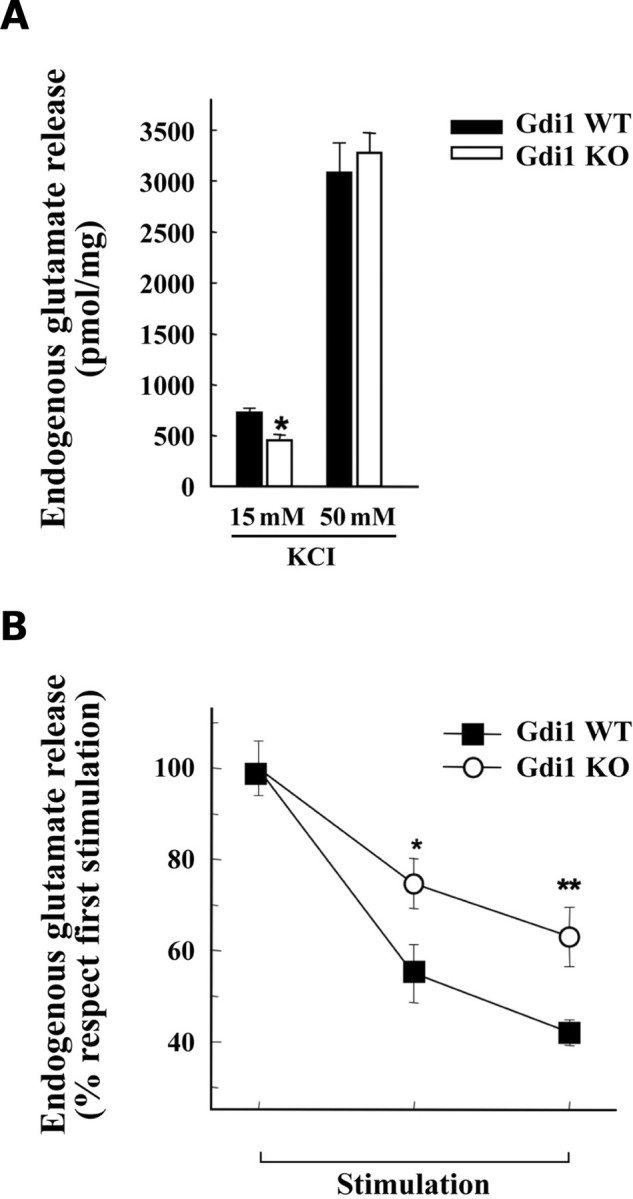
Glutamate release in response to KCl is impaired in Gdi1 KO synaptosomes. (A) Synaptosomes purified from adult WT (n = 12) and KO (n = 12) mice were depolarized with either 15 or 50 mm KCl and the stimulus-evoked overflow of glutamate was expressed in pmol of endogenous glutamate/mg protein. Bars are means ± SEM of six independent experiments. *P < 0.05, Student’s t-test KO versus WT synaptosomes. (B) KCl evokes release of glutamate during repetitive stimulation. Synaptosomes were stimulated with three sequential pulses of 15 mm KCl for 90 s administered at interpulse intervals of 9 min and the spontaneous or evoked release of endogenous glutamate was monitored. Glutamate overflow evoked by each pulse, expressed in percent of the release evoked by the first stimulus, is plotted as means ± SEM for WT and KO synaptosomes (n = 6 independent experiments run in triplicate). *P < 0.05; **P < 0.01; unpaired Student’s t-test KO versus the respective release value in WT synaptosomes.
Deficits of Gdi1 mutant in trace fear conditioning is corrected by applying longer intertrial intervals during training session
We previously showed that Gdi1 KO mice were impaired in forming association between the conditioning stimulus (CS) and an unconditioned stimulus (US) in the trace fear-conditioning test in which mutants were trained with five trials separated by short intertrial interval (ITI) of 148 s (10). To assess whether the ITI duration plays a key role in associative memory formation in Gdi1 KO mice, we modified the training protocol. Four sets of Gdi1 KO and WT male mice littermates were subjected to trace fear conditioning using five trials separated by 15, 26, 37 or 60 min ITI, as showed in Fig. 7A–H.
Figure 7.
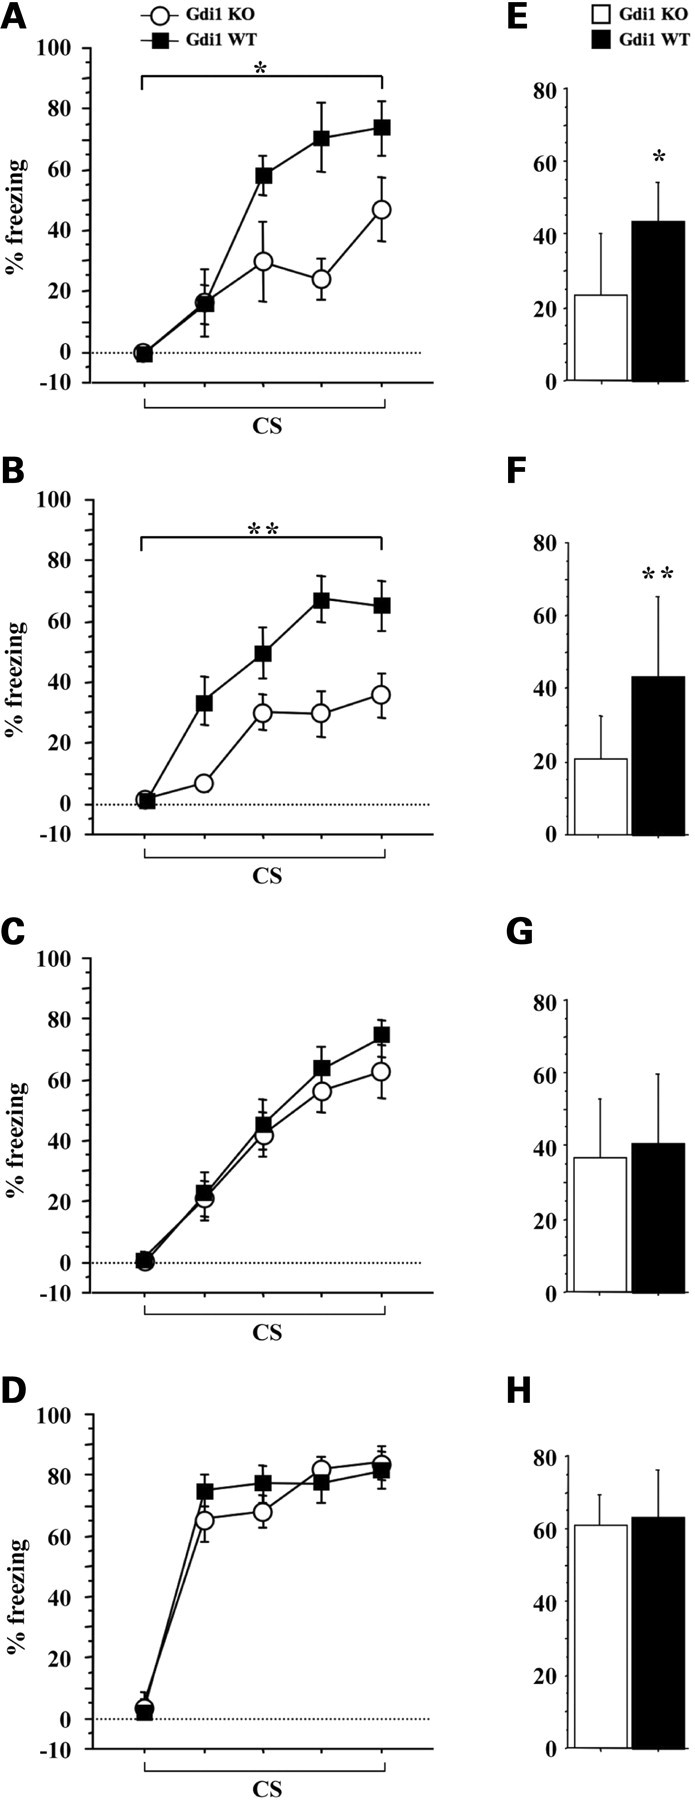
Gdi1 mutant mice learn normally in trace fear conditioning with spaced trials protocols. Gdi1 KO and WT mice were subjected to trace fear-conditioning training (A–D) by using four different ITI. (A) KO (n = 6) and WT (n = 7) animals, ITI=15 min; (B) KO (n = 17) and WT (n = 18) animals, ITI=26 min; (C) KO (n = 17) and WT (n = 17) animals, ITI = 37 min; (D) KO (n = 16) and WT (n = 15) animals, ITI = 60 min. (A–D) average percentage of freezing during bins of 15 s CS presentation, during the training session; (E–H) average percentage of freezing during 2 min memory test for context 24 h after training. Data in the plots represent the mean percentage of freezing (±SEM) for WT and Gdi1 KO mice. *P < 0.05; **P < 0.01; ANOVA KO versus WT.
Using 15 and 26 min ITI, Gdi1 KO mice froze significantly less than WT mice when the CS was presented during the conditioning sessions (Fig. 7A and B). Three-way ANOVA showed that the two ITI were equivalent (ITI: F[1,44] = 0.07, P = 0.78). In both protocols, the percentage of freezing over the five CS tones presentation increased in both WT and Gdi1 KO mice during the conditioning session (CS effect: F[4,184] = 49.5, P < 0.0001). Significant differences between genotypes were observed for freezing in the training session (set 1 genotype effect: F[1,11] = 13.9, P = 0.02; Fig. 7A and set 2 genotype effect: F[1,33] = 6.94, P = 0.007; Fig. 7B), as well as during the memory context test 24 h later (set 1 genotype effect: F[1,11] = 5.27, P = 0.04; Fig. 7E and set 2 genotype effect: F[1,33] = 8.4, P = 0.006; Fig. 7F). No significant difference between genotypes was observed for the tone test (set 1 genotype effect: F[1,11] = 0.74, P = 0.4 and set 2 genotype effect: F[1,33] = 2.19, P = 0.14; data not shown).
In contrast, using 37 and 60 min ITI, no differences were observed between mutant and control animals. Three-way ANOVA showed that the two ITI were equivalent (ITI: F[1,61] = 0.08, P = 0.77). No significant differences between genotypes were observed when animals were tested for freezing in the training session (set 3 genotype effect: F[1,32] = 0.44, P = 0.5; Fig. 7C and set 4 genotype effect: F[1,29] = 0.22, P = 0.6; Fig. 7D), to context (set 3 genotype effect: F[1,32] = 0.92, P = 0.3; Fig. 7G and set 4 genotype effect: F[1,29] = 0.01, P = 0.9; Fig. 7H) and tone (set 3 genotype effect: F[1,32] = 1.37, P = 0.2 and set 4 genotype effect: F[1,29] = 0.21, P = 0.6; data not shown), suggesting that KO mice had an intact associative fear-related memory. These results indicate that, when ITI between each CS–US pairing is increased to more than 30 min, the mutant mice perform as well as the WT littermates in associating CS and US.
Gdi1 mutant mice display normal working memory in the radial maze task when memory processing is facilitated
We have previously shown that Gdi1 KO mice are impaired in working memory formation when tested in the eight-arm radial maze test (10). Following the results of the fear-conditioning tests, we asked whether it would be possible to reverse the mutant phenotype also in the radial maze by pre-training mice in an ‘easier set-up’, such as in a four-arm radial maze, and 24–48 h after, testing them on the eight-arm maze. In the eight-arm radial maze test, the genotype differences in the number of correct choices before the first error (genotype effect for Day 9–10: F[1,50] = 16.23, P = 0.0002) and in the number of errors (genotype effect: F[1,50] = 0.9, P = 0.3) (KO = 29 and WT = 29) were in full agreement with the previously published results (10). When mice were subjected to the four-arm radial maze test, KO and WT animals (KO = 37 and WT = 35) did neither differ in the number of correct choices before the first error (genotype effect: F[1,64] = 0.06, P = 0.8; Fig. 8A) nor in the number of errors (genotype effect: F[1,64] = 0.008, P = 0.9; Fig. 8D). Interestingly, a significantly different performance was observed in Gdi1 KO mice depending on whether they were subjected to the eight-arm radial maze 24 or 48 h after the four-arm test. When the eight-arm test was performed 24 h after the four-arm test, Gdi1 KO mice were impaired in patrolling the maze as indicated by the number of correct choices before the first error (genotype effect: F[1,35] = 6.23, P = 0.01; Fig. 8B), thought to be a working memory-dependent feature. No difference was observed in the number of errors (genotype effect: F[1,35] = 2.8, P = 0.1; Fig. 8E). On the other hand, when the eight-arm test was performed 48 h after the four-arm test, no significant difference in the number of correct choices before the first error (genotype effect: F[1,27] = 0.09, P = 0.7; Fig. 8C) as well as in the number of errors (genotype effect: F[1,27] = 0.1, P = 0.7; Fig. 8F) was observed between the two genotypes. These results suggest that Gdi1 KO mice are impaired in forming working memory traces if the time to process memory information is too short, in agreement to what was found in the trace fear-conditioning paradigm.
Figure 8.

Gdi1 mutant mice display a normal working memory in the eight-arms radial maze task when memory processing is facilitated. Gdi1 KO and WT mice were tested in the radial maze test as described in Materials and Methods. (A–C) Learning performance (means ± SEM) is expressed as the mean number of correct arm choices before the first error. (D–F) Mean number of errors (±SEM) until eight correct choices were made. (A and D) Four-arm radial maze (WT = 35 and KO = 37); (B and E) eight-arm radial maze tested 24 h after the four-arm radial maze (WT = 20 and KO = 22); (C and F) Eight-arm radial maze tested 48 h after the four-arm radial maze (WT = 15 and KO = 15). *P < 0.05; ANOVA KO versus WT.
DISCUSSION
In this study, we describe a complex phenotype associated with the deletion of Gdi1 gene in mice and we suggest that alterations in the SV pool and short-term synaptic plasticity could be caused by alterations of different trafficking pathways controlled by several Rab proteins. Some of the observed defects account for the hippocampus-dependent short-term memory deficit as previously described (10).
Paired-pulse facilitation is increased in the mutants and extends to a wide range of interpulse intervals up to 250 ms. The increase is wider than previously reported in an independently generated Gdi1 KO strain (14), possibly due to the different genetic background, a pure C57Bl6/N in our case. The increase in PPF may be caused by several reasons, from a lower release probability to a larger build-up of Ca2+ ions or a higher rate of fast SV recycling. The finding of a lower release of glutamate from purified synaptosomes in response to KCl stimulation points to a change in release probability in the mutant mice. As the number of docked SV appears unchanged in the mutants and the major protein components of the SVs are identical in WT and KO animals, the increase in PPF is likely due to alteration of the SV-associated Rab GTPases.
The best candidate is the most abundant Rab protein of SVs, Rab3a. Rab3a-deficient mice as well as mice carrying mutations or deletions of the Rab3a interacting proteins, RIM1α and Rab3 p130 GAP subunit, showed similar responses to PPS and short high-frequency trains of action potentials, with a large decrease in release probability (9,21–23). RIM1α is a multidomain AZ protein of the presynaptic terminals that binds to Rab3a on SVs and could be one of the proteins that cooperate with Rab3a in SV tethering. The Rab3 p130 GAP KO mice lack the catalytic subunit of the Rab3 GTPase-activating protein, and accumulate the GTP-bound form of Rab3a on membranes, similarly to the over expression of the GTPase-deficient mutant Rab3a (24), resulting in a decreased SVs recycling and rate of exocytosis (22). Alterations in all the above proteins do not seem essential for synapse formation, but they seem to be required for regulated synaptic transmission. In agreement with published data, our results suggested that lack of αGDI may alter the ratio between active GTP-Rab3a and inactive GDP-Rab3a on the SV membrane, limiting the ability of Rab3a to associate and/or dissociate from RIM1α, or other effectors and reducing Ca2+-triggered vesicle exocytosis. The state of the different forms of Rab3a in Gdi1 KO mice needs to be better defined, but the absence of a common behavioural and cognitive deficit among the different mouse mutants suggests that the putative alteration in Rab3a cannot be responsible for the Gdi1 cognitive alteration. Then, the putative regulation of Rab3a by αGDI needs to be reconsidered, as previously suggested (7).
The Gdi1 KO mice also presented a severe depletion of SV, detectable at early steps of synapse development (at P10 in the hippocampus) and significantly increased in adulthood. In adult hippocampus the reduction was limited to the distal SVs, possibly those in the RP, and did not affect the docked SVs or the vesicles within 200 nm from the AZ. The reduction in SV did not alter LTP following theta-burst tetanus in the CA1 region of the hippocampus nor in the basolateral amygdala (10,14) but, as expected, it was associated to a decrease in PTP and a delayed recovery of synaptic transmission after depression.
Efficient recycling of SVs is required to sustain the high-frequency synaptic transmission observed at synapses, and to maintain structural and functional integrity of the SV and presynaptic membrane compartments. Multiple mechanisms of SV recycling have been proposed (25). While kiss-and-run and direct endocytosis account for most of SV recycling under normal activity conditions (26,27), SV recycling in response to stimuli that deplete the RP, result in slow endocytosis which requires endosomal sorting of SV components, in line with the fact that SVs are highly enriched in endosomal proteins (27,28). Such a slow pathway, involving endocytic buds and the adaptor protein AP3 is specifically involved in compensatory endocytosis providing refilling of the RP of SV after its depletion during sustained high-frequency stimulation (28,29), it may be affected in the Gdi1 KO.
The observed alterations of Rab5 and Rab4 partitioning in the SV subcellular fractions of the mutants could account for a less efficient endosomal recycling under high-frequency stimulation. Several data suggest an active participation in SV biogenesis and recycling as well as in presynaptic function of the Rab5 and Rab4 GTPases, which regulate transport to and from early endosomes (EEs) in non-neuronal cells, respectively (30,31). Rab4 has been found to regulate the formation of synaptic-like microvesicles from EEs in PC12 cells (32), suggesting its potential involvement in SV recycling. Rab5, which is also associated with SVs (33,34), appears to be essential for creating and maintaining a SV population of uniform size by preventing homotypic fusion (35) and is required for the targeting of several SV proteins to presynaptic clusters (36). Moreover, in Drosophila neuromuscular synapses, impaired Rab5 function-disrupted presynaptic EE integrity, decreased the SV recycling pool size and affected synaptic efficacy (37). Interestingly, in this study the probability of release was decreased and PPF was increased in the absence of changes in the number of docked SVs (37), reminiscent of the changes in facilitation observed in the Gdi1 KO mice. In addition, perturbations of Rab5 function in hippocampal neurons impaired exocytosis and markedly reduced the recycling pool size (24). These data indicate that a defective EE passage required to retrieve SVs under periods of intense activity and to control the SV protein/lipid composition due to malfunction of endosomal Rabs, may lead to perturbation of SV recycling. Importantly, an endosomal step is likely to be involved also in biogenesis of mature SVs, as SV precursors transported to nerve terminals are believed to become mature and competent SVs after a first round of constitutive exocytosis/endocytosis and maturation through endosomal sorting of SV components (38).
In conclusion, lack of αGDI seems to perturb the functionality of different SV pools at the presynaptic site and may be due to alterations of at least two different classes of Rab GTPases, Rab3a and the endosomal Rab proteins. However, we cannot exclude that both contribute to a general alteration of the SV and of associated proteins, leaving the integral SV proteins unaltered in the mutants. A detailed study of the SV proteome may help in better defining the organization of the SV in the Gdi1 mutants and its role in SV recycling.
Gdi1 KO mice showed a specific short-term memory deficit, leading to a reduced ability to memory consolidation and long-term memory formation. Robust learning and memory can be more effectively produced by repeated trials when they are spaced in time rather than massed (i.e. applied in short intervals), a phenomenon known as the trial spacing effect (39). Although the trial spacing effect has been studied at the behavioral level, its underlying molecular mechanisms remain unclear. The intense synaptic depression in Gdi1 mutants after repetitive electrical stimulation of the CA1 region of the hippocampus lasted >20 min in our experimental conditions. This suggested to us that the defective SV recycling might be responsible for the cognitive deficit during the massed training learning protocols and that might be corrected by using more spaced and less challenging training protocols. We were indeed able to rescue the learning deficit in both trace fear conditioning and in the eight-arm radial maze, either by using ‘spaced’ instead of ‘massed’ training protocols, or by providing appropriate pre-training, respectively.
In conclusion, we propose here that the efficiency of the SV recycling machinery is involved in the formation of a robust memory under challenging conditions. Allowing a longer period of time (spaced training) to form a memory, the impaired recycling machinery in Gdi1 mutants could be able to maintain the SV pool required for efficient synaptic transmission and short-term memory formation and processing. We realize that, as in any constitutive targeted mutation, two statistically associated phenotypic expressions might not be causally related, because of independently affected developmental pathways (pleiotropy). On the other hand, such pleiotropy characterizes most mutations causing MR syndromes in humans. In particular, the mental disability in MR is rarely absolute yet rather situation-dependent, and some deficits may be overcome by prolonged learning and use of learning aids. Given the predicted correction of a genetically dependent learning deficit in mice by simple alteration of training schedules, we believe, however, that prolonged learning and use of learning aids may overcome some cognitive deficits in mentally retarded patients.
MATERIALS AND METHODS
Gdi1 mutant mice
Gdi1 heterozygote females in a pure C57Bl6/N genetic background were crossed with C57Bl6/N male mice to obtain Gdi1 mutant and WT male mice littermates. Several generations, from N15 to N23 were used throughout. Animals housing and experimentation were done as previously described (10).
Experiments were done according to the animal protocols approved by the DIBIT Institutional Animal Care (Milan, Italy) and Use Committee and the Cantonal Veterinary Authority of Zurich (Switzerland) and were approved by the National Ministry of Health. All experiments were carried out in accordance with the guidelines established by the European Community Council Directive of 24 November 1986 on the use of animals in research (86/609/EEC). All efforts were made to minimize animal suffering and to use only the number of animals necessary to produce reliable results.
Electron microscopy
Brains of mutant and WT male mice were investigated at P10 (WT = 3 and KO = 3), P23 (WT = 3 and KO = 3) and P90 (WT = 4 and KO = 4). The animals were anaesthetized with sodium pentobarbital (80 mg/kg) and transcardially perfused with physiological saline for 30 s, and fixed in 2.5% (w/v) paraformaldehyde (Fluka, Buchs, Switzerland) and 1% (w/v) glutaraldehyde (Electron Microscopy Sciences, Hatfield, PA) in 0.1 m phosphate buffer (PB), pH 7.4. Brains were post-fixed in the same fixative overnight at 4°C. Coronal sections (90 µm thick) were cut using Vibratome 1000 (St Louis, MO, USA), extensively washed in PB, and treated with 1% osmium tetroxide in PB for 45 min. Following staining with 2% aqueous uranyl acetate for 2 h at room temperature, sections were dehydrated and flat-embedded onto slides in Durcupan ACM (Fluka). The areas for EM investigation were selected at the same rostrocaudal (RC) and mediolateral (ML) levels using the mouse brain atlas (40). Hippocampal CA1 samples were cut out from the slide at Bregma −2.20 and −2.40 mm RC, and 1.05–1.45 and 2.70–3.10 mm ML, respectively. Serial ultrathin sections were collected on pioloform-coated single-slot copper grids and examined with a CM100 electron microscope (Philips Electron Optics, Eindhoven, The Netherlands) at 80 kV. The section thickness was controlled using the Small’s minimal fold method (41); 55 ± 3 nm thick sections were singled out from series for image sampling.
Morphometric analysis
The selected section was oriented at ×700 magnification to select four random fields at least 80 µm distant, within the middle portion of CA1 stratum radiatum. Four to eight non-overlapping images at 3–5 µm distance were captured per random field at an initial ×27 500 magnification. In total, 25 images or area of 380 µm2 were sampled for each animal with Bioscan Camera 792 (Gatan, Pleasanton, CA, USA) using Digital Micrograph 2.5 software (NCMI, Houston, TX, USA). A synapse was identified by the clustering of SV and by the presence of a post-synaptic density (PSD). Synaptic profiles touching the exclusion lines were not counted. The lengths of AZ, the numbers of SVs and the areas of the axonal terminals were measured by using ImageJ software (NIH, Bethesda, MD, USA). The density of SV per axon terminal area was obtained dividing the number of SVs by the cross-section areas of the axonal terminals; the area occupied by mitochondria was subtracted from the total area of axonal terminal. The distance of each SV from the presynaptic membrane was determined by using an Excel Macro.
Western blot analysis
Six brains from P90 mice (KO = 3; WT = 3) were dissected, fractionated and analyzed as previously described (10). Antibodies are listed in Supplementary Material, Table S1.
Hippocampal slices and field recordings
Horizontal hippocampal slices were obtained from 14–16 weeks old male mice. Mice were anaesthetized with halothane (Sigma-Aldrich, Milan, Italy) and decapitated; the brain was quickly removed and immersed in an ice-cold oxygenated ‘cutting’ solution composed of (mm): 125 NaCl, 25 NaHCO3, 25 C6H12O6, 2.5 KCl, 1.25 NaH2PO4, 1 CaCl2, 2 MgCl2, 0.4 ascorbic acid, 2 sodium pyruvate, 3 myo-Inositol. The solution was saturated with 95% O2 and 5% CO2 (42). The dissected hemispheres were cut into 0.3 mm thick slices using an HM 650 V vibratome (Microm International GmbH, Walldorf, Germany). Slices were incubated in ‘cutting’ solution at 35°C for at least 1 h and then transferred into a ‘submerged’ recording chamber which was continuously superfused at a rate of ∼1.5 ml/min with the standard recording solution composed of (mm): 125 NaCl, 25 NaHCO3, 25 C6H12O6, 2.5 KCl, 1.25 NaH2PO4, 2 CaCl2, 1 MgCl2. d-2-amino-5-phosphonopentanoic acid (100 µm; Tocris Bioscience, Bristol, UK) and (3-aminopropyl) (diethoxymethyl) phosphinic acid (CGP; 10 µm; Tocris) were added in all the experiments to block N-methyl-d-aspartate and GABAB receptors, respectively. For the pharmacological characterization, CNQX (10 µm; Tocris) and TTX (1 µm; Sigma) were perfused in the recording chamber. The bath temperature was monitored and maintained at 33°C. Extracellular field potentials were recorded in the stratum radiatum of the CA1 region with a glass microelectrode (1–2 MΩ) filled with standard recording solution. Electrical stimulation (test pulses at 0.1 Hz, 0.25 ms duration, stimulus intensity fixed at 2/3 of maximal evoked EPSP amplitude) was delivered through a concentric bipolar tungsten electrode inserted into the stratum radiatum of the CA1 region (see Supplementary Material, Fig. S1). Field EPSPs were acquired by using the MultiClamp 700B (Axon Instruments, Molecular Devices, Sunnyvale, CA, USA) amplifier and the pClamp 9.2 software (Axon Instruments). The fEPSP slope was evaluated as a linear regression of the rise phase from 10 to 70% of the fEPSP amplitude (R2 > 0.9) using a proprietary program developed in an R-CRAN environment (Thierry Nieus, unpublished data). For each experiment, the ‘baseline slope’ was calculated by averaging the slope values obtained after the stimulation of the Schaffer collaterals at 0.1 Hz for 5 min. In the high-frequency repetitive stimulation protocols, data were expressed in percent of the baseline slope as means ± SEM. In the paired-pulse experiments, the fEPSP slope ratio between the second and the first stimulus was calculated. Statistical analysis was performed by using Origin 7.0 software (OriginLab Corporation, Northampton, MA, USA) and figures were edited with Corel Draw 12 (Corel Corporation, Ottawa, Canada).
Glutamate-release experiments
Mice were killed by decapitation and the hippocampi were rapidly dissected out. Percoll-purified synaptosomes were prepared as previously described (43). Synaptosomes were re-suspended in physiological medium with the following composition (mm): NaCl 125, KCl 3, MgSO4 1.2, CaCl2 1.2, NaH2PO4 1, NaHCO3 22, glucose 10 (pH 7.4 when equilibrated with 95% O2/5% CO2); and incubated at 37°C for 15 min under gentle shaking in a 95% O2/5% CO2 atmosphere. At the end of the incubation, aliquots of the suspensions were stratified onto microporous filters at the bottom of parallel superfusion chambers maintained at 37°C (Ugo Basile, Comerio, Italy) and superfused with standard medium at 0.5 ml/min (18). After 36 min of superfusion needed to equilibrate the system, samples were collected according to the following scheme: two 3-min samples (t = 36–39 min and t = 45–48 min; basal release) before and after one 6-min sample (t = 39–45 min; stimulus-evoked release). Synaptosomes were exposed to a 90 s pulse of 15 or 50 mm KCl at the end of the first fraction collected (t = 39 min) (Supplementary Material, Fig. S2). In some experiments, three successive 50 mm KCl pulses were applied to the same synaptosomal preparation separated by recovery intervals of 9 min (t = 39, 48 and 57 min). The collected fractions and superfused synaptosomes were analyzed for the endogenous glutamate content. Endogenous amino acids were measured fluorometrically by high performance liquid chromatography following pre-column derivatization with O-phthalaldehyde and separation on a C18 reverse-phase chromatographic column (44). The endogenous amino acid release was expressed as nmol/mg of protein. The stimulus-evoked overflow was estimated by subtracting the transmitter content of the two 3-min samples (basal release) from the release evoked in the 6-min sample collected during and after the depolarization pulse (stimulus-evoked release).
Trace fear conditioning
Auditory trace fear conditioning was performed as previously described (10). Briefly, mice were placed in an opaque conditioning chamber (L × W × H: 25 × 17 × 23 cm) with a grid floor through which scrambled foot shocks could be delivered as US (0.26 mA average intensity). The chamber was placed into a dimly lit (<5 lux) sound attenuating box (background noise level 55 dB), and a speaker on top of the chamber allowed to deliver sounds as CS (2000 Hz). All mice were pre-exposed to the test chamber for 10 min on the 2 days preceding conditioning. A trial started with the presentation of the CS (15 s), followed 15 s later by the presentation of the shock for 2 s. This was repeated five times with variable ITI (see later). During each trial, the frequency of freezing (absence of movements except respiration) was continuously recorded manually on a computer keyboard. Twenty-four hours after fear conditioning, mice were placed in the conditioning box again, measuring their freezing behavior without sound presentation for 2 min (‘contextual freezing’). The dependent variable was the percentage of freezing time (means ± SEM) during the exposure to the conditioning chamber. Four sets of animals were used, taken from N17 to N23 generation. The mice were tested by using training protocols with different ITI during the conditioning session: 15, 26, 37 and 60 min, respectively.
Radial maze test
Radial maze learning was done using the same apparatus and procedure as described (10). Briefly, food-deprived mice (maintained at 85% of their free-feeding weight) were adapted to the maze for 2 days and then allowed to collect food morsels from a cup at the end of each arm during ten daily trials. Three sets of animals were used, taken from N15 to N21 generation. They underwent different training protocols varying the number of open arms. Fifty-eight animals were trained for 10 days in an eight-arm radial maze according to a standard protocol (KO = 29, WT = 29). Another 72 mice were trained for six consecutive days in a four-arm radial maze (KO = 37, WT = 35). A subset of these mice (KO = 22, WT = 20) underwent, after 24 h on Day 7, further testing in an eight-arm radial maze for four days. The remaining mice underwent, after 48 h on Day 8, further testing in an eight-arm radial maze for 4 days (KO = 15, WT = 15).
For statistical analysis, the ANOVA with repeated measures was used (SAS Institute, Cary, NC,, www.statview.com). Normal distribution and homogeneity of variances among our data samples were tested with the K–S normality test and Bartlett’s test for homogeneity. Our data did not significantly differ from computed ideal variables. Main effects were verified using non-parametric tests. To test the effects of Gdi1 deficiency, we compared Gdi1 KO and WT mice littermates. To check for generation dependence of mutation effect, we include ‘generation’ as an additional between-subject ANOVA factor. No generation–genotype interactions were found, indicating that none of the reported genotype effects were generation dependent. Repeated ANOVA was used to compare genotype effect across different sessions.
SUPPLEMENTARY MATERIAL
FUNDING
This work was supported by grants from Telethon, Italy (TCP04015 to P.D., GGP030192 to D.T., GCP05134 to F.B.); Compagnia San Paolo (to P.D., P.B. and P.F.), Ministry of the University and Research (F.B. and P.B., PRIN 2006), the Fondazione Pierfranco e Luisa Mariani, Italy (to F.B.), the Swiss National Science Foundation and the NCCR ‘Neural Plasticity and Repair’ (to H.-P.L).
Supplementary Material
ACKNOWLEDGEMENTS
We thank Dr A. Menegon (DIBIT-San Raffaele Scientific Institute, Milan, Italy) and D. Ghezzi (The Italian Institute of Technology, Genoa, Italy) for the creation of the Excel Macro and Thierry Nieus (The Italian Institute of Technology, Genoa, Italy) for his invaluable help and suggestions in data analysis. Urs Ziegler provided expert help for electron microscopy, and we appreciate the technical support of Inger Drescher-Lindh and Rosmarie Lang (Institute of Anatomy, University of Zurich, Zurich, Switzerland).
Conflict of Interest statement. None declared.
REFERENCES
- 1.Raymond F.L., Tarpey P. The genetics of mental retardation. Hum. Mol. Genet. 2006;15(Spec. 2):R110–R116. doi: 10.1093/hmg/ddl189. [DOI] [PubMed] [Google Scholar]
- 2.Chiurazzi P., Schwartz C.E., Gecz J., Neri G. XLMR genes: update 2007. Eur. J. Hum. Genet. 2008;16:422–434. doi: 10.1038/sj.ejhg.5201994. [DOI] [PubMed] [Google Scholar]
- 3.Takai Y., Sasaki T., Matozaki T. Small GTP-binding proteins. Physiol. Rev. 2001;81:153–208. doi: 10.1152/physrev.2001.81.1.153. [DOI] [PubMed] [Google Scholar]
- 4.Aligianis I.A., Johnson C.A., Gissen P., Chen D., Hampshire D., Hoffmann K., Maina E.N., Morgan N.V., Tee L., Morton J., et al. Mutations of the catalytic subunit of RAB3GAP cause Warburg Micro syndrome. Nat. Genet. 2005;37:221–223. doi: 10.1038/ng1517. [DOI] [PubMed] [Google Scholar]
- 5.Aligianis I.A., Morgan N.V., Mione M., Johnson C.A., Rosser E., Hennekam R.C., Adams G., Trembath R.C., Pilz D.T., Stoodley N., et al. Mutation in Rab3 GTPase-activating protein (RAB3GAP) noncatalytic subunit in a kindred with Martsolf syndrome. Am. J. Hum. Genet. 2006;78:702–707. doi: 10.1086/502681. [DOI] [PMC free article] [PubMed] [Google Scholar]
- 6.Hensbroek R.A., Kamal A., Baars A.M., Verhage M., Spruijt B.M. Spatial, contextual and working memory are not affected by the absence of mossy fiber long-term potentiation and depression. Behav. Brain Res. 2003;138:215–223. doi: 10.1016/s0166-4328(02)00243-7. [DOI] [PubMed] [Google Scholar]
- 7.D’Adamo P., Wolfer D.P., Kopp C., Tobler I., Toniolo D., Lipp H.P. Mice deficient for the synaptic vesicle protein Rab3a show impaired spatial reversal learning and increased explorative activity but none of the behavioral changes shown by mice deficient for the Rab3a regulator Gdi1. Eur. J. Neurosci. 2004;19:1895–1905. doi: 10.1111/j.1460-9568.2004.03270.x. [DOI] [PubMed] [Google Scholar]
- 8.Yang S., Farias M., Kapfhamer D., Tobias J., Grant G., Abel T., Bucan M. Biochemical, molecular and behavioral phenotypes of Rab3A mutations in the mouse. Genes Brain Behav. 2007;6:77–96. doi: 10.1111/j.1601-183X.2006.00235.x. [DOI] [PMC free article] [PubMed] [Google Scholar]
- 9.Powell C.M., Schoch S., Monteggia L., Barrot M., Matos M.F., Feldmann N., Sudhof T.C., Nestler E.J. The presynaptic active zone protein RIM1alpha is critical for normal learning and memory. Neuron. 2004;42:143–153. doi: 10.1016/s0896-6273(04)00146-1. [DOI] [PMC free article] [PubMed] [Google Scholar]
- 10.D’Adamo P., Welzl H., Papadimitriou S., Raffaele di Barletta M., Tiveron C., Tatangelo L., Pozzi L., Chapman P.F., Knevett S.G., Ramsay M.F., et al. Deletion of the mental retardation gene Gdi1 impairs associative memory and alters social behavior in mice. Hum. Mol. Genet. 2002;11:2567–2580. doi: 10.1093/hmg/11.21.2567. [DOI] [PubMed] [Google Scholar]
- 11.Zerial M., McBride H. Rab proteins as membrane organizers. Nat. Rev. Mol. Cell Biol. 2001;2:107–117. doi: 10.1038/35052055. [DOI] [PubMed] [Google Scholar]
- 12.Bock J.B., Matern H.T., Peden A.A., Scheller R.H. A genomic perspective on membrane compartment organization. Nature. 2001;409:839–841. doi: 10.1038/35057024. [DOI] [PubMed] [Google Scholar]
- 13.Geppert M., Goda Y., Stevens C.F., Sudhof T.C. The small GTP-binding protein Rab3A regulates a late step in synaptic vesicle fusion. Nature. 1997;387:810–814. doi: 10.1038/42954. [DOI] [PubMed] [Google Scholar]
- 14.Ishizaki H., Miyoshi J., Kamiya H., Togawa A., Tanaka M., Sasaki T., Endo K., Mizoguchi A., Ozawa S., Takai Y. Role of rab GDP dissociation inhibitor alpha in regulating plasticity of hippocampal neurotransmission. Proc. Natl Acad. Sci. USA. 2000;97:11587–11592. doi: 10.1073/pnas.97.21.11587. [DOI] [PMC free article] [PubMed] [Google Scholar]
- 15.Zucker R.S., Regehr W.G. Short-term synaptic plasticity. Annu. Rev. Physiol. 2002;64:355–405. doi: 10.1146/annurev.physiol.64.092501.114547. [DOI] [PubMed] [Google Scholar]
- 16.Ashton A.C., Dolly J.O. A late phase of exocytosis from synaptosomes induced by elevated [Ca2+]i is not blocked by Clostridial neurotoxins. J. Neurochem. 2000;74:1979–1988. doi: 10.1046/j.1471-4159.2000.0741979.x. [DOI] [PubMed] [Google Scholar]
- 17.Stigliani S., Raiteri L., Fassio A., Bonanno G. The sensitivity of catecholamine release to botulinum toxin C1 and E suggests selective targeting of vesicles set into the readily releasable pool. J. Neurochem. 2003;85:409–421. doi: 10.1046/j.1471-4159.2003.01689.x. [DOI] [PubMed] [Google Scholar]
- 18.Raiteri L., Stigliani S., Zedda L., Raiteri M., Bonanno G. Multiple mechanisms of transmitter release evoked by ‘pathologically’ elevated extracellular [K+]: involvement of transporter reversal and mitochondrial calcium. J. Neurochem. 2002;80:706–714. doi: 10.1046/j.0022-3042.2001.00750.x. [DOI] [PubMed] [Google Scholar]
- 19.Raiteri L., Zappettini S., Milanese M., Fedele E., Raiteri M., Bonanno G. Mechanisms of glutamate release elicited in rat cerebrocortical nerve endings by ‘pathologically’ elevated extraterminal K+ concentrations. J. Neurochem. 2007;103:952–961. doi: 10.1111/j.1471-4159.2007.04784.x. [DOI] [PubMed] [Google Scholar]
- 20.Fassio A., Merlo D., Mapelli J., Menegon A., Corradi A., Mete M., Zappettini S., Bonanno G., Valtorta F., D’Angelo E., et al. The synapsin domain E accelerates the exoendocytotic cycle of synaptic vesicles in cerebellar Purkinje cells. J. Cell Sci. 2006;119:4257–4268. doi: 10.1242/jcs.03194. [DOI] [PubMed] [Google Scholar]
- 21.Schluter O.M., Schmitz F., Jahn R., Rosenmund C., Sudhof T.C. A complete genetic analysis of neuronal Rab3 function. J. Neurosci. 2004;24:6629–6637. doi: 10.1523/JNEUROSCI.1610-04.2004. [DOI] [PMC free article] [PubMed] [Google Scholar]
- 22.Sakane A., Manabe S., Ishizaki H., Tanaka-Okamoto M., Kiyokage E., Toida K., Yoshida T., Miyoshi J., Kamiya H., Takai Y., et al. Rab3 GTPase-activating protein regulates synaptic transmission and plasticity through the inactivation of Rab3. Proc. Natl Acad. Sci. USA. 2006;103:10029–10034. doi: 10.1073/pnas.0600304103. [DOI] [PMC free article] [PubMed] [Google Scholar]
- 23.Schluter O.M., Basu J., Sudhof T.C., Rosenmund C. Rab3 superprimes synaptic vesicles for release: implications for short-term synaptic plasticity. J. Neurosci. 2006;26:1239–1246. doi: 10.1523/JNEUROSCI.3553-05.2006. [DOI] [PMC free article] [PubMed] [Google Scholar]
- 24.Star E.N., Newton A.J., Murthy V.N. Real-time imaging of Rab3a and Rab5a reveals differential roles in presynaptic function. J. Physiol. 2005;569:103–117. doi: 10.1113/jphysiol.2005.092528. [DOI] [PMC free article] [PubMed] [Google Scholar]
- 25.Voglmaier S.M., Edwards R.H. Do different endocytic pathways make different synaptic vesicles? Curr. Opin. Neurobiol. 2007;17:374–380. doi: 10.1016/j.conb.2007.04.002. [DOI] [PubMed] [Google Scholar]
- 26.Rizzoli S.O., Betz W.J. Synaptic vesicle pools. Nat. Rev. Neurosci. 2005;6:57–69. doi: 10.1038/nrn1583. [DOI] [PubMed] [Google Scholar]
- 27.Rizzoli S.O., Jahn R. Kiss-and-run, collapse and ‘readily retrievable’ vesicles. Traffic. 2007;8:1137–1144. doi: 10.1111/j.1600-0854.2007.00614.x. [DOI] [PubMed] [Google Scholar]
- 28.Voglmaier S.M., Kam K., Yang H., Fortin D.L., Hua Z., Nicoll R.A., Edwards R.H. Distinct endocytic pathways control the rate and extent of synaptic vesicle protein recycling. Neuron. 2006;51:71–84. doi: 10.1016/j.neuron.2006.05.027. [DOI] [PubMed] [Google Scholar]
- 29.Faundez V., Horng J.T., Kelly R.B. A function for the AP3 coat complex in synaptic vesicle formation from endosomes. Cell. 1998;93:423–432. doi: 10.1016/s0092-8674(00)81170-8. [DOI] [PubMed] [Google Scholar]
- 30.Bucci C., Parton R.G., Mather I.H., Stunnenberg H., Simons K., Hoflack B., Zerial M. The small GTPase rab5 functions as a regulatory factor in the early endocytic pathway. Cell. 1992;70:715–728. doi: 10.1016/0092-8674(92)90306-w. [DOI] [PubMed] [Google Scholar]
- 31.Mohrmann K., Leijendekker R., Gerez L., van Der Sluijs P. Rab4 regulates transport to the apical plasma membrane in Madin–Darby canine kidney cells. J. Biol. Chem. 2002;277:10474–10481. doi: 10.1074/jbc.M111237200. [DOI] [PubMed] [Google Scholar]
- 32.de Wit H., Lichtenstein Y., Kelly R.B., Geuze H.J., Klumperman J., van der Sluijs P. Rab4 regulates formation of synaptic-like microvesicles from early endosomes in PC12 cells. Mol. Biol. Cell. 2001;12:3703–3715. doi: 10.1091/mbc.12.11.3703. [DOI] [PMC free article] [PubMed] [Google Scholar]
- 33.Fischer von Mollard G., Stahl B., Walch-Solimena C., Takei K., Daniels L., Khoklatchev A., De Camilli P., Sudhof T.C., Jahn R. Localization of Rab5 to synaptic vesicles identifies endosomal intermediate in synaptic vesicle recycling pathway. Eur. J. Cell Biol. 1994;65:319–326. [PubMed] [Google Scholar]
- 34.de Hoop M.J., Huber L.A., Stenmark H., Williamson E., Zerial M., Parton R.G., Dotti C.G. The involvement of the small GTP-binding protein Rab5a in neuronal endocytosis. Neuron. 1994;13:11–22. doi: 10.1016/0896-6273(94)90456-1. [DOI] [PubMed] [Google Scholar]
- 35.Shimizu H., Kawamura S., Ozaki K. An essential role of Rab5 in uniformity of synaptic vesicle size. J. Cell Sci. 2003;116:3583–3590. doi: 10.1242/jcs.00676. [DOI] [PubMed] [Google Scholar]
- 36.Kanaani J., Diacovo M.J., El-Husseini Ael D., Bredt D.S., Baekkeskov S. Palmitoylation controls trafficking of GAD65 from Golgi membranes to axon-specific endosomes and a Rab5a-dependent pathway to presynaptic clusters. J. Cell Sci. 2004;117:2001–2013. doi: 10.1242/jcs.01030. [DOI] [PubMed] [Google Scholar]
- 37.Wucherpfennig T., Wilsch-Brauninger M., Gonzalez-Gaitan M. Role of Drosophila Rab5 during endosomal trafficking at the synapse and evoked neurotransmitter release. J. Cell Biol. 2003;161:609–624. doi: 10.1083/jcb.200211087. [DOI] [PMC free article] [PubMed] [Google Scholar]
- 38.Bonanomi D., Benfenati F., Valtorta F. Protein sorting in the synaptic vesicle life cycle. Prog. Neurobiol. 2006;80:177–217. doi: 10.1016/j.pneurobio.2006.09.002. [DOI] [PubMed] [Google Scholar]
- 39.Lattal K.M. Trial and intertrial durations in Pavlovian conditioning: issues of learning and performance. J. Exp. Psychol. Anim. Behav. Process. 1999;25:433–450. doi: 10.1037/0097-7403.25.4.433. [DOI] [PubMed] [Google Scholar]
- 40.Hof P.R., Schmitz C. Current trends in neurostereology—introduction to the special issue ‘Recent advances in neurostereology. J. Chem. Neuroanat. 2000;20:3–5. doi: 10.1016/s0891-0618(00)00072-7. [DOI] [PubMed] [Google Scholar]
- 41.Royet J.P. Stereology: a method for analyzing images. Prog. Neurobiol. 1991;37:433–474. doi: 10.1016/0301-0082(91)90009-p. [DOI] [PubMed] [Google Scholar]
- 42.Bischofberger J., Engel D., Li L., Geiger J.R., Jonas P. Patch-clamp recording from mossy fiber terminals in hippocampal slices. Nat. Protoc. 2006;1:2075–2081. doi: 10.1038/nprot.2006.312. [DOI] [PubMed] [Google Scholar]
- 43.Stigliani S., Zappettini S., Raiteri L., Passalacqua M., Melloni E., Venturi C., Tacchetti C., Diaspro A., Usai C., Bonanno G. Glia re-sealed particles freshly prepared from adult rat brain are competent for exocytotic release of glutamate. J. Neurochem. 2006;96:656–668. doi: 10.1111/j.1471-4159.2005.03631.x. [DOI] [PubMed] [Google Scholar]
- 44.Bonanno G., Giambelli R., Raiteri L., Tiraboschi E., Zappettini S., Musazzi L., Raiteri M., Racagni G., Popoli M. Chronic antidepressants reduce depolarization-evoked glutamate release and protein interactions favoring formation of SNARE complex in hippocampus. J. Neurosci. 2005;25:3270–3279. doi: 10.1523/JNEUROSCI.5033-04.2005. [DOI] [PMC free article] [PubMed] [Google Scholar]
Associated Data
This section collects any data citations, data availability statements, or supplementary materials included in this article.