

Abstract
Background
Despite reports of increases in the cost of cancer treatment, little is known about how costs of cancer treatment have changed over time and what services have contributed to the increases.
Methods
We used data from the Surveillance, Epidemiology, and End Results (SEER)–Medicare linked database for 306 709 persons aged 65 and older and diagnosed with breast, lung, colorectal, or prostate cancer between 1991 and 2002 to assess the number of patients assigned to initial cancer care, from 2 months before diagnosis to 12 months after diagnosis, and mean annual Medicare payments for this care according to cancer type and type of treatment. Mutually exclusive treatment categories were cancer-related surgery, chemotherapy, radiation therapy, and other hospitalizations during the period of initial cancer care. Linear regression models were used to assess temporal trends in the percentage of patients receiving treatment and costs for those treated. We extrapolated our results based on the SEER data to the US Medicare population to estimate national Medicare payments by cancer site and treatment category. All statistical tests were two-sided.
Results
For patients diagnosed in 2002, Medicare paid an average of $39 891 for initial care for each lung cancer patient, $41 134 for each colorectal cancer patient, and $20 964 for each breast cancer patient, corresponding to inflation-adjusted increases from 1991 of $7139, $5345, and $4189, respectively. During the same interval, the mean Medicare payment for initial care for prostate cancer declined by $196 to $18261 in 2002. Costs for any hospitalization accounted for the largest portion of payments for all cancers. Chemotherapy use increased markedly for all cancers between 1991 and 2002, as did radiation therapy use (except for colorectal cancers). Total 2002 Medicare payments for initial care for these four cancers exceeded $6.7 billion, with colorectal and lung cancers being the most costly overall.
Conclusions
The statistically significant increase in costs of initial cancer treatment reflects more patients receiving surgery and adjuvant therapy and rising prices for these treatments. These trends are likely to continue in the near future, although more efficient targeting of costly therapies could mitigate the overall economic impact of this trend.
CONTEXT AND CAVEATS
Prior knowledge
Little was known about temporal changes in the costs of cancer treatment and which services have contributed to the increases.
Study design
Data from the Surveillance, Epidemiology, and End Results Progam were linked to Medicare claims data to assess the costs of initial cancer care (defined as that occurring from 2 months before diagnosis to 12 months following diagnosis) for persons diagnosed with breast, lung, colorectal, or prostate cancer according to cancer type and type of treatment.
Contribution
The study quantified the increase in the cost of cancer treatment for four major cancers and identified chemotherapies and radiation as contributors to those increases. It thus provided data needed for developing strategies to mitigate costs.
Implications
Costs for hospitalization accounted for the largest portion of expenditures. Expensive chemotherapies will place a strain on the financial resources of the Medicare program.
Limitations
The work does not assess cancer treatment patterns or costs for persons younger than 65, and the assessment was confined to services covered by Medicare.
From 1995 through 2004, the overall costs of treating cancer increased by an estimated 75% (1) due in part to advances in diagnostic and surgical techniques and pharmaceutical innovations. Cancer treatment accounted for an estimated $72.1 billion in 2004, just under 5% of total US spending for medical treatment (1). Much of the cost of treating cancer has been and will be borne by Medicare. Between 1998 and the end of 2002, patients aged 65 and older accounted for 56.2% of all cancer diagnoses in the United States (2). Although the cancer incidence rate in this age group declined 10% from 1992 to 2002 (3), the number of elderly Americans is increasing; thus, the absolute number of people treated for cancer is projected to increase faster than the increase in the overall population. The projected increase in those treated for cancer and the expansion of the Medicare program to include prescription drugs suggest that cancer care will account for an even greater portion of the future Medicare budget than it does today.
Previous studies on the cost to Medicare of cancer care have shown that a sizeable portion of cancer care costs are incurred in the year following diagnosis (4,5). Despite the high cost to Medicare of initial cancer care, that is, care in the first year following diagnosis, there is limited information on particular categories of cancer-related expenditures, especially costs of specific types of services. The purpose of this analysis is to provide estimates of the trends in the costs to Medicare of initial cancer care from 1991 through 2002 for a group of Medicare beneficiaries who were diagnosed with breast, prostate, lung, or colorectal cancer. We chose these sites because they account for approximately 60% of all cancers in the elderly (2). To provide greater understanding of which treatments have contributed to changes in initial cancer care costs, we present trends in the costs of care for specific types of health services, such as hospitalizations, chemotherapy, and radiation therapy, in addition to trends in total costs. We hypothesized that the increases in total costs of initial care would reflect both increased rates of treatment of elderly cancer patients and increased costs of specific types of therapy.
Methods
Data Sources
The data for this analysis were from an existing linkage of cancer registry data from the Surveillance, Epidemiology, and End Results (SEER) program of the National Cancer Institute to Medicare claims records (6). Among patients reported to SEER who were aged 65 or older, 94% have been linked to Medicare’s master enrollment file (6). Using the linked SEER–Medicare data allowed us to track patients across different health-care settings for purposes of estimating the costs of cancer treatment during the peri-diagnostic period and throughout the year following diagnosis.
The SEER data are obtained from population-based registries that collect clinical information about incident cancer patients and follow-up vital status. To track cost trends over time, we included only those registries that have been part of the SEER program since 1991. These registries covered five states (Connecticut, Hawaii, Iowa, New Mexico, and Utah) and six metropolitan areas (Atlanta, Detroit, Los Angeles, San Francisco-Oakland, San Jose-Monterey, and Seattle), which together represent approximately 14% of the US population (2). For each patient, the SEER data contain a unique case number, each occurrence of a primary incident cancer, month and year of diagnosis, type of surgery performed, and stage of disease at diagnosis. The Medicare data, collected by the Center for Medicare and Medicaid Services (CMS), include claims for beneficiaries with fee-for-service coverage for all inpatient hospitalizations, skilled nursing facility care, outpatient hospital services, physician/supplier services, durable medical equipment, and hospice and home health care. All files include specific dates of service and codes for specific diagnoses and procedures using either International Classification of Diseases, Ninth Revision, Clinical Modification codes (7) or Healthcare Common Procedure Coding System (8). The currently available SEER–Medicare data include cases diagnosed through the end of 2002.
Sample Selection
From the SEER–Medicare data, we selected all Medicare beneficiaries aged 65 and older who were diagnosed between January 1991 and December 2002 with breast, lung, colorectal, or prostate cancers of stage I, II, III, or IV. Patients were excluded if the month of diagnosis was unknown or if they had been ascertained by the SEER registry through death certificate or autopsy. To capture all services provided, we selected only patients enrolled in Medicare Part A and Part B coverage for 2 months before and 12 months after their cancer diagnosis, thus including Medicare claims through 2003. We also excluded persons enrolled in managed care at any time during this 14-month period because health maintenance organizations (HMOs) do not submit detailed claims data to Medicare. In 1991, the proportion of Medicare beneficiaries enrolled in HMOs was 4%, increasing to 18% in 2002 (9,10). To avoid capturing costs for treatment deriving from more than one cancer, we required that the patients have no prior or subsequent cancers reported in the SEER data.
Defining Costs and Care
The term costs, as used in this analysis, refers to the amount reimbursed by Medicare. Reimbursement rather than charges has been used as a proxy for medical care costs in other SEER–Medicare cost of care studies (5,11) because Medicare charges are not necessarily related to the cost of providing services (12); by contrast, Medicare costs are actual payments derived from reimbursement formulas that are intended to reflect the average resource utilization for that health service. A previous study concluded that actual payments may be preferred because they most closely correspond to the economic concept of opportunity cost, “a measure of the dollars that become unavailable for purchasing other things in the economy” (13).
Although a variety of price adjusters have been used in studies of health-care cost trends (14), we used ones that are directly related to Medicare reimbursement formulas. Payments for Medicare Part A (inpatient services) and Part B (outpatient services) were calculated separately. The Hospital Wage Index (15) and the Medicare Economic Index (16) were used to adjust for inflation in Medicare Parts A and B estimates, respectively, during 1991–2003 (14). We also adjusted for geographic variability in costs of care across SEER registry sites by using the Medicare Wage Index and Capital Geographic Adjustment Factor for Part A and the Medicare Geographic Practice Cost Index for Part B (15–18). We calculated our estimates in terms of 2003 dollars because this is the most recent year for which we have records of Medicare payments. However, we report mean payments for initial care through 2002 and aggregate payments for initial care for 2002 because this is the last year in which we have dates of cancer diagnosis.
To capture all care associated with the initial diagnosis and treatment of cancer, the initial care period was defined as care provided from 2 months before diagnosis through 365 days after diagnosis. We used the first day of the month of diagnosis in the SEER file as the date of diagnosis unless a cancer surgery was found in the Medicare data in the month before the SEER date. In such cases, the date of surgery from the Medicare data was used as the date of diagnosis.
The assessment included the total of Medicare payments for all health care provided (eg, hospital care, physician services, and outpatient and home health care). In addition, we assessed trends in the costs of major categories of cancer treatment according to cancer site. The categories of treatment were cancer-related surgery, radiation therapy, chemotherapy, and other hospitalizations. Claims for these services were mutually exclusive, meaning that costs were not assigned to more than one category. The categories were defined as follows. Cancer-related surgery costs were assessed beginning from the date of surgery, as reported on the Medicare claims, for a defined period based on the type of surgery. The length of the cancer-related surgery period was determined according to the intensity of the surgical procedure, and all Medicare claims during this period were included in the estimate of cancer-related surgery costs. In the case of multiple procedures (eg, transurethral resection of the prostate followed by radical prostatectomy), we used a hierarchy of surgical procedures to determine the most invasive surgery, which was considered the cancer-related surgery. The period associated with each surgery and the hierarchy of procedures was developed with the input from a practicing oncologist (E. B. Lamont), and the codes used to define the surgeries are provided in Appendix Table 1. Radiation therapy included both neoadjuvant therapy and adjuvant treatment. Costs were identified from the physician/supplier (carrier) file. In addition, we included claims from radiation therapy reported on the Hospital Outpatient file if the only service provided on that claim was radiation therapy. Radiation therapy that appeared on the same outpatient claim along with other services could not be included because the claim only has the total payment; thus, in these cases, costs for radiation therapy could not be separated from payment for other services. The cost of chemotherapy was defined as all Medicare payments, excluding radiation therapy claims, from the date on the first chemotherapy claim to the date on the last chemotherapy claim. The rationale for including all Medicare payments except those for radiation is that the vast majority of care that a patient receives while undergoing chemotherapy will be related to either chemotherapy administration or monitoring and treating the effects of the chemotherapy. For persons who had cancer-related surgery, chemotherapy costs included neoadjuvant therapy, if provided, or any adjuvant therapy given after the cancer-related surgery period had ended.
Because of the growing use of erythropoiesis-stimulating agents and granulocyte-colony stimulating factor (G-CSF), we determined the proportion of chemotherapy patients who had a Medicare claim for these medications. We calculated the portion of mean chemotherapy costs that was attributable to physician claims for these agents. Costs for other hospitalizations were defined as Medicare payments for any inpatient stays not occurring during the time windows for cancer-related surgery or chemotherapy.
Statistical Analysis
Assessing Trends in Costs.
Trends were calculated based on estimates for successive calendar years. For patients whose care spanned more than one calendar year, all costs were assigned to the year of diagnosis. To understand why costs may be changing over time, we assessed them according to two components—the percentage of new patients receiving each type of treatment (ie, surgery, chemotherapy, radiation therapy, and other hospitalizations) and the mean cost of care for patients who received the treatment. For example, the mean cost of cancer-related surgery is based only on those patients undergoing surgery. We assessed whether the trends in costs and in the proportion of people being treated were statistically significant using linear regression models. The models included the year as the independent variable and costs/percentage of people treated as the dependent variable. The slope parameters with 95% confidence intervals (CIs) were calculated for each site-specific trend.
Estimating National Medicare Costs.
Estimates of trends in costs were derived from cost data for Medicare beneficiaries residing in the SEER areas. We extrapolated our estimate of total Medicare fee-for-service payments to the entire United States for each of these cancer sites and services. To do this, we first obtained the total Medicare fee-for-service population aged 65 and older in 2002 from the CMS Web site (19). To determine the total number of cancer cases among the Medicare population, we used the 2002 SEER cancer site–specific rate for persons aged 65 and older and applied these rates to the total Medicare population. In the case of breast and prostate cancers, we included only the sex-specific population. To determine the costs of specific service categories, we first estimated the total number of beneficiaries receiving each service. This estimate was derived by calculating, by cancer site, the proportion of patients in our analysis who received the service and multiplying this by the total number of beneficiaries diagnosed with cancer in 2002. Then, to calculate the total Medicare payment for 2002 patients, we multiplied our estimate of the 2002 mean payment for the service by the estimate of total number of Medicare fee-for-service beneficiaries who received the service.
Results
Our cohort consisted of 306 709 fee-for-service Medicare beneficiaries who were diagnosed with breast, lung, colorectal, or prostate cancer between 1991 and 2002 (Table 1). From 1991 through 2002, there was a statistically significant increase in the initial care costs for lung, breast, and colorectal cancer. In all years, the two largest mean Medicare payments were for lung and colorectal cancer care, and payments for these two cancers increased the most in terms of percentage and in absolute dollars (Figure 1). In 2002, Medicare paid an average of $39 891 for initial care costs for each lung cancer case and $41 134 for each colorectal case, increases of $7139 and $5345 over the respective 1991 payments. The mean payment for breast cancer rose $4189 from 1991 to an average of $20 929 in 2002. During the same interval, the mean payment for prostate cancer declined by $196 to $18 261 in 2002.
Table 1.
Numbers of Medicare beneficiaries aged 65 and older included in the cohort with claims for specific cancer services by cancer site and year of diagnosis
| 1991 | 1992 | 1993 | 1994 | 1995 | 1996 | 1997 | 1998 | 1999 | 2000 | 2001 | 2002 | Total | |
| Breast | |||||||||||||
| Any cancer service | 5068 | 5099 | 4774 | 4682 | 4789 | 4707 | 4882 | 4719 | 4878 | 4727 | 4785 | 4770 | 57 880 |
| Cancer-directed surgery | 4604 | 4627 | 4289 | 4270 | 4368 | 4220 | 4396 | 4293 | 4449 | 4323 | 4323 | 4334 | 52 496 |
| Chemotherapy | 574 | 638 | 549 | 567 | 599 | 629 | 774 | 867 | 997 | 1064 | 1095 | 1156 | 9509 |
| Radiation oncology | 1324 | 1583 | 1526 | 1608 | 1790 | 1870 | 2125 | 2126 | 2349 | 2289 | 2327 | 2443 | 23 360 |
| Other hospitalizations | 1271 | 1341 | 1241 | 1178 | 1166 | 1174 | 1207 | 1143 | 1228 | 1188 | 1152 | 1095 | 14 384 |
| Lung | |||||||||||||
| Total number of patients | 7130 | 7333 | 7083 | 7053 | 6899 | 6810 | 6481 | 6328 | 6159 | 6005 | 5254 | 5206 | 77 741 |
| Cancer-directed surgery | 4364 | 4371 | 4119 | 4117 | 3830 | 3735 | 3544 | 3338 | 3309 | 3190 | 2729 | 2710 | 43 356 |
| Chemotherapy | 1731 | 1827 | 1688 | 1825 | 1852 | 1963 | 1994 | 2057 | 2074 | 2102 | 1858 | 1838 | 22 809 |
| Radiation oncology | 3347 | 3325 | 3176 | 3124 | 2995 | 2932 | 2798 | 2663 | 2487 | 2418 | 2055 | 1972 | 33 292 |
| Other hospitalizations | 5023 | 5127 | 4874 | 4832 | 4689 | 4568 | 4408 | 4303 | 4149 | 4040 | 3582 | 3530 | 53 125 |
| Colorectal | |||||||||||||
| Total number of patients | 6095 | 5889 | 5626 | 5473 | 5323 | 5236 | 5249 | 5209 | 4978 | 5140 | 5120 | 5216 | 64 554 |
| Cancer-directed surgery | 5356 | 5140 | 4861 | 4777 | 4678 | 4575 | 4537 | 4560 | 4352 | 4536 | 4498 | 4574 | 56 444 |
| Chemotherapy | 1643 | 1689 | 1565 | 1496 | 1549 | 1505 | 1495 | 1509 | 1474 | 1521 | 1508 | 1529 | 18 483 |
| Radiation oncology | 610 | 564 | 517 | 525 | 545 | 533 | 546 | 538 | 528 | 506 | 480 | 484 | 6376 |
| Other hospitalizations | 2454 | 2296 | 2209 | 2176 | 2125 | 2127 | 2148 | 2106 | 2075 | 2161 | 2112 | 2142 | 26 131 |
| Prostate | |||||||||||||
| Total number of patients | 11 139 | 12 332 | 10 321 | 8704 | 7958 | 7570 | 7711 | 7422 | 8021 | 8103 | 8527 | 8726 | 106 534 |
| Cancer-directed surgery | 5980 | 5730 | 4279 | 3340 | 2908 | 2642 | 2515 | 2249 | 2207 | 2063 | 2156 | 2073 | 38 142 |
| Chemotherapy | 423 | 456 | 259 | 275 | 248 | 291 | 270 | 207 | 213 | 308 | 397 | 603 | 3950 |
| Radiation oncology | 3664 | 4149 | 3252 | 2728 | 2511 | 2515 | 2863 | 2902 | 3259 | 3486 | 3933 | 4087 | 39 349 |
| Other hospitalizations | 3856 | 3792 | 3092 | 2509 | 2147 | 2023 | 2000 | 1975 | 2007 | 2066 | 2122 | 2101 | 29 690 |
Figure 1.

Trends in the mean Medicare payment in constant 2003 dollars during the initial year of treatment. Data are shown for breast, lung, colorectal, and prostate cancer patients in the Surveillance, Epidemiology, and End Results areas for 1991 through 2002. The parameter estimate for slopes (dollars per year) were as follows. Breast: 310, 95% confidence interval (CI) = 217 to 404, P < .001; lung: 598, 95% CI = 440 to 755, P < .001; colorectal: 472, 95% CI = 237 to 706, P = .001; prostate: −11, 95% CI = −114 to 92, P = .818.
The percentage of people undergoing cancer-related surgery varied by cancer site (Figure 2, A). For breast and colorectal cancer patients, the portion of patients that underwent surgery was in excess of 87% for all years included in the analysis. For persons with lung cancer, the portion treated surgically declined statistically significantly from 61% in 1991 to 52% in 2002 (yearly rate of decline = 0.84%, 95% CI = 0.67% to 1.02%). The greatest change in cancer-related surgery rates occurred in men with prostate cancer, in whom the percentage treated with surgery declined from 54% in 1991 to 24% in 2002 (yearly rate of decline = 2.52%, 95% CI = 2.07% to 2.97%).
Figure 2.

Trends in the percent of fee-for-service Medicare beneficiaries undergoing cancer-related surgery and the mean Medicare payment in constant 2003 dollars during the initial year of treatment. Data are shown for breast, lung, colorectal, and prostate cancer patients in the Surveillance, Epidemiology, and End Results areas for 1991 through 2002. A) Parameter estimate for slopes (proportions receiving surgery per year) were as follows. Breast: 0.03, 95% confidence interval (CI) = −0.08 to 0.14, P = .635; lung: −0.84, 95% CI = −1.02 to −0.67, P < .001; colorectal: 0.05, 95% CI = −0.05 to 0.15, P = .318; prostate: −2.5, 95% CI = −3.0 to −2.1, P < .001. B)Parameter estimate for slopes (dollars per year) were as follows. Breast: −168, 95% CI = −199 to −138, P < .001; lung: 193, 95% CI = 83 to 302, P =.003; colorectal: 156, 95% CI = −14 to 326, P = .069; prostate: −137, 95% CI = −258 to −16, P = .030.
We examined trends in the proportion of people who were hospitalized for their surgery among those who had cancer-related surgery. For colorectal cancer, the percent hospitalized was constant over the study period, at approximately 92%. From 1991 to 2002, the percentage of persons who were hospitalized for their surgeries increased from 36% to 44% for lung surgeries and from 81% to 92% for prostate surgeries. The greatest change in hospitalizations was for breast surgeries, for which the number of women hospitalized declined from 82% in 1991 to 47% in 2002. The 2002 mean cost of surgery was highest for colorectal cancer surgery ($24 910) followed by lung ($12 712), prostate ($9080), and breast ($5674) cancer surgery (Figure 2, B). From 1991 to 2002, the mean cost of surgery for lung cancer increased by $2876 (yearly increase in cost $192, 95% CI = $83 to $302). Mean cancer-related surgery costs for breast and prostate cancer declined statistically significantly during the interval (yearly decreases in costs were $169, 95% CI = $138 to $199, and $137, 95% CI = $16 to $257, respectively). Over the period of this study, there was a statistically significant increase in the use of chemotherapy for breast, lung, and colorectal cancers (Figure 3, A). From 1991 to 2002, the proportion of lung cancer patients treated with chemotherapy rose from 24% to 35% (yearly rate of increase = 1.2%, 95% CI = 1.0% to 1.4%) and the percent of women with breast cancer who received chemotherapy increased from 11% to 24% (yearly rate of increase = 1.3%, 95% CI = 1.0% to 1.6%). The mean costs of chemotherapy rose by a statistically significant extent for all four cancers. Mean lung cancer chemotherapy costs were the highest and increased by $8173 per person treated between 1991 and 2002. Breast cancer chemotherapy costs increased an average of $6160 over that period and by 2002 were $12 802 per person (yearly increase in cost $549, 95% CI = $429 to $670), slightly lower than the mean colorectal chemotherapy costs. In 1991, approximately 1% of breast, lung, colorectal, and prostate cancer patients received erythropoiesis-stimulating agents and no patients received G-CSF. By 2002, the percentage of chemotherapy patients who received erythropoiesis-stimulating agents was 43.7% for lung cancer, 31.8% for breast cancer, 29.0% for colorectal cancer, and 14.4% for prostate cancer patients. There was a smaller increase in the use of G-CSF. By 2002, the only appreciable use of G-CSF with chemotherapy was in the treatment of lung cancer patients (19.8% of patients) and breast cancer patients (25.4%). We calculated 2002 payments for erythropoiesis-stimulating agents and G-CSF as a subset of the total chemotherapy payments. Among patients with lung and colorectal cancer who received chemotherapy, erythropoiesis-stimulating agents accounted for 8% of the mean costs of chemotherapy; for breast and prostate cancer patients receiving chemotherapy, the portion of mean chemotherapy costs attributable to erythropoiesis-stimulating agents was higher, about 13%. G-CSF accounted for about 4% of the mean costs of chemotherapy for the four cancers.
Figure 3.
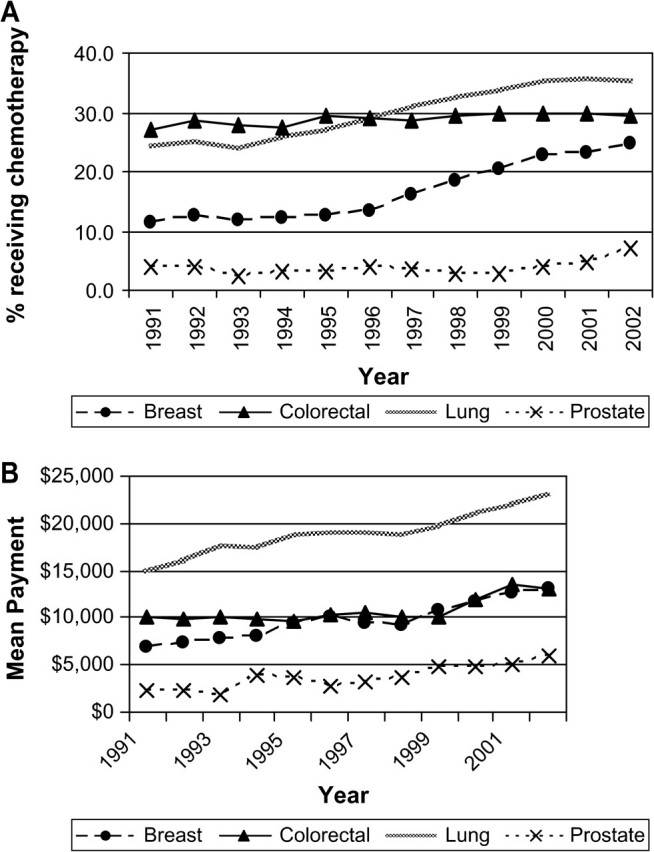
Trends in the percent of fee-for-service Medicare beneficiaries receiving chemotherapy and the mean Medicare payment in constant 2003 dollars during the initial year of treatment. Data are shown for breast, lung, colorectal, and prostate cancer patients in the Surveillance, Epidemiology, and End Results areas for 1991 through 2002. A) Parameter estimate for slopes (proportions receiving chemotherapy per year) were as follows. Breast: 1.3, 95% confidence interval (CI) = 1.01 to 1.58, P < .001; lung: 1.23, 95% CI = 1.03 to 1.43, P < .001; colorectal: 0.20, 95% CI = 0.09 to 0.30, P = .002; prostate: 0.15, 95% CI = −0.03 to 0.35, P = .090. B) Parameter estimate for slopes (dollars per year) were as follows. Breast: 550, 95% CI = 429 to 670, P < .001; lung: 636, 95% CI = 519 to 752, P < .001; colorectal: 280, 95% CI = 113 to 446, P = .004; prostate: 325, 95% CI = 218 to 433, P < .001.
We also calculated the annual percentage of patients receiving radiation therapy between 1991 and 2002. The fraction of breast and prostate cancer patients receiving radiation therapy rose from 26% to 51% and from 33% to 47%, respectively. During this interval, the percent of persons with colorectal cancer who received radiation therapy remained constant and the portion of lung cancer patients receiving radiation therapy declined by 9%. The observed cost of radiation therapy increased by a statistically significant extent for all four cancers. Radiation costs were greatest for prostate cancer, $5629 in 2002. For breast and prostate cancer patients, the mean increase from 1991 to 2002 in the cost of radiation therapy for persons who received it was $2244 and $2657, respectively (breast yearly increase in cost $195, 95% CI = 167 to 222, P < .05; prostate yearly increase in cost $283, 95% CI = 238 to 327, P < .05) (Figure 4, B).
Figure 4.

Trends in the percent of fee-for-service Medicare beneficiaries receiving radiation therapy and the mean Medicare payment in constant 2003 dollars during the initial year of treatment. Data are shown for breast, lung, colorectal, and prostate cancer patients in the Surveillance, Epidemiology, and End Results areas for 1991 through 2002. A) Parameter estimate for slopes (proportions receiving radiation therapy per year) were as follows. Breast: 2.3, 95% confidence interval (CI) = 1.98 to 2.53, P < .001; lung: −0.73, 95% CI = −0.82 to −0.64, P < .001; colorectal: .003, 95% CI = −0.09 to 0.09, P = .952; prostate: 1.40, 95% CI = 0.95 to 1.84, P < .001. B) Parameter estimate for slopes (dollars per year) were as follows. Breast: 195, 95% CI = 168 to 222, P < .001; lung: 132, 95% CI = 105 to 159, P < .001; colorectal: 147, 95% CI = 110 to 183, P < .001; prostate: 283, 95% CI = 238 to 327, P < .001.
There was statistically significant variation by cancer site in the percent of persons who had hospitalizations for reasons other than cancer-related surgery (Figure 5, A). Persons with lung cancer had the highest rates of hospitalizations not related to cancer surgery, about 70% for each year. From 1991 to 2002, the proportion of men with prostate cancer who had hospitalizations in this category declined by 10%. During this interval, the mean payment for those hospitalized for reasons other than surgery increased statistically significantly for breast, lung, and colorectal cancers (yearly increase in mean payment for hospitalizations for reasons other than surgery for breast cancer patients = $169, 95% CI = $16 to $322; yearly increase for lung cancer patients = $126, 95% CI = $22 to $229; yearly increase in cost for colorectal cancer patients = $187, 95% CI = $29 to $344) (Figure 5, B). For colorectal and lung cancers, the diagnoses for these hospitalizations were primarily for cancer or sequela of cancer treatment.
Figure 5.

Trends in the percent of fee-for-service Medicare beneficiaries with other hospitalizations (ie, for reasons other than cancer surgery) and the mean Medicare payment for those hospitalized in constant 2003 dollars during the initial year of treatment. Data are shown for breast, lung, colorectal, and prostate cancer patients in the Surveillance, Epidemiology, and End Results areas for 1991 through 2002. A) Parameter estimate for slopes (proportions with other hospitalizations per year) were as follows. Breast: −0.17, 95% confidence interval (CI) = −0.30 to −0.05, P = .009; lung: −0.22, 95% CI = −0.36 to −0.09, P = .005; colorectal: 0.20, 95% CI = 0.10 to 0.31, P = .002; prostate: −0.79; 95% CI = −1.03 to −0.56, P < .001. B) Parameter estimate for slopes (dollars per year) were as follows. Breast: 169, 95% CI = 17 to 322, P = .033; lung: 126, 95% CI = 23 to 229, P = .022; colorectal: 187, 95% CI = 29 to 345, P = .025; prostate: 119, 95% CI = −77 to 316, P = .205.
Some patients in our analysis had no initial cancer-related surgery, radiation therapy, or chemotherapy. These were mostly men with prostate cancer; the proportion of prostate cancer patients handled with expectant management rose from 21% in 1991 to 30% in 2002. The portion of lung cancer patients who had no cancer-directed therapy rose from 20% in 1991 to 26% in 2002. By contrast, almost all breast and colorectal cancer patients had some type of cancer treatment.
We estimated total Medicare payments for initial care if the data from the SEER patients were extrapolated to the US Medicare population aged 65 and older (Table 2). Total Medicare payments in 2002 were the highest for colorectal and lung cancers, at approximately $2.0 billion each. Hospital care, either associated with cancer-related surgery or other hospitalizations, accounted for a large percentage of costs for breast (43%), lung (50%), and colorectal (72%) cancers. Hospital expenditures represented only 33% of all expenditures for prostate cancers. The combination of hospital care, chemotherapy, and radiation therapy accounted for the preponderance of total costs for breast (69%), colorectal (82%), and lung (74%) cancers. However, for prostate cancer, only 50% of the total costs were for hospital care, chemotherapy, and radiation therapy. In 2002, hormone therapy accounted for 7.4% of total Medicare payments for prostate cancer patients.
Table 2.
Total Medicare payments for initial cancer care extrapolated to the US fee-for-service Medicare population aged 65 and older, 2002*
| Percent of patients receiving treatment | Total number of US beneficiaries receiving service | Mean 2002 payment for persons receiving service, $ | Total Medicare payment 2002, $ | Percent of total payment | |
| Breast (n = 50 716) | |||||
| Total | 100.0 | 50 716 | 20 929 | 1 061 459 553 | – |
| Cancer-related surgery | 90.9 | 46 081 | 5674 | 261 480 512 | 24.6 |
| Chemotherapy | 24.2 | 12 291 | 12 802 | 157 354 829 | 14.8 |
| Radiation therapy | 51.2 | 25 975 | 4513 | 117 227 110 | 11.0 |
| Other hospitalizations | 23.0 | 11 642 | 16 692 | 194 331 293 | 18.3 |
| Lung (n = 50 024) | |||||
| Total | 100.0 | 50 024 | 39 891 | 1 995 493 131 | – |
| Cancer-related surgery | 52.1 | 26 040 | 12 712 | 331 027 660 | 16.6 |
| Chemotherapy | 35.3 | 17 661 | 23 026 | 406 661 649 | 20.4 |
| Radiation therapy | 37.9 | 18 949 | 3496 | 66 237 335 | 3.3 |
| Other hospitalizations | 67.8 | 33 919 | 19 785 | 671 097 383 | 33.6 |
| Colorectal (n = 49 551) | |||||
| Total | 100.0 | 49 551 | 41 134 | 2 038 244 271 | – |
| Cancer-related surgery | 87.7 | 43 452 | 24 910 | 1 082 406 126 | 53.1 |
| Chemotherapy | 29.3 | 14 525 | 12 972 | 188 419 474 | 9.2 |
| Radiation therapy | 9.3 | 4598 | 3849 | 17 697 897 | 0.9 |
| Other hospitalizations | 41.1 | 20 349 | 18 455 | 375 526 952 | 18.4 |
| Prostate (n = 86 589) | |||||
| Total | 100.0 | 86 589 | 18 261 | 1 581 223 606 | – |
| Cancer-related surgery | 23.8 | 20 570 | 9080 | 186 786 306 | 11.8 |
| Chemotherapy | 6.9 | 5984 | 6015 | 35 991 490 | 2.3 |
| Radiation therapy | 46.8 | 40 555 | 5629 | 228 275 726 | 14.4 |
| Other hospitalizations | 24.1 | 20 848 | 16 221 | 338 186 258 | 21.4 |
* Total payments do not equal total number of beneficiaries × mean costs because of rounding of total costs. In addition, not all Medicare payments are included in the reported categories (cancer-related surgery, chemotherapy, radiation therapy and other hospitalizations); therefore the total Medicare payments are larger than the sums of the payments in each category (and the percentages add to less than 100).
Discussion
As health-care costs continue to rise, understanding trends in the costs of health care and which components of treatment are contributing to costs will be important in planning for future health costs and setting priorities for allocating resources. To our knowledge, this analysis is the first to assess trends in the costs of specific components of initial cancer care in the United States. We found that for patients with breast, lung, and colorectal cancers, the mean total amount that Medicare paid per patient during the initial period of diagnosis increased by a statistically significant extent from 1991 to 2002. These current trend estimates can be used as baseline data for investigators who wish to model the cost implications of specific emerging technologies and practices using working assumptions about service costs and dissemination (20).
Expenses from hospitalizations, those that occurred during the initial cancer surgery period as well as other hospitalizations during the initial year of care, accounted for the largest portion of Medicare payments for these four cancers. We evaluated the reason for other hospitalizations by reviewing the primary diagnosis on all hospital claims after the cancer-related surgery. We found that, for colorectal and lung cancers, the primary diagnosis for a large portion of the subsequent hospitalizations was for cancer or a sequela to the cancer, for example, pleural effusions or anemia. There were fewer cancer-related diagnoses during other hospitalizations for breast and prostate cancers.
During the period of our study, there were statistically significant increases in the proportions of breast, lung, and colorectal cancer patients treated with chemotherapy. These increasing rates may reflect the response of practitioners to National Institutes of Health Consensus Statements regarding the survival benefit associated with adjuvant chemotherapy for breast and colorectal cancer (21–24) and to the publication of studies throughout the study period regarding the benefit of chemotherapy for lung cancer (25–27). The increasing percentage of Medicare beneficiaries who received adjuvant chemotherapy may also be the result of physicians’ growing acceptance of the benefit of chemotherapy in some elderly patients. Historically, the elderly have not been adequately represented in clinical trials, leaving physicians with uncertainty as to the benefit and risks of adjuvant therapy in their older patients. In recent years, studies using observational data have highlighted underuse of chemotherapy in the elderly cancer patients and have shown that chemotherapy can be tolerated and effective in many elderly patients (28–32).
In addition to an increase in the percent of patients receiving chemotherapy, we found a marked increase in the average payment for those patients who received chemotherapy. We estimated that in 2002, chemotherapy costs during the initial care period ranged from 9% of total payments for colorectal cancers to 20% of total health-care payments for lung cancer. In the mid to late 1990s, new and expensive agents (eg, paclitaxel, docetaxel, and gemcitabine), alone or in combination with existing agents, were shown to provide superior survival benefits compared with prior approaches (33). The costs of these agents can be substantial. A study found that the lifetime costs of carboplatin with paclitaxel can be up to $12 000 more than those of older regimens like cisplatin plus vinorelbine (34). Even with the emergence of newer, more expensive multidrug chemotherapy regimens during this period, we believe that our results underestimate current 2007 chemotherapy costs because our observation period ended before Federal Drug Administration approval of many of the extremely expensive chemotherapeutic agents such as oxaliplatin, cetuximab, erlitonib, and bevacizumab or the dissemination of findings regarding the benefits of trastuzumab for some types of breast cancer. Given that many of the new and expensive targeted therapies are used with existing therapies, they may add to rather than substitute for adjuvant therapy costs. Use of these new agents is estimated to dramatically escalate the costs of cancer care. For example, a 2004 report estimated that the addition of cetuximab and bevacizumab for treatment of metastatic colorectal cancer could cost as much as $161 000 in 1 year (35). An additional factor that has contributed to the rising costs of chemotherapy is the increased use of erythropoiesis-stimulating agents and G-CSF. However, the costs of erythropoiesis-stimulating agents and G-CSF may be offset by the fact that use of erythropoiesis-stimulating agents and G-CSF may allow patients to remain on the recommended schedule of treatment.
We also observed shifts in components of health-care costs that have influenced total costs. The mean payment for prostate cancer declined from 1991 through 2002. This decrease can be explained by a 29% drop in cancer-related surgeries. The reduction in the use of radical prostatectomy has been offset by a 14% increase in the use of radiation therapy from 1991 to 2002. In our analysis, the mean costs of cancer-related surgery by year for prostate cancer ranged from $3451 to $7987 higher than the radiation therapy costs. The differences are greater than those in an earlier study (36), which found that during the initial period of care radical prostatectomy was $3178 more expensive than radiation therapy. Although we found that the costs associated with cancer-related surgery are greater than for radiation therapy, the mean cost of cancer surgery has been declining while radiation costs have risen.
The portion of women undergoing surgery for breast cancer remained constant over the period of our study. However, the mean cost of cancer-related surgery declined, likely because the growing use of breast conserving surgery has resulted in fewer inpatient hospitalizations. As was the case for prostate cancer, the decline in inpatient procedures for breast cancer has been offset by increases in the number of women receiving radiation therapy. The temporal increases in initial treatment costs observed here (with the exception of prostate cancer) are likely to continue into the near future and, with the recent introduction of new and increasingly expensive chemotherapy and biologic agents, accelerate.
There were limitations to our study beyond the exclusion of more recent chemotherapeutic agents. For patients who were identified as undergoing cancer-directed surgery, the Medicare procedures reported on the claims could have been miscoded. However, earlier studies have found that procedures reported from the Medicare data have high sensitivity and accuracy and that there is strong concordance between the surgeries identified from the Medicare data and those abstracted by the SEER registrars (37–41). Our estimates of costs are incomplete in several ways. Some patients in our study did not receive any cancer-directed therapy that was identified by either the SEER or Medicare data. The percentage of these patients varied by cancer site. It is possible that these patients presented with advanced disease and did not undergo any curative care. We found that, with the exception of prostate cancer patients, 50%–70% of staged patients who did not receive cancer-directed therapy had stage IV disease. Many of the patients who did not have cancer-directed treatment did have hospitalizations throughout the year. These costs would be captured in the “other hospitalization” category. The lack of treatment could also reflect receipt of care not provided by Medicare (from the Veteran's Administration or paid for by private health insurance through an employer). In addition to services not provided by Medicare, the payments used to estimate costs exclude services not covered by Medicare. Medicare payments do not include any insurance payments secondary to Medicare or the patient's share of expenditures. Estimates for the portion of total health care spending covered by Medicare range from 65% for 1995 to 58% for 1999 (42,43). Therefore, the estimates provided in our analysis do not reflect the total cost of care; they reflect the trends over time in the cost to Medicare.
Another limitation is that the cost of radiation therapy was underestimated. Although we could obtain Medicare payments to the radiation oncologist from the physician claims and payments to outpatient facilities, for the years included in our analysis, outpatient claims had a summary payment that included all services billed on the claim. The only outpatient claims that we could attribute to radiation therapy and include in the analysis were those with no other service included in the outpatient bill, about 60% of all outpatient claims with a billed radiation therapy service. Although the cost of radiation therapy was thus underestimated, the rates of radiation therapy use were not affected by the limitation in the claims data, nor did this limitation affect our ability to estimate total Medicare expenditures. Our analysis was also limited by the fact that the national estimates of cancer costs were derived from the SEER areas and were based on the assumption that cancer incidence rates and stages in the SEER areas are representative of the entire country. In addition, these costs were limited to Medicare payment for the initial care period, thus excluding most treatment costs for recurrence or disease progression. Finally, these data do not reflect the treatment patterns or costs for persons with cancer under age 65.
The US population is aging. As a result, the absolute number of cancer patients who are 65 and older is expected to increase substantially. In addition, the length of cancer survival has increased resulting in increasing numbers of Medicare beneficiaries with cancer. CMS faces economic challenges as a result of secular changes in the Medicare population and in cancer survivorship.
Beyond the growing number of Medicare beneficiaries with cancer, the portion of elderly who are being treated is increasing and treatment costs are rising. For the four cancers in our analysis, the total 2002 Medicare expenditures for initial care exceeded $6.7 billion. These data do not reflect the current (2008) or future costs to the Medicare program related to cancer care. Expensive chemotherapies will place a strain on the financial resources of the Medicare program. CMS needs to anticipate the burden of paying for new chemotherapies and may need to promote programs to identify those patients who may benefit the most from these expensive treatments. Without planning for the future, paying for care for Medicare beneficiaries with cancer will be a major component of the spiraling costs of care faced by the Medicare program.
Appendix
Appendix Table 1.
Codes used to define procedures with hierarchy (most invasive to least invasive) and time intervals for cancer-related surgery periods*
| Procedure/time period | Codes |
| Lung surgery | |
| Total lung resection per 60 days | ICD-9: 32.5, 32.9 |
| HCPCS: 32100, 32440, 32442, 32445 | |
| Lobectomy per 30 days | ICD-9: 32.3, 32.4, 34.4 |
| HCPCS: 19260, 19271, 19272, 32480, 32482, 32484, 32486, 32488, 32500, 32520, 32522, 32525 | |
| Local excision per 30 days | ICD-9: 32.01, 32.09, 32.1, 32.28, 32.29 |
| HCPCS: 31640, 31641, 31643, 32657 | |
| Mediastinoscopy per 7 days | ICD-9: 34.22 |
| HCPCS: 39400 | |
| Bronchoscopy per 7 days | HCPCS: 31615, 31622–31625, 31628, 31629, 31632, 31633 |
| Breast surgery | |
| Mastectomy per 30 days | ICD-9: 34.4, 85.41–85.48 |
| HCPCS: 19180, 19182, 19200, 19220, 19240, 19260, 19271, 19272 | |
| Breast conserving surgery per 30 days | ICD-9: 85.21–85.23 |
| HCPCS: 19120, 19125, 19126, 19290, 19291, 19160, 19162 | |
| Prostate surgery | |
| Prostatectomy per 42 days | ICD-9: 60.29, 60.3, 60.4, 60.5, 60.62, 60.69 |
| HCPCS: 52601, 52612, 52614, 55801, 55810, 55812, 55815, 55821, 55831, 55840, 55842, 55845 | |
| Orchiectomy per 30 days | ICD-9: 62.3, 62.4, 62.41, 62.42 |
| HCPCS: 54520, 54522, 54530, 54535, 54690 | |
| TURP and local excision per 14 days | ICD-9: 60.2, 60.21, 60.61 |
| HCPCS: G0160 | |
| Colorectal surgery | |
| Pelvic exenteration per 60 days | ICD-9: 68.8 |
| HCPCS: 51597 | |
| Colectomy/proctectomy per 30 days | ICD-9: 45.71–45.76, 45.79, 45.8, 48.4, 48.41, 48.49, 48.5, 48.61–48.65, 48.69 |
| HCPCS: 44140, 44141, 44143–44147, 44150–44153, 44155, 44156, 44160, 45110–45114, 45116, 45119, 45123, 45160, 45170 | |
| Colostomy/Ileostomy per 30 days | ICD-9: 46.01, 46.03, 46.10, 46.11, 46.13, 46.14, 46.20–46.24, 46.31, 46.39, 46.40, 46.41, 46.43, 46.50–46.52 |
| HCPCS: 44310, 44316, 44320, 44322, 44340, 44345, 44620, 44625, 44626 | |
| Endoscopy with biopsy per 7 days | ICD-9: 45.42, 45.43, 48.36 |
| HCPCS: 44392–44394, 45308, 45309, 45315, 45320, 45333, 45338, 45339, 45383–45385 | |
| Chemotherapy | ICD-9: 99.25 |
| HCPCS: J9000–J9999, 36260, 96400, 96405, 96406, 96408, 96410, 96412, 96414, 96420, 96422, 96423, 96425, 96440, 96445, 96450, 96520, 96530, 96542, 96545, 96549, 95990, 95991, A4301, E0782, E0783, E0784, E0785, E0786, G0355, G0357–G0360, C9411, J0207, J0640, J0880, J1190, J1440, J1441, J1950, J9217, J9218, J9219, J2405, J2430, J2505, J2820, J3487, J8520, J8521, J8530, J8560, J8565, J8600, J8610, J8700, J8999, K0415, KO416, Q0083, Q0084, Q0085, Q0136, Q0137, Q0179, S0177, S0181 | |
| Radiation therapy | ICD-9: 92.21–92.33, 92.39 |
| HCPCS: 76370, 76950, 77261–77263, 77280, 77285, 77290, 77295, 77299, 77300, 77301, 77305, 77310, 77315, 77321, 77326, 77327, 77328, 77331–77334, 77336, 77370, 77399, 77401–77404, 77406, 77407–77409, 77411–77414, 77416, 77417, 77427, 77431, 77432, 77470, 77499, 77520, 77523, 77750, 77761–77763, 77776–77778, 77781–77784, 77789, 77790, 77799 |
ICD-9 = International Classification of Diseases, Ninth Revision; HCPCS = Healthcare Common Procedure Coding System; TURP = transurethral resection of the prostate.
Footnotes
The authors take full responsibility for the study design, data collection, analysis and interpretation of the data, the decision to submit the manuscript for publication, and the writing of the manuscript.
References
- 1.Cancer Trends Progress Report—2005 Update. Bethesda, MD: National Cancer Institute, NIH, DHHS; December 2005. http://progressreport.cancer.gov Accessed March 27, 2008. [Google Scholar]
- 2.Ries LAG, Eisner MP, Kosary CL. SEER Cancer Statistics Review, 1975–2002. Bethesda, MD: National Cancer Institute; 2008. Based on November 2004 SEER data submission, posted to the SEER Web site 2005. http://seer.cancer.gov/csr/1975_2002/ Accessed March 27. [Google Scholar]
- 3.Surveillance, Epidemiology, and End Results (SEER) Program SEER*Stat Database: Incidence—SEER 13 Regs Public-Use, Nov 2005 Sub (1992–2003)—Linked to County Attributes—Total US, 1969–2003 Counties. National Cancer Institute, DCCPS, Surveillance Research Program, Cancer Statistics Branch, Bethesda, MD, released April 2006, based on the November 2005 submission. http://www.seer.cancer.gov. Accessed March 27, 2008. [Google Scholar]
- 4.Brown ML, Riley GF, Schussler N, Etzioni R. Estimating health care costs related to cancer treatment from SEER-Medicare data. Med Care. 2002;40 doi: 10.1097/00005650-200208001-00014. IV-104-17. [DOI] [PubMed] [Google Scholar]
- 5.Warren JL, Brown ML, Fay MP, Schussler N, Potosky AL, Riley GF. Costs of treatment for elderly women with early-stage breast cancer in fee-for-service settings. J Clin Oncol. 2002;20(1):307–316. doi: 10.1200/JCO.2002.20.1.307. [DOI] [PubMed] [Google Scholar]
- 6.Warren JL, Klabunde CN, Schrag D, Bach PB, Riley GF. Overview of the SEER-Medicare data: content, research applications, and generalizability to the United States elderly population. Med Care. 2002;40 doi: 10.1097/01.MLR.0000020942.47004.03. IV-3-18. [DOI] [PubMed] [Google Scholar]
- 7.US Public Health Service. International Classification of Diseases, Ninth Revision. Washington, DC: US GPO; 2003. [Google Scholar]
- 8.CPT 2002. Chicago: American Medical Association; 2001. Physicians’ Current Procedural Terminology. [Google Scholar]
- 9.Hileman GR, Moroz KE, Wrightson CW, Kim SK. Medicare+Choice individual and group enrollment: 2001 and 2002. Health Care Financ Rev. 2002;24(1):145–153. [PMC free article] [PubMed] [Google Scholar]
- 10.Medicare and Health Care Chartbook. 105th Congress. http://www.gpo.gov/congress/house/ways-and-means/sec4.pdf Accessed March 27, 2008. [Google Scholar]
- 11.Riley GF, Potosky AL, Lubitz JD, Kessler LG. Medicare payments from diagnosis to death for elderly cancer patients by stage and diagnosis. Med Care. 1995;33(8):828–841. doi: 10.1097/00005650-199508000-00007. [DOI] [PubMed] [Google Scholar]
- 12.Finkler SA. The distinction between cost and charges. Ann Intern Med. 1982;96(1):102–109. doi: 10.7326/0003-4819-96-1-102. [DOI] [PubMed] [Google Scholar]
- 13.Burkhardt JH, SunshineCore-needle JH. surgical breast biopsy: comparison of three methods of assessing cost. Radiology. 1999;212(1):181–188. doi: 10.1148/radiology.212.1.r99jl46181. [DOI] [PubMed] [Google Scholar]
- 14.Brown ML, Knopf KB, Marcus SE, Lipscomb J. Economic Analysis and Clinical Research. In: Gallin JI, editor. Principles and Practice of Clinical Research. New York: Academic Press; 2002. pp. 275–304. [Google Scholar]
- 15.2007 Annual Report of the Boards of Trustees of the Federal Hospital Insurance and Federal Supplementary Medical Insurance Trust Funds Communication from the Boards of Trustees, Federal Hospital Insurance and Federal Supplementary Medical Insurance Trust Funds Transmitting. Table IV.A1—Components of Historical and Projected Increases in HI Inpatient Hospital Payments. GAF http://www.cms.hhs.gov/AcuteInpatientPPS/WIFN/list.asp?listpage=2. Accessed March 27, 2008. [Google Scholar]
- 16.Global Insight Inc. 1st Qtr. 2007 @USMACRO/CONTROL0307 @CISSIM/TL0207.SIM Historical Data through 4th Qtr, 2006. http://www.cms.hhs.gov/MedicareProgramRatesStats/downloads/mktbskt-economic-index.pdf Accessed November 14, 2007. [Google Scholar]
- 17.Medicare Economic Index. http://www.cms.hhs.gov/MedicareProgramRatesStats/downloads/mktbskt-economic-index.pdf Accessed November 14, 2007. [Google Scholar]
- 18.Geographic Practice Cost Indexes. http://www.cms.hhs.gov/PhysicianFeeSched/ Accessed November 14, 2007. [Google Scholar]
- 19.Medicare & Medicaid Statistical Supplement. http://www.cms.hhs.gov/MedicareMedicaidStatSupp/LT/itemdetail.asp?filterType=none&;filterByDID=0&sortByDID=2&sortOrder=ascending&itemID=CMS060322&intNumPerPage=10 Accessed February 12, 2008. [Google Scholar]
- 20.Yabroff KR, Mariotto AB, Feuer E, Brown ML. Projections of the costs associated with colorectal cancer care in the United States, 2000–2020 [published online ahead of print October 2, 2004] Health Economics. doi: 10.1002/hec.1307. [DOI] [PubMed] [Google Scholar]
- 21.Consensus Development Panel. National Institutes of Health Consensus Development Conference statement: adjuvant chemotherapy for breast cancer. September 9–11, 1985. CA Cancer J Clin. 1986;36(1):42–47. doi: 10.3322/canjclin.36.1.42. [DOI] [PubMed] [Google Scholar]
- 22.National Cancer Institute: clinical alert from the National Cancer Institute. Breast Cancer Res Treat. 1988;12(1):3–5. [Google Scholar]
- 23.NIH Consensus Conference: treatment of early-stage breast cancer. JAMA. 1991;265(3):391–395. [PubMed] [Google Scholar]
- 24.Adjuvant therapy for patients with colon and rectum cancer. NIH Consensus Statement Online. 1990;8(4):1–25. http://consensus.nih.gov/1990/1990AdjuvantTherapyColonRectalCancer079html.htm Accessed March 27, 2008. [PubMed] [Google Scholar]
- 25.Dillman RO, Seagren SL, Propert KJ, et al. A randomized trial of induction chemotherapy plus high-dose radiation versus radiation alone in stage III non-small-cell lung cancer. N Engl J Med. 1990;323(14):940–945. doi: 10.1056/NEJM199010043231403. [DOI] [PubMed] [Google Scholar]
- 26.Non-small Cell Lung Cancer Collaborative Group. Chemotherapy in non-small cell lung cancer: a meta-analysis using updated data on individual patients from 52 randomised clinical trials. BMJ. 1995;311(7010):899–909. [PMC free article] [PubMed] [Google Scholar]
- 27.Stephens RJ, Johnson DH. Treatment and outcomes for elderly patients with small cell lung cancer. Drugs Aging. 2000;17(3):229–247. doi: 10.2165/00002512-200017030-00006. [DOI] [PubMed] [Google Scholar]
- 28.Schrag D, Cramer LD, Bach PB, Begg CB. Age and adjuvant chemotherapy use after surgery for stage III colon cancer. J Natl Cancer Inst. 2001;93(11):850–857. doi: 10.1093/jnci/93.11.850. [DOI] [PubMed] [Google Scholar]
- 29.Earle CC, Tsai JS, Gelber RD, Weinstein MC, Neumann PJ, Weeks JC. Effectiveness of chemotherapy for advanced lung cancer in the elderly: instrumental variable and propensity analysis. J Clin Oncol. 2001;19(4):1064–1070. doi: 10.1200/JCO.2001.19.4.1064. [DOI] [PubMed] [Google Scholar]
- 30.August DA, Rea T, Sondak VK. Age-related differences in breast cancer treatment. Ann Surg Oncol. 1994;1(1):45–52. doi: 10.1007/BF02303540. [DOI] [PubMed] [Google Scholar]
- 31.Desch CE, Hillner BE, Smith TJ, Retchin SM. Should the elderly receive chemotherapy for node-negative breast cancer? A cost-effectiveness analysis examining total and active life-expectancy outcomes. J Clin Oncol. 1993;11(4):777–782. doi: 10.1200/JCO.1993.11.4.777. [DOI] [PubMed] [Google Scholar]
- 32.Elkin EB, Hurria A, Mitra N, Schrag D, Panageas KS. Adjuvant chemotherapy and survival in older women with hormone receptor-negative breast cancer: assessing outcome in a population-based, observational cohort. J Clin Oncol. 2006;24(18):2757–2764. doi: 10.1200/JCO.2005.03.6053. [DOI] [PubMed] [Google Scholar]
- 33.Delbado C, Micheils S, Syz N, Soria JC, Le Chevalier T, Pignon JP. Benefits of adding a drug to a single agent or a two agent chemotherapy regimen in advanced non-small cell lung cancer: a meta-analysis. JAMA. 2004;292:470–484. doi: 10.1001/jama.292.4.470. [DOI] [PubMed] [Google Scholar]
- 34.Ramsey SD, Moinpour CM, Lovato LC, et al. Economic analysis of vinorelbine plus cisplatin versus paclitaxel plus carboplatin for advanced non-small-cell lung cancer. J Natl Cancer Inst. 2002;94(4):291–297. doi: 10.1093/jnci/94.4.291. [DOI] [PubMed] [Google Scholar]
- 35.Schrag D. The price tag on progress—chemotherapy for colorectal cancer. N Engl J Med. 2004;351(4):317–319. doi: 10.1056/NEJMp048143. [DOI] [PubMed] [Google Scholar]
- 36.Burkhardt JH, Litwin MS, Rose CM, et al. Comparing the costs of radiation therapy and radical prostatectomy for the initial treatment of early-stage prostate cancer. J Clin Oncol. 2002;20(12):2869–2875. doi: 10.1200/JCO.2002.11.136. [DOI] [PubMed] [Google Scholar]
- 37.Jonkman JN, Normand SL, Wolf R, Borbas C, Guadagnoli E. Identifying a cohort of patients with early-stage breast cancer: a comparison of hospital discharge and primary data. Med Care. 2001;39(10):1105–1117. doi: 10.1097/00005650-200110000-00008. [DOI] [PubMed] [Google Scholar]
- 38.Cooper GS, Yuan Z, Stange KC, Dennis LK, Amini SB, Rimm AA. Agreement of Medicare claims and tumor registry data for assessment of cancer-related treatment. Med Care. 2000;38(4):411–421. doi: 10.1097/00005650-200004000-00008. [DOI] [PubMed] [Google Scholar]
- 39.Cooper GS, Virnig B, Klabunde CN, Schussler N, Freeman J, Warren JL. Use of SEER-Medicare data for measuring cancer surgery. Med Care. 2002:40. doi: 10.1097/00005650-200208001-00006. IV-43-8. [DOI] [PubMed] [Google Scholar]
- 40.Du X, Freeman JL, Warren JL, Nattinger AB, Zhang D, Goodwin JS. Accuracy and completeness of Medicare claims data for surgical treatment of breast cancer. Med Care. 2000;38(7):719–727. doi: 10.1097/00005650-200007000-00004. [DOI] [PubMed] [Google Scholar]
- 41.Javitt JC, McBean AM, Sastry SS, DiPaolo F. Accuracy of coding in Medicare part B claims. Cataract as a case study. Arch Ophthalmol. 1993;111(5):605–607. doi: 10.1001/archopht.1993.01090050039024. [DOI] [PubMed] [Google Scholar]
- 42.Hackbarth GM. Medicare cost-sharing and supplemental insurance. Statement to the House Subcommittee on Health. 2003 http://www.medpac.gov/publications/congressional_testimony/050103_medigap.pdf Accessed March 27, 2008. [Google Scholar]
- 43.Crystal S, Johnson RW, Harman J, Sambamoorthi U, Kumar R. Out-of-pocket health care costs among older Americans. J Gerontol B Psychol Sci Soc Sci. 2000;55(1):S51–S62. doi: 10.1093/geronb/55.1.s51. [DOI] [PubMed] [Google Scholar]