

Abstract
Rationale
Cardiac resynchronization therapy (CRT) is an established treatment for patients with chronic heart failure. However, CRT associated structural and functional remodeling at cellular and subcellular level is only partly understood.
Objective
To investigate the effects of CRT on subcellular structures and protein distributions associated with excitation-contraction coupling of ventricular cardiomyocytes.
Methods and results
Our studies revealed remodeling of the transverse tubular system (t-system) and the spatial association of ryanodine receptor (RyR) clusters in a canine model of dyssynchronous heart failure (DHF). We did not find this remodeling in a synchronous heart failure model based on atrial tachypacing. Remodeling in DHF ranged from minor alterations in anterior left ventricular myocytes to nearly complete loss of the t-system and dissociation of RyRs from sarcolemmal structures in lateral cells. After CRT, we found a remarkable and almost complete reverse remodeling of these structures despite persistent left ventricular dysfunction. Studies of whole cell Ca2+ transients showed that the structural remodeling and restoration were accompanied with remodeling and restoration of Ca2+ signaling.
Conclusions
DHF is associated with regional remodeling of the t-system. Myocytes undergo substantial structural and functional restoration after only 3 weeks of CRT. The finding suggests that t-system status can provide an early marker of the success of this therapy. The results could also guide us to an understanding of the loss and remodeling of proteins associated with the t-system. The steep relationship between free Ca2+ and contraction suggests that some restoration of Ca2+ release units will have a disproportionately large effect on contractility.
Keywords: dyssynchronous heart failure, cardiac resynchronization therapy, cellular remodeling, excitation-contraction coupling, transverse tubular system
Introduction
Heart failure (HF) is associated with a grim prognosis. For patients with moderate or severe symptoms annual mortality can be as high as 30-60 % despite pharmacologic treatment.1,2 Initial remodeling of structure, metabolism and electrophysiology probably compensates for defects produced by HF. These changes are ultimately maladaptive and may be associated with progression of the HF phenotype, arrhythmias and sudden cardiac death (SCD). It has been estimated that ∼40% of patients with HF develop conduction delays associated with dyssynchronous electrical activation and mechanical contraction of the left ventricle. This dyssynchronous activation is an independent predictor of both total mortality and SCD in HF patients.3 Simultaneous pacing of the right and left ventricles, a procedure called cardiac resynchronization therapy (CRT), is a major advance in the treatment of patients with moderate to severe chronic HF (New York Heart Association class III or IV). CRT alleviates the marked regional heterogeneity of ventricular function and mechanical loading. CRT reduces symptoms and mortality in about 70% of patients that exhibit resynchronization of mechanical contraction.1,2 However, exactly what causes improvements in heart function resulting from CRT and what subcellular mechanism(s) underlie this therapy are only poorly understood. It is even less clear why a significant number of patients do not benefit from CRT.
There is an extensive literature addressing the subcellular structural alterations in HF4-8 with some variability in structural and functional remodeling in differing forms of experimental and human HF. Some of the more consistent cellular features of HF are prolongation of action potential duration (APD), impaired contraction and impaired Ca2+ homeostasis with heterogeneous alterations in the amplitudes and kinetics of Ca2+ transients. The functional remodeling is associated with alterations in the mRNA and protein expression and post-translational modification of a number of proteins involved in Ca2+ signaling underlying EC coupling.9-11
We have used a canine pacing tachycardia model to study consequences and mechanisms of dyssynchronous heart failure (DHF) and CRT. In this model of DHF produced by left bundle branch ablation and rapid right atrial pacing, we have characterized the electrical and hemodynamic remodeling as well as changes in intracellular Ca2+ transients and a variety of channel and transporter proteins.11,12 We demonstrated that DHF causes dyssynchronous anterior-septal and lateral strain13 as well as dyssynchronous septal and lateral strain rates.14 Recently, we reported DHF associated changes in the regional cardiac transcriptome primarily of the left anterior wall.15 Some of these alterations are to some extent reversed by CRT, which also reduces regional heterogeneity of gene expression and dyssynchrony of strains and strain rates.
Remarkably, little is known about the reorganization of subcellular structures and protein distributions associated with excitation-contraction (EC) coupling during DHF and after CRT. The transverse tubular system (t-system) is a crucially important subcellular structure for efficient EC coupling.16-18 In ventricular cardiomyocytes this system consists of membrane invaginations, which are essential for rapid transmission of electrical signals from the outer sarcolemma into the cell interior. The t-system extends in close proximity to the sarcoplasmic reticulum, which allows their membrane proteins to form multimolecular complexes including L-type Ca2+ channels in the sarcolemma and ryanodine receptors (RyRs) in the membrane of the sarcoplasmic reticulum apposed to the t-tubules. These complexes are called couplons.19,20 Alterations of the t-system and the associated proteins unquestionably underlie many of the defects produced by HF.8,18 Three-dimensional (3D) microscopic imaging and image analysis are essential to fully understand the nature of structural remodeling of the t-system as this cannot be assessed in two-dimensional images.21 In particular the changes in density and orientation of subcellular structures can only be appreciated in 3D reconstructions. In addition, 3D imaging allows one to obtain a detailed understanding of any restoration of such structures as a result of CRT. Here, we investigated for the first time an initial remodeling of t-tubules and RyR clusters as a result of DHF and a remarkable and almost complete reverse remodeling of these structures after CRT despite the persistence of left ventricular dysfunction. Studies of whole cell Ca2+ transients revealed that both, structural remodeling and restoration, were accompanied by remodeling and restoration of Ca2+ signaling. Our findings of substantial restoration of structure and function after only 3 weeks of CRT suggest that the t-system can provide an early marker of the success of this therapy.
Methods
HF and CRT Models
The animal models of DHF and CRT have been described previously.13,22,23 In brief, adult male mongrel dogs were used as control, DHF and CRT models. DHF animals underwent right atrial pacing (200 bpm) for 6 weeks after radiofrequency ablation of the left bundle-branch. CRT animals underwent left bundle-branch radiofrequency ablation and 3 weeks of right atrial pacing followed by 3 weeks of resynchronization by biventricular pacing at the same pacing rate. We also studied animals without left bundle-branch ablation who underwent 6 weeks of right atrial pacing also at 200 bpm (A6) to generate a model of synchronous HF. Hemodynamic data were measured that characterize control, DHF, CRT and A6 animals. The data confirm that the paced animals in all groups develop HF and with the most depressed maximal upstroke of the left ventricular blood pressure (dP/dtmax) in the DHF animals (Online Table I). Myocytes were isolated enzymatically from the anterior and lateral mid myocardium of the left ventricle. We used cells from 10 control, 8 A6, 7 DHF and 11 CRT animals (Online Table II).
Labeling and Imaging of Sarcolemma and RyRs
Cells were labeled using wheat germ agglutinin (WGA) conjugated to Alexa Fluo-555 and monoclonal anti-RyR2 antibody with a secondary goat anti mouse IgG (H+L) antibody attached to Alexa Fluor 488 (further detail in the Online Supplemental Methods). 3D image stacks of labeled cells immersed in glycerol were acquired using a confocal microscope (LSM 5 Live Duo, Carl Zeiss, Jena, Germany) equipped with a 63× oil immersion lens (Numerical aperture 1.4). The imaging configuration is shown in Online Figure I. Details regarding our imaging protocol are provided in the Online Supplemental Methods. Online Table II presents the number of cells and animals that were applied for reconstruction, analysis and visualization.
Reconstruction of Sarcolemma and RyR clusters
The preprocessing of confocal microscopic images has been described in the Online Supplemental Material. The sarcolemma was detected by thresholding of the WGA image stacks followed by median filtering.24 The threshold was calculated from image statistics and set to mode+stddev. Image stacks were segmented in outer sarcolemmal, t-system, intra- and extracellular regions by morphological operators.25 Euclidean distance maps were calculated from the sarcolemmal regions. RyR clusters were extracted by maxima search and region-growing methods from the image stacks of anti-RyR2 antibody labeled myocytes. The threshold was set to mode+4 stddev. Centers of RyR clusters were identified by the centers of mass of segmented regions. Density (number of clusters per unit volume) and distances between RyR cluster centers were calculated to quantify the spatial distribution of RyR clusters. Distances of RyR clusters to the sarcolemma (including t-system) were determined from probing the distance maps at cluster centers.
Measurement and Analysis of Ca2+ Transients
Whole cell Ca2+ transients were measured and analyzed as described by us previously.11,12,25 Myocytes from the lateral left ventricle were incubated with the Ca2+ indicator Indo-1-AM (Molecular Probes, Eugene, OR). Measurements were performed at 37°C using 1 Hz field stimulation. The indicator was excited at a wavelength of 365 nm. Emitted light at 405 and 495 nm was collected with an inverted microscope (Ellipse TE2001, Nikon) equipped with an image/fluorescence system (MyoCam, IonOptix, MA). Signals were digitized and stored for subsequent analysis. The ratio of fluorescence at 405 and 495 nm (F405/485) was calculated after subtraction of cellular autofluorescence. The decay of the Ca2+ transients (tau) was determined by fitting a single exponential to the ratioed fluorescence. Each experimental group included cells from at least 3 animals.
Statistical Analysis
All statistical analyses of the image stacks were performed with Matlab 7.9. Density of RyR clusters, distances of RyR clusters to the sarcolemma and RyR-nearest neighbor distances are presented as mean±stddev. Significance of was determined by a two-tailed Student's t test using a 5% significance level.
Results
Spatial organization of t-tubules and RyRs in canine ventricular myocytes
We first studied control canine cells isolated from both the anterior and lateral walls of the left ventricle. The sarcolemma, including t-tubules, and RyRs were labeled with WGA conjugate and monoclonal antibodies, respectively. We obtained image stacks of myocyte segments (Online Figure I). Figure 1 displays the arrangement of t-tubules and RyR clusters in a segment of a myocyte isolated from the lateral wall of the left ventricle. T-tubules are arrayed regularly and appear in the vicinity of the z-disks as transverse rows (Figures 1A and 1C) in the y-axis. RyRs are clearly registered in the y-axis (Figures 1B and 1D) similarly to the t-tubules. This becomes clear in the overlay of WGA and RyR images (Figure 1E) where many RyR clusters appear co-localized with t-tubules and presumably form couplons. The image indicates that a significant number of RyR clusters are not associated with t-tubules. This is clearer in Figures 1F and 1G, which display 3D reconstructions of RyRs and t-tubules in the myocyte segment. The t-tubules and RyRs tend to form sheets in the vicinity of the z disks. Reconstructions of t-tubules and RyR clusters in control anterior cells displayed similar features (Online Figure II).
Figure 1. Imaging and reconstruction of cardiac myocytes from lateral left ventricle of normal canine.
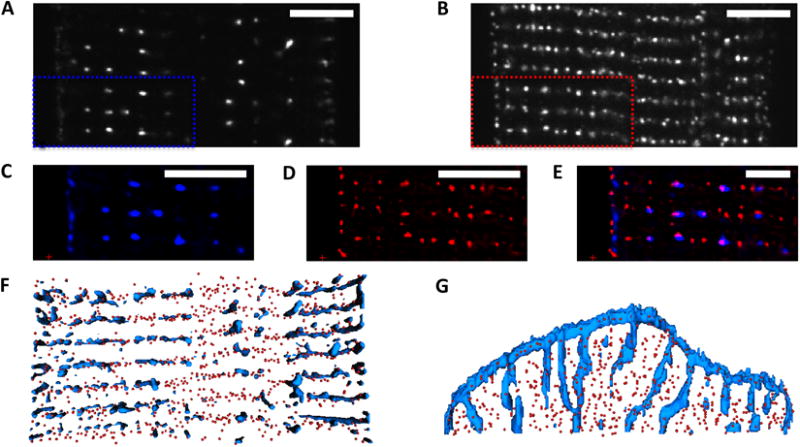
Confocal microscopic images of A, sarcolemma labeled with WGA and B, antibody labeled RyRs. C and D, Deconvolved images zooming into marked regions in A and B. WGA is shown in blue, RyRs in red. E, Overlay of images showing regular arrangement of t-system and RyR clusters. Three-dimensional reconstruction of WGA distribution and centers of RyR clusters, F, horizontal section from above, G, vertical section shown laterally). Scale bar: 5 μm.
A detailed analysis of the 3D reconstructions from anterior and lateral ventricular cells (Figure 2) revealed distances between centers of RyR clusters and the sarcolemma that are similar in both cell types (0.44±0.51μm and 0.41±0.49μm, respectively). Also a nearest neighbor analysis of RyRs did not show significant differences in anterior and lateral cells (0.62±0.37μm versus 0.63±0.38μm). We used Fourier analysis to characterize the spatial distribution of t-tubules and RyRs in 3D. The analysis was constrained to spatial frequencies corresponding to spatial periodicities of z-disks (2.0±0.5 μm). Intensity histograms were calculated in sectors with an opening angle of 10° (Online Figure III). Maxima in the Fourier histogram from RyRs and WGA images appear at the sectors to 90° (Figures 2C and 2D), which indicates regular arrangement of the labeled structures along the y-axis. A local maximum in the WGA Fourier histogram at 0-10° indicates regular arrangement of the t-tubules along the x-axis. The Fourier histograms are almost identical in both anterior and lateral cells.
Figure 2. Quantitative characterization of cardiac myocytes from lateral (LAT) and anterior (ANT) left ventricle of normal canine.
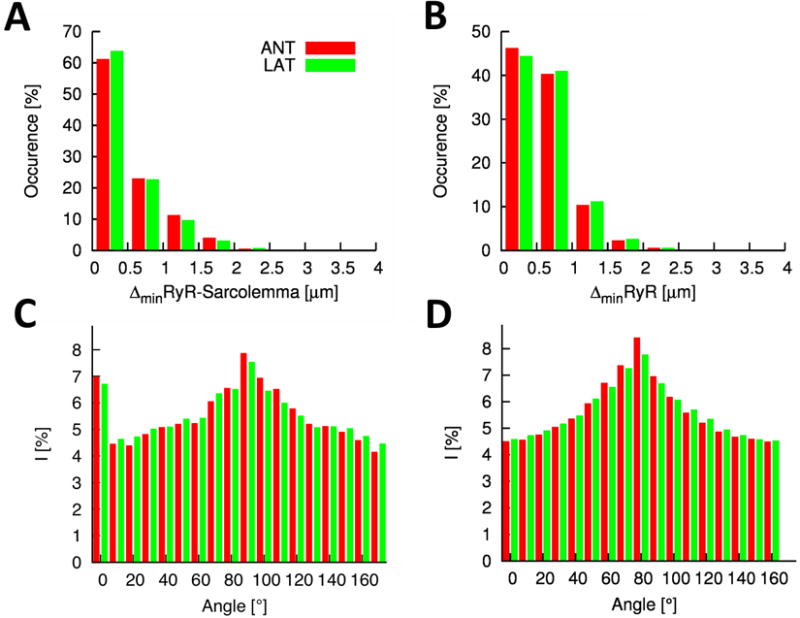
A, Histogram of distances between RyR clusters and the closest sarcolemma. The majority of RyR clusters is in close proximity of the sarcolemma. B, Histogram of distances of RyR clusters to their nearest neighbor. Fourier intensities of C, WGA and D, RyR labeled image stacks. Both intensity distributions exhibit a maxima close to 90° corresponding to y-axis components of the spectrum.
Characterization of t-tubules and RyRs in A6 myocytes
We analyzed A6 cells using the same methods as applied to control cells. Reconstructions of t-tubules and RyR clusters in A6 cells displayed features similar to control cells (Online Figure IV). Differences of the RyR cluster-sarcolemma distance between anterior and lateral cells were not significant (0.45±0.49μm and 0.41±0.47μm, respectively). Similarly, differences of the nearest neighbor distance of RyR clusters in the both cell types were not significant (0.64±0.40μm and 0.64±0.40μm, respectively). Control and A6 lateral cells exhibited insignificant differences for the RyR cluster density (0.44±0.08/μm3 versus 0.50±0.06/μm3).
Remodeling of t-tubules and RyR distributions in myocytes after DHF
We used the described methods to study the alterations in distribution of t-tubules and RyRs in isolated left ventricular cells taken from dog hearts six weeks after left bundle branch ablation and rapid atrial pacing. Using this protocol the hearts had exhibited severe systolic dysfunction and the animals were in HF. We examined cells from both the lateral and anterior ventricular walls. Anterior cells from DHF ventricles did not show striking alterations when they were visually compared with control cells. This is apparent in the deconvolved images and reconstructions displayed in Figure 3A. However, in lateral ventricular cells it is immediately apparent that the t-tubular system was dramatically remodeled. A striking example is presented in Figure 3B. The t-system is sparse centrally. T-tubules in the cell periphery exhibit longitudinal components. Furthermore, the cell shows a loss of alignment of RyRs. A less extreme case of t-tubule remodeling is shown in Figure 3C. These consequences of DHF are apparent in the two dimensional optical slices, the 3D reconstructions viewed from the above the myocyte and along the major axis of the myocyte. An effect of t-system remodeling in DHF is that the majority of RyRs are not associated with sarcolemmal structures. In comparison to control and A6, distances between RyR clusters and the nearest sarcolemma increased significantly in DHF lateral cells (0.66±0.72μm), but not in anterior cells (0.48±0.58μm) (Figure 3D). The nearest neighbor distance of RyR clusters showed little change between anterior and lateral cells (0.63±0.38μm and 0.59±0.35μm, respectively) and when compared to control and A6 cells (Figure 3E versus Figure 2B and Online Figure IVD).
Figure 3. Characterization of cardiac myocytes from left ventricle of DHF canine.
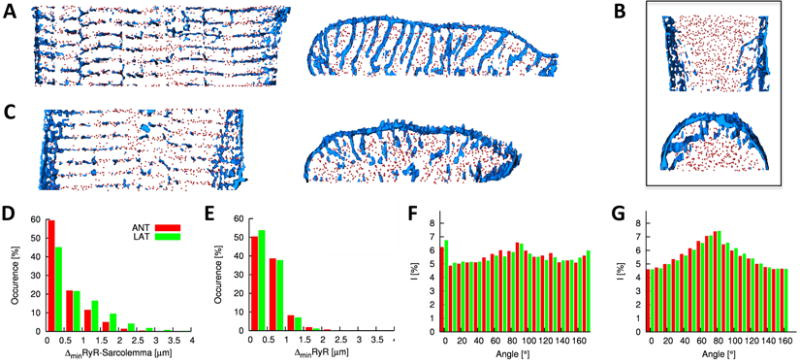
Deconvolved confocal microscopic images and 3D reconstructions of segment of A, anterior and B and C, lateral cells. Lateral cells exhibit structural alterations, in particular, sparseness and increased longitudinal components of the t-system, and reduced alignment of RyR clusters. Histogram of D, distances between RyR clusters and the closest sarcolemma and E, distances of RyR clusters to their nearest neighbor. Fourier intensities of F, WGA and G, RyR labeled image stacks.
Again we used Fourier analysis to characterize the spatial distribution of t-tubules and RyRs from anterior and lateral DHF cells (Figures 3F and 3G). Maxima in the Fourier histogram from WGA images appear for sectors at 0-10° and 90-100° for both cell types (Figure 3F). In comparison to normal cells (Figure 2C), the maximum indicating regular arrangement of the t-tubules along the y-axis is reduced. The Fourier histograms from RyR images indicate that the arrangement of RyR clusters is similar in normal and DHF cells of both types (Figure 3G versus Figure 2D). This type of analysis allowed us to describe changes in the distribution of RyRs and t-tubules in both DHF cells and after these cells have been subject to CRT.
Partial restoration of t-tubules and RyR distributions after CRT
We investigated the spatial distributions of t-tubules and RyRs in myocytes after they had been paced to induce DHF for three weeks and were then subject to rapid pacing CRT for three weeks. The effects on these structures were not distributed uniformly throughout the heart. First, because DHF produces relatively small effects in anterior cells it is perhaps not surprising to find that there was little effect of CRT on these cell types and this is clear from Figure 4A. However, there was a remarkable reverse structural remodeling of t-tubules after CRT in lateral cells. This is obvious from visual inspection of Figure 4B and is particularly apparent in the 3D reconstruction of the cell segment viewed from the z- (middle panel) and y-direction (right panel). RyR-nearest sarcolemma distances were 0.40±0.50μm and 0.48±0.57μm for anterior and lateral cells, respectively. Our measurements of RyR-nearest sarcolemma distances (Figure 4C versus Figure 3D) indicate that the t-system is not completely restored but the remodeling is striking with t-tubules assuming a more normal distribution i.e. resembling controls. Some longitudinal components of the t-system remain but these are reduced. CRT did not affect the nearest neighbor distance of RyR clusters in anterior and lateral cells (0.59±0.35μm and 0.61±0.36μm, respectively) (Figure 4D), which was also not altered in DHF in both cell types. Maxima in the Fourier histogram from WGA images appear at similar sectors for images from CRT and DHF cells (Figure 4E). Also, the Fourier histograms from RyR images indicate that the arrangement of RyR clusters is similar in CRT and DHF cells of both types (Figure 4F versus Figure 3G).
Figure 4. Characterization of cardiac myocytes from left ventricle of canine after CRT.
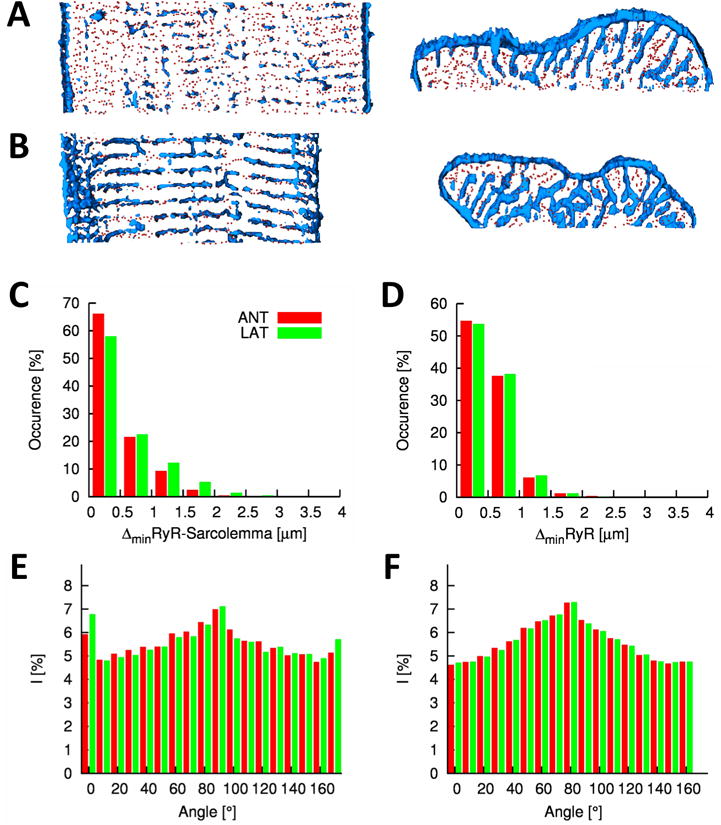
Deconvolved confocal microscopic images and 3D reconstructions of segment of A, anterior and B, lateral cells. Histogram of C, distances between RyR clusters and the closest sarcolemma and D, distances of RyR clusters to their nearest neighbor. Fourier intensities of E, WGA and F, RyR labeled image stacks.
Quantitative analysis of the effects of DHF and CRT on subcellular structure
A summary and statistical analysis of the results are presented in Figure 5. A striking marker of t-system remodeling is the RyR-sarcolemma distance (Figure 5A). In lateral myocytes a significant increase is associated with DHF, which was substantially restored by CRT. Compared to control neither DHF nor CRT caused alterations of the nearest neighbor distance (Figure 5B). Differences of the density of RyR clusters were not significant for control versus DHF as well as A6 versus CRT (Figure 5C). The spatial arrangement of the t-system and RyR was characterized by the ratio of intensities associated with the longitudinal axis of cells to the overall intensities in the WGA and RyR image stacks, respectively. In comparison to control and A6, DHF was associated with a reduced longitudinal intensity ratio of WGA signals in both, lateral and anterior cells (Figure 5D). This reduction indicates a less regular longitudinal spacing of the t-system in DHF. After CRT, the longitudinal intensity ratio was partially restored in lateral and anterior cells. However, in comparison to control the longitudinal intensity ratio remained at reduced levels after CRT. DHF was associated with a slightly reduced longitudinal intensity ratio of RyR signals in anterior cells, but not in lateral cells (Figure 5E). CRT cells exhibited a significant, albeit small reduction of longitudinal intensity ratios of RyR signals in both cell types versus control. The differences between DHF and CRT cells were not significant indicating that CRT was not able to restore the spatial arrangement of RyR clusters.
Figure 5. Structural characterization of control, DHF and CRT cells.
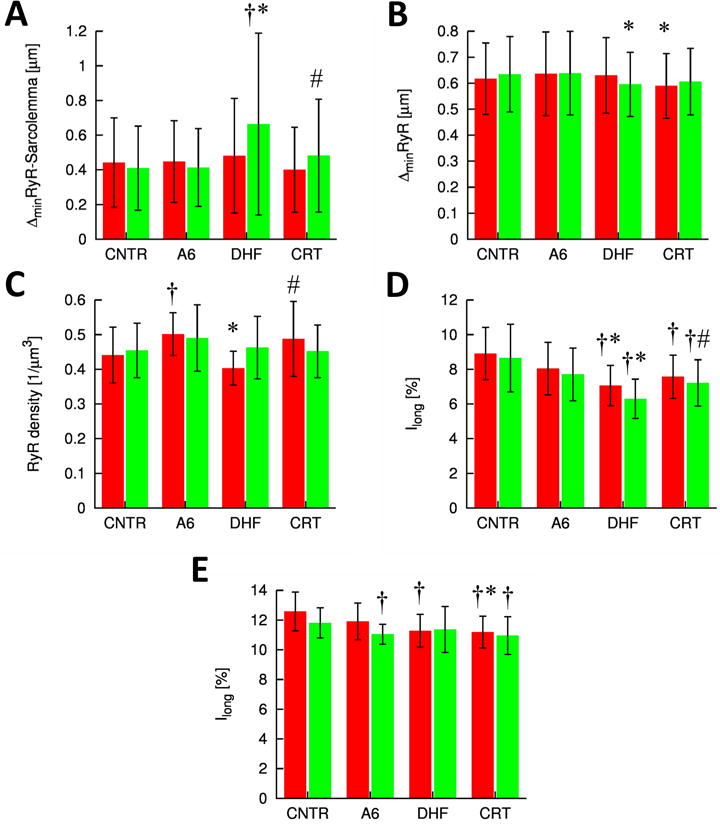
A, Distances of RyR clusters to closest sarcolemma. B, Nearest neighbor distances of RyR cluster centers. C, Density of RyR clusters. The t-system and RyR arrangement were characterized in D, WGA and E, RyR image stacks, respectively, by the normalized magnitudes of longitudinal frequency. † p<0.05 versus control, * p<0.05 versus A6, # p<0.05 versus DHF.
Analysis of effects of DHF and CRT on Ca2+ transients
Since we observed significant disorganization of structures associated with EC coupling in DHF we expected to observe reduced Ca2+ transients in the cardiomyocytes in which we observed structural disorganization. We measured Ca2+ transients in the presence and absence of β-adrenergic stimulation with isoproterenol, which among other things increases the peak and time to peak of transients (Figure 6A). There was, as expected, a reduction of the Ca2+ transient peak (Figure 6B), increased time to peak (TTP) (Figure 6C) and slowed Ca2+ extrusion (Figures 6D and 6E) as a result of DHF regardless of whether or not cells were treated with isoproterenol. CRT restored the peak transient and TTP to values similar to those observed for control. Also, Ca2+ extrusion in CRT cells in the absence of β-adrenergic stimulation was accelerated versus DHF cells, but not significantly different compared to control cells. This is consistent with the restoration of structure that we observed. Notably, our analysis revealed some differences between control and CRT cells in the presence of β-adrenergic stimulation. In the presence of isoproterenol, Ca2+ extrusion in CRT cells was slowed versus control. Also, CRT cells did not show a significant adrenergic response for the measures of Ca2+ extrusion.
Figure 6. Characterization of Ca2+ transients in control, DHF and CRT cells from lateral left ventricle.
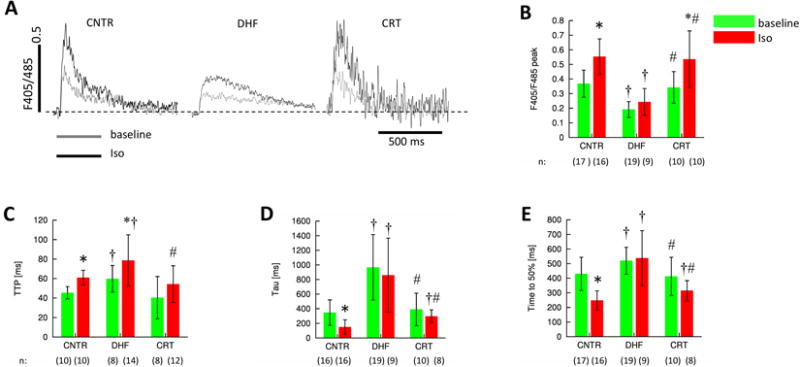
Ca2+ transients were evoked by field stimulation and measured by indo-1 fluorescence. A, Representative ratio-ed fluorescent signals at base line and after application of isoproterenol. Analyses of these signals yielded B, peak amplitudes, C, time to peak (TTP), D, the time constant (tau) of the Ca2+ transient decay, and E, the time to 50% decay. DHF cells exhibit slowed and attenuated Ca2+ transients, which are normalized by CRT. † p<0.05 versus control, # p<0.05 versus DHF, * p<0.05 versus baseline. n: Number of cells.
Discussion
Despite the success of CRT in clinical treatment of patients with HF and cardiac dyssynchrony1, 2, little is known about restoration of subcellular structures and functions related to EC coupling. Fluorescent labeling, 3D confocal microscopy and image analysis provide a quantitative way of describing subcellular structures, their remodeling and restoration. Using this approach, we demonstrated for the first time substantial remodeling of the t-system as a deleterious consequence of DHF and subsequent structural restoration of the t-system that result from CRT. In addition, we characterized the location of specific effects of DHF-associated structural remodeling of the t-system and its relationship to RyR clusters. Remodeling of t-tubules in DHF ranged from minor alterations in anterior left ventricular cells to nearly complete depletion in lateral cells. Our analyses did not reveal remodeling of the t-system by atrial tachypacing, indicating that remodeling in DHF is a consequence of cardiac dyssynchrony and its regional effects.
Ca2+ transients of cardiac myocytes are attenuated and Ca2+ extrusion is slowed in various models of HF, including our DHF model. We demonstrated previously that these alterations were particularly prominent in cells isolated from the lateral wall and that these features of Ca2+ transients were partially restored after CRT with more pronounced improvement in lateral cells.11 Here, we showed an increase of TTP for lateral DHF cells and restoration of TTP after CRT to control values. This restoration of Ca2+ transients is difficult to explain by changes of expression levels of proteins involved in Ca2+ signaling and their RNA messenger levels. Cav1.2 expression and messenger levels were not altered in DHF and after CRT.11 RyR2 and SERCA2 levels declined in DHF and were not restored by CRT. A number of studies have demonstrated the depletion of the t-system in HF4-7, ischemia26, and cell culture.27,28 Studies on cultured ovine myocytes demonstrated that as a result of t-tubular loss sparks cease to be well-synchronized.28 This would significantly reduce the efficiency of EC coupling by among other things producing reduced and inhomogeneous Ca2+ transients. Since t-tubules and the associated RyR clusters are essential for normal EC coupling and Ca2+ transients are partially restored by CRT we hypothesized that CRT would produce a restoration of the structure of the t-system and its relationship to RyRs. We suggest that the restoration revealed by our study can in part account for the restoration of Ca2+ transients that were observed as a result of CRT and are clearly essential for the restoration of function that is known to occur as a result of CRT.
In agreement with our results several authors have demonstrated a loss or remodeling of t-tubules in HF. This is apparent in failing human heart28,29 and has also been observed in other species, for example, in a murine model of myocardial infarction induced congestive HF30, a rat model of aortic-banding induced failure7 and a canine model based on tachypacing from an epicardial left ventricular site.4,5 An exception appears in the results obtained by Ohler et al who did not observe statistically significant loss of t-tubular surface area or volume in a study on a small number of failing human hearts with diverse conditions (2 hearts with dilated cardiomyopathy, 1 heart will familial cardiomyopathy, and 1 heart with ischemic cardiomyopathy).6 It is unclear what explains this exception or if the studied hearts exhibited electrical or mechanical dyssynchrony. It is however clear from a number of studies28, 30, 31 that Ca2+ release appears to be delayed or asynchronous in cells from hearts progressing to or in failure. This is particularly apparent in the studies of Litwin et al on myocytes from infarcted hearts.31 These authors observed highly asynchronous sparks and in the absence of structural studies this finding remains unexplained. In those cases where asynchrony is associated with t-tubular loss it is likely due to spatially inhomogeneous release of Ca2+. Eventually Ca2+ from couplons will spread to regions where release does not occur. This will amplify any asynchronous release of Ca2+ from couplons. Even if couplons are activated in a highly synchronous fashion, with missing release sites inhomogeneity of Ca2+ release from couplons will lead to the asynchronous appearance of Ca2+ in the cytosol. Inhomogeneous and/or asynchronous Ca2+ release in cells with reduced and/or disorganized t-tubules will reduce the cell's ability to shorten. In regions where sarcomeres are first exposed to Ca2+ they will shorten. If they are in series with other sarcomeres that have not been exposed to Ca2+ because its appearance is delayed the activated sarcomeres will shorten against the compliance of sarcomeres, which have not been activated. This will continue until either shortening of activated sarcomeres is complete or inactivated sarcomeres start to activate. This will have a tendency to reduce cellular shortening particularly if the effect is extensive. Gao et al reported that cardiac force generation in intact ventricular tissue has an extremely steep dependence on Ca2+ with a Hill coefficient of 4.87.32 This steep relationship has been suggested to amplify effects of inhomogeneous Ca2+ delivery on cell shortening previously.33 Indeed, Song et al point out that at -30 mV when local Ca2+ release events are asynchronous cell shortening is barely detectable.33 This can explain the dramatic weakening of contraction that results from HF. Any mechanism that restores t-tubules will add homogeneity to cytosolic Ca2+ increases and has a disproportionately large effect on the restoration of shortening. Again this is because the relationship between contractility and Ca2+ is steep. Thus a relatively modest restoration of t-tubules and release sites could have a pronounced effect on contractility. We assume that this is one reason for the efficacy of CRT.
Although we can clearly document depletion and disorganization of the t-system and, to a lesser extent, RyR clusters in DHF as well as their reorganization upon CRT, the mechanisms underlying these alterations remain unclear. It is known that gene expression changes during DHF 34 and this change is to some extent restored during CRT.15 While the studies indicated that transcriptional alterations were particularly apparent in anterior cells, it is the late activated lateral wall that undergoes the greatest stress in DHF and a major stress reduction during CRT via biventricular pacing. Changes in stress could in principle activate sarcolemmal stretch activated ion channels and provide a signal, for example Ca2+, that precipitates a cascade of events leading either to remodeling or restoration of the structures that we have studied. A similar effect could occur at the nuclear envelope and it will be of interest to determine whether deformation of the nucleus by for example stretch precipitates ion fluxes (e.g. Ca2+) that could function as signals that ultimately lead to changes in genomic expression responsible for remodeling. An alternative possibility is that alterations in mechanical stress during DHF directly affect the structure of t-tubules and in turn directly influence the maintenance of t-system organization. This alternative is supported by studies demonstrating marked differences in strain profiles in DHF11-13 and transmission of cellular strain to the t-system in ventricular myocytes.35 Alterations of tissue strain (or stress) can be expected also in other models of HF, for instance, infarction and left ventricular tachypacing models, with demonstrated t-system remodeling.
We suggest that t-system restoration can serve as a complementary marker of CRT success. Assessment of CRT success will become even more important in the future as recommendations for CRT applications are extended for New York Heart Association Classes I and II.36 Since not all HF patients respond to CRT an early marker of the benefit of CRT may inform decisions regarding continued pacing or alternative therapeutic strategies. By applying the labeling and imaging approaches that we describe to cardiac biopsies it should be possible to rapidly assess the efficacy of CRT.21,37 Also, recently developed fiber optic confocal microscopy in conjunction with established catheter technology may provide information on t-system organization of myocytes in situ.38 However, limitations of this approach are associated with its invasiveness and the effort needed, in particular, in comparison to established indices of resynchronization.
It should be recognized that in the model of CRT that we employed, mechanical synchrony is restored however tachycardia pacing is continued to maintain HF. Thus in this study t-system restoration does not coincide with the restoration of hemodynamic function during CRT (Online Table I). Hemodynamic function in CRT animals was in many aspects similar to animals undergoing 6 weeks of atrial tachypacing (A6). T-system restoration was apparent after 3 weeks in CRT. The restoration of the t-system architecture appears to be a marker of reduction in regional heterogeneity in loading and stress in the left ventricle rather than improvement in ventricular function per se. Our data suggest that the exaggerated differences in regional stresses have profound and direct effects on subcellular structure of myocytes. Moreover these subcellular changes alter the spatial relationships of key components of Ca2+ signaling and are consistent with defects in Ca2+ transients observed in cells from DHF hearts. Remarkably, even in the context of ongoing HF, the subcellular changes in the high stress lateral wall of the left ventricle are reversible with restoration of electrical and mechanical synchrony produced by CRT. The reversal of the subcellular structural alterations not only contributes to improvement in Ca2+ homeostasis, but might also arrest the progression in the HF phenotype in patients that respond to CRT.
Supplementary Material
Novelty and Significance.
What is known?
Cardiac resynchronization therapy (CRT) reduces symptoms and mortality in patients affected by dyssynchronous heart failure (DHF).
DHF is caused by dyssynchronous electrical and mechanical activation of the left and right ventricle.
Remodeling of electrophysiological properties, hemodynamics and protein expression due to DHF is partially restored by CRT.
What New Information Does This Article Contribute?
DHF is associated with structural remodeling of the transverse tubular system (t-system) and its spatial relationship to ryanodine receptor clusters in lateral left ventricular myocytes, which also exhibited reduced and slowed calcium transients.
After CRT, we found restoration of the t-system, its spatial relationship to ryanodine receptor clusters and the calcium transient.
A heart failure model based on tachypacing did not exhibit significant depletion and disorganization of the t-system suggesting that dyssynchrony underlies changes that we found in DHF.
This study was designed to investigate subcellular remodeling underlying DHF and CRT in a large animal model. We applied scanning confocal microscopy to generate three-dimensional reconstructions of the t-system and ryanodine receptor clusters in segments of isolated cells. Analyses of reconstructions of DHF cells revealed regional depletion and disorganization of the t-system and alterations of its spatial relationship to ryanodine receptor clusters. These structures were restored by CRT. Structural remodeling and restoration were accompanied with remodeling and restoration of calcium transients. Our approach opens the possibility of investigating the causes of remodeling of subcellular structure after DHF and CRT, including changes in genome expression and protein distributions as well as alterations in mechanical stress. Our findings suggest that the organization of t-system can provide an early marker for the success of CRT.
Acknowledgments
We thank Mrs. Deborah DiSilvestre and Dr. Philip R. Ershler for expert technical assistance. We thank Dr. Kenneth Spitzer for useful discussions.
Sources of Funding: The study has been supported by NIH grants R01 HL094464 (FBS) and PO1 HL077180 (DAK, GFT, TA), the Richard A. and Nora Eccles Fund for Cardiovascular Research and awards from the Nora Eccles Treadwell Foundation (JHB, FBS).
Non-standard abbreviations
- CRT
cardiac resynchronization therapy
- t-system
transverse tubular system
- DHF
dyssynchronous heart failure
Footnotes
Disclosures: Dr. Kass has served as a consultant to or on the advisory board of Boston Scientific Consulting. The other authors report no conflicts.
References
- 1.Cleland JG, Daubert JC, Erdmann E, Freemantle N, Gras D, Kappenberger L, Tavazzi L. The effect of cardiac resynchronization on morbidity and mortality in heart failure. N Engl J Med. 2005;352:1539–1549. doi: 10.1056/NEJMoa050496. [DOI] [PubMed] [Google Scholar]
- 2.Bristow MR, Saxon LA, Boehmer J, Krueger S, Kass DA, De Marco T, Carson P, DiCarlo L, DeMets D, White BG, DeVries DW, Feldman AM. Cardiac-resynchronization therapy with or without an implantable defibrillator in advanced chronic heart failure. N Engl J Med. 2004;350:2140–2150. doi: 10.1056/NEJMoa032423. [DOI] [PubMed] [Google Scholar]
- 3.Iuliano S, Fisher SG, Karasik PE, Fletcher RD, Singh SN. Qrs duration and mortality in patients with congestive heart failure. Am Heart J. 2002;143:1085–1091. doi: 10.1067/mhj.2002.122516. [DOI] [PubMed] [Google Scholar]
- 4.He JQ, Conklin MW, Foell JD, Wolff MR, Haworth RA, Coronado R, Kamp TJ. Reduction in density of transverse tubules and l-type ca2+ channels in canine tachycardia-induced heart failure. Cardiovasc Res. 2001;49:298–307. doi: 10.1016/s0008-6363(00)00256-x. [DOI] [PubMed] [Google Scholar]
- 5.Balijepalli RC, Lokuta AJ, Maertz NA, Buck JM, Haworth RA, Valdivia HH, Kamp TJ. Depletion of t-tubules and specific subcellular changes in sarcolemmal proteins in tachycardia-induced heart failure. Cardiovasc Res. 2003;59:67–77. doi: 10.1016/s0008-6363(03)00325-0. [DOI] [PubMed] [Google Scholar]
- 6.Ohler A, Weisser-Thomas J, Piacentino V, Houser SR, Tomaselli GF, O'Rourke B. Two-photon laser scanning microscopy of the transverse-axial tubule system in ventricular cardiomyocytes from failing and non-failing human hearts. Cardiol Res Pract. 2009;2009:802373. doi: 10.4061/2009/802373. [DOI] [PMC free article] [PubMed] [Google Scholar]
- 7.Wei S, Guo A, Chen B, Kutschke W, Xie YP, Zimmerman K, Weiss RM, Anderson ME, Cheng H, Song LS. T-tubule remodeling during transition from hypertrophy to heart failure. Circ Res. 2010;107:520–531. doi: 10.1161/CIRCRESAHA.109.212324. [DOI] [PMC free article] [PubMed] [Google Scholar]
- 8.Louch WE, Sejersted OM, Swift F. There goes the neighborhood: Pathological alterations in t-tubule morphology and consequences for cardiomyocyte ca2+ handling. J Biomed Biotechnol. 2010;2010:503906. doi: 10.1155/2010/503906. [DOI] [PMC free article] [PubMed] [Google Scholar]
- 9.Brillantes AM, Allen P, Takahashi T, Izumo S, Marks AR. Differences in cardiac calcium release channel (ryanodine receptor) expression in myocardium from patients with end- stage heart failure caused by ischemic versus dilated cardiomyopathy. Circ Res. 1992;71:18–26. doi: 10.1161/01.res.71.1.18. [DOI] [PubMed] [Google Scholar]
- 10.Reinecke H, Studer R, Better R, Just H, Holtz J, Drexler H. Enhanced expression and function of the cardiac sodium-calcium exchanger in end-stage human heart failure. Circulation. 1993;88:I–408. [Google Scholar]
- 11.Aiba T, Hesketh GG, Barth AS, Liu T, Daya S, Chakir K, Dimaano VL, Abraham TP, O'Rourke B, Akar FG, Kass DA, Tomaselli GF. Electrophysiological consequences of dyssynchronous heart failure and its restoration by resynchronization therapy. Circulation. 2009;119:1220–1230. doi: 10.1161/CIRCULATIONAHA.108.794834. [DOI] [PMC free article] [PubMed] [Google Scholar]
- 12.Chakir K, Daya SK, Aiba T, Tunin RS, Dimaano VL, Abraham TP, Jaques-Robinson KM, Lai EW, Pacak K, Zhu WZ, Xiao RP, Tomaselli GF, Kass DA. Mechanisms of enhanced beta-adrenergic reserve from cardiac resynchronization therapy. Circulation. 2009;119:1231–1240. doi: 10.1161/CIRCULATIONAHA.108.774752. [DOI] [PMC free article] [PubMed] [Google Scholar]
- 13.Chakir K, Daya SK, Tunin RS, Helm RH, Byrne MJ, Dimaano VL, Lardo AC, Abraham TP, Tomaselli GF, Kass DA. Reversal of global apoptosis and regional stress kinase activation by cardiac resynchronization. Circulation. 2008;117:1369–1377. doi: 10.1161/CIRCULATIONAHA.107.706291. [DOI] [PubMed] [Google Scholar]
- 14.Chakir K, Depry C, Dimaano VL, Zhu WZ, Vanderheyden M, Bartunek J, Abraham TP, Tomaselli GF, Liu SB, Xiang YK, Zhang M, Takimoto E, Dulin N, Xiao RP, Zhang J, Kass DA. Galphas-biased beta2-adrenergic receptor signaling from restoring synchronous contraction in the failing heart. Sci Transl Med. 2011;3:100ra188. doi: 10.1126/scitranslmed.3001909. [DOI] [PMC free article] [PubMed] [Google Scholar]
- 15.Barth AS, Aiba T, Halperin V, DiSilvestre D, Chakir K, Colantuoni C, Tunin RS, Dimaano VL, Yu W, Abraham TP, Kass DA, Tomaselli GF. Cardiac resynchronization therapy corrects dyssynchrony-induced regional gene expression changes on a genomic level. Circ Cardiovasc Genet. 2009;2:371–378. doi: 10.1161/CIRCGENETICS.108.832345. [DOI] [PMC free article] [PubMed] [Google Scholar]
- 16.Nelson DA, Benson ES. On the structural continuities of the transverse tubular system of rabbit and human myocardial cells. J Cell Biol. 1963;16:297–313. doi: 10.1083/jcb.16.2.297. [DOI] [PMC free article] [PubMed] [Google Scholar]
- 17.Fawcett DW, McNutt NS. The ultrastructure of the cat myocardium. I. Ventricular papillary muscle. J Cell Biol. 1969;42:1–45. doi: 10.1083/jcb.42.1.1. [DOI] [PMC free article] [PubMed] [Google Scholar]
- 18.Brette F, Orchard C. T-tubule function in mammalian cardiac myocytes. Circ Res. 2003;92:1182–1192. doi: 10.1161/01.RES.0000074908.17214.FD. [DOI] [PubMed] [Google Scholar]
- 19.Franzini-Armstrong C, Protasi F, Ramesh V. Shape, size, and distribution of ca(2+) release units and couplons in skeletal and cardiac muscles. Biophys J. 1999;77:1528–1539. doi: 10.1016/S0006-3495(99)77000-1. [DOI] [PMC free article] [PubMed] [Google Scholar]
- 20.Stern MD, Lakatta EG. Excitation-contraction coupling in the heart: The state of the question. FASEB J. 1992;6:3092–3100. doi: 10.1096/fasebj.6.12.1325933. [DOI] [PubMed] [Google Scholar]
- 21.Savio-Galimberti E, Frank J, Inoue M, Goldhaber JI, Cannell MB, Bridge JH, Sachse FB. Novel features of the rabbit transverse tubular system revealed by quantitative analysis of three-dimensional reconstructions from confocal images. Biophys J. 2008;95:2053–2062. doi: 10.1529/biophysj.108.130617. [DOI] [PMC free article] [PubMed] [Google Scholar]
- 22.Spragg DD, Akar FG, Helm RH, Tunin RS, Tomaselli GF, Kass DA. Abnormal conduction and repolarization in late-activated myocardium of dyssynchronously contracting hearts. Cardiovasc Res. 2005;67:77–86. doi: 10.1016/j.cardiores.2005.03.008. [DOI] [PubMed] [Google Scholar]
- 23.Leclercq C, Faris O, Tunin R, Johnson J, Kato R, Evans F, Spinelli J, Halperin H, McVeigh E, Kass DA. Systolic improvement and mechanical resynchronization does not require electrical synchrony in the dilated failing heart with left bundle-branch block. Circulation. 2002;106:1760–1763. doi: 10.1161/01.cir.0000035037.11968.5c. [DOI] [PubMed] [Google Scholar]
- 24.Sachse FB, Savio-Galimberti E, Goldhaber JI, Bridge JH. Towards computational modeling of excitation-contraction coupling in cardiac myocytes: Reconstruction of structures and proteins from confocal imaging. Pac Symp Biocomput. 2009:328–339. doi: 10.1142/9789812836939_0031. [DOI] [PMC free article] [PubMed] [Google Scholar]
- 25.O'Rourke B, Kass DA, Tomaselli GF, Kaab S, Tunin R, Marban E. Mechanisms of altered excitation-contraction coupling in canine tachycardia-induced heart failure, i: Experimental studies. Circ Res. 1999;84:562–570. doi: 10.1161/01.res.84.5.562. [DOI] [PubMed] [Google Scholar]
- 26.Heinzel FR, Bito V, Biesmans L, Wu M, Detre E, von Wegner F, Claus P, Dymarkowski S, Maes F, Bogaert J, Rademakers F, D'Hooge J, Sipido K. Remodeling of t-tubules and reduced synchrony of ca2+ release in myocytes from chronically ischemic myocardium. Circ Res. 2008;102:338–346. doi: 10.1161/CIRCRESAHA.107.160085. [DOI] [PubMed] [Google Scholar]
- 27.Mitcheson JS, Hancox JC, Levi AJ. Action potentials, ion channel currents and transverse tubule density in adult rabbit ventricular myocytes maintained for 6 days in cell culture. Pflugers Arch. 1996;431:814–827. doi: 10.1007/s004240050073. [DOI] [PubMed] [Google Scholar]
- 28.Louch WE, Bito V, Heinzel FR, Macianskiene R, Vanhaecke J, Flameng W, Mubagwa K, Sipido KR. Reduced synchrony of ca2+ release with loss of t-tubules - a comparison to ca2+ release in human failing cardiomyocytes. Cardiovasc Res. 2004;62:63–73. doi: 10.1016/j.cardiores.2003.12.031. [DOI] [PubMed] [Google Scholar]
- 29.Crossman DJ, Ruygrok PR, Soeller C, Cannell MB. Changes in the organization of excitation-contraction coupling structures in failing human heart. PLoS One. 2011;6:e17901. doi: 10.1371/journal.pone.0017901. [DOI] [PMC free article] [PubMed] [Google Scholar]
- 30.Louch WE, Mork HK, Sexton J, Stromme TA, Laake P, Sjaastad I, Sejersted OM. T-tubule disorganization and reduced synchrony of ca2+ release in murine cardiomyocytes following myocardial infarction. J Physiol. 2006;574:519–533. doi: 10.1113/jphysiol.2006.107227. [DOI] [PMC free article] [PubMed] [Google Scholar]
- 31.Litwin SE, Zhang D, Bridge JH. Dyssynchronous ca(2+) sparks in myocytes from infarcted hearts. Circ Res. 2000;87:1040–1047. doi: 10.1161/01.res.87.11.1040. [DOI] [PubMed] [Google Scholar]
- 32.Gao WD, Backx PH, Azan-Backx M, Marban E. Myofilament ca2+ sensitivity in intact versus skinned rat ventricular muscle. Circ Res. 1994;74:408–415. doi: 10.1161/01.res.74.3.408. [DOI] [PubMed] [Google Scholar]
- 33.Song LS, Wang SQ, Xiao RP, Spurgeon H, Lakatta EG, Cheng H. Beta-adrenergic stimulation synchronizes intracellular ca(2+) release during excitation-contraction coupling in cardiac myocytes. Circ Res. 2001;88:794–801. doi: 10.1161/hh0801.090461. [DOI] [PubMed] [Google Scholar]
- 34.Kittleson MM, Minhas KM, Irizarry RA, Ye SQ, Edness G, Breton E, Conte JV, Tomaselli G, Garcia JG, Hare JM. Gene expression analysis of ischemic and nonischemic cardiomyopathy: Shared and distinct genes in the development of heart failure. Physiol Genomics. 2005;21:299–307. doi: 10.1152/physiolgenomics.00255.2004. [DOI] [PubMed] [Google Scholar]
- 35.McNary TG, Bridge JH, Sachse FB. Strain transfer in ventricular cardiomyocytes to their transverse tubular system revealed by scanning confocal microscopy. Biophys J. 2011;100:L53–55. doi: 10.1016/j.bpj.2011.03.046. [DOI] [PMC free article] [PubMed] [Google Scholar]
- 36.Linde C, Daubert C. Cardiac resynchronization therapy in patients with new york heart association class i and ii heart failure: An approach to 2010. Circulation. 2010;122:1037–1043. doi: 10.1161/CIRCULATIONAHA.109.923094. [DOI] [PubMed] [Google Scholar]
- 37.Soeller C, Cannell MB. Examination of the transverse tubular system in living cardiac rat myocytes by 2-photon microscopy and digital image-processing techniques. Circ Res. 1999;84:266–275. doi: 10.1161/01.res.84.3.266. [DOI] [PubMed] [Google Scholar]
- 38.Lasher RA, Hitchcock RW, Sachse FB. Towards modeling of cardiac micro-structure with catheter-based confocal microscopy: A novel approach for dye delivery and tissue characterization. IEEE Transactions on Medical Imaging. 2009;28:1156–1164. doi: 10.1109/TMI.2009.2017376. [DOI] [PubMed] [Google Scholar]
Associated Data
This section collects any data citations, data availability statements, or supplementary materials included in this article.