Abstract
The aim of the present investigation was to develop and optimize gastroretentive floating system of amoxicillin for the efficient treatment of peptic ulcer induced by Helicobacter pylori infection. Floating microballoons were developed using central composite design (CCD), and optimization was done by employing response surface methodology. The selected independent variables were cellulose acetate phthalate, drug–Eudragit S100 ratio, and the ratio of dichloromethane/ethanol/isopropyl alcohol. The selected dependent variables were yield, mean particle size, buoyancy, encapsulation efficiency, and drug release within 8 h. A quadratic polynomial model was generated which had linear, interaction, and quadratic terms to predict and evaluate the independent variables with respect to the dependent variables. Results showed that selected independent variables significantly affect the yield (30.53–82.71%), particle size (31.62–47.03 μm), buoyancy (42.68–95.75%), encapsulation efficiency (56.96–93.13%), and cumulative drug release from the microballoons (34.01–74.65%). The interaction and quadratic terms were also found to affect the process variables. An excellent agreement was found between the actual value and predicted value. In conclusion, it can be said that CCD is a valuable second-degree design to develop and optimize GFS of amoxicillin which in turn provides a basis to localize the drug release in the gastric region for effective treatment of H. pylori-mediated infection.
Key words: amoxicillin, central composite design, floating microballoons, gastroretentive floating system, H. pylori, response surface methodology
INTRODUCTION
Helicobacter pylori infection is one of the major causes of peptic ulcer and gastric adenocarcinoma worldwide. More than 50% of the population is recognized to have H. pylori infection (1). Even though currently available antibiotics have a significant effect against H. pylori, its complete eradication has remained a challenge. This is mainly due to drawbacks of available conventional dosage forms (2,3). H. pylori lives deep in the gastric mucosal region, where the conventional dosage forms are unable to produce a localized release of antibiotic. Hence, a minimum inhibitory concentration of antibiotic does not get maintained in the gastric mucosa which ultimately leads to failure of therapy. To overcome this, there is a need to develop drug delivery systems with ability to release the drug specifically in the stomach.
An optimum gastroretentive floating system can be defined as a system which is retained in the stomach for sufficient time against all the physiological barriers and finally metabolized in the body. To fulfill all these objectives, an optimized gastroretentive floating system (GFS) should possess physical properties like being smaller in size, high buoyancy, and encapsulation efficacy along with the controlled release of drug in the gastric environment.
Gastroretentive systems produce a lasting local action on the gastroduodenal wall (4,5). Floating systems do not bind with mucosal surfaces in the body and reduce the safety problems associated with mucoadhesive systems (6). Multiparticulate systems avoid the “all or none” gastric emptying process of the single unit system (7,8). Keeping in view all these factors, amoxicillin-loaded GFS was designed and optimized to increase the residence time of the drug in the stomach without contact with the mucosa.
Response surface methodology (RSM) has applications in the particular situations where several input variables potentially influence some performance measure or quality characteristic of the process. Thus, performance measure or quality characteristic is called the response. Under RSM, different designs such as factorial design, central composite design (CCD), Box–Behnken design, and simplex lattice design are used for optimization (9,10). In the present study, CCD was selected for the development of GFS. The selected independent variables in CCD were cellulose acetate phthalate (CAP), Eudragit S100, and dichloromethane/ethanol/isopropyl alcohol ratio, and the dependent variables were yield, mean particle size, buoyancy, encapsulation efficiency, and cumulative drug release within 8 h. Levels of independent variables were decided according to preliminary trials done.
MATERIALS AND METHODS
Materials
Amoxicillin was a generous gift from Win-Medicare (Meerut, India). Eudragit S100 was purchased from Evonik Degussa (Mumbai, India). CAP and polyvinyl alcohol were purchased from Central Drug House (New Delhi, India). All the other reagents and solvents used were of analytical grade.
CCD
The CCD is comprised of a central core of two level factorial designs (2n), one central point, and 2n axial or outer points. Three factors with five levels were used to explore the complete design. The experimental design is given in Table I.
Table I.
CCD with the Levels of Independent Variables
| Formulation code | Concentration of CAP | Drug/Eudragit S100 | Dichloromethane/ethanol/isopropyl alcohol |
|---|---|---|---|
| AMX1 | −1 | −1 | −1 |
| AMX2 | +1 | −1 | −1 |
| AMX3 | −1 | +1 | −1 |
| AMX4 | +1 | +1 | −1 |
| AMX5 | −1 | −1 | +1 |
| AMX6 | +1 | −1 | +1 |
| AMX7 | −1 | +1 | +1 |
| AMX8 | +1 | +1 | +1 |
| AMX9 | −a | 0 | 0 |
| AMX10 | +a | 0 | 0 |
| AMX11 | 0 | −a | 0 |
| AMX12 | 0 | +a | 0 |
| AMX13 | 0 | 0 | −a |
| AMX14 | 0 | 0 | +a |
| AMX15 | 0 | 0 | 0 |
| Levels for independent variables | |||
| Codes for different levels of independent variables | CAP (g) | Drug/Eudragit S100 (g) | Dichloromethane/ethanol/isopropyl alcohol (ml) |
| −1 | 0.6 | 1:4 | 6:5:2 |
| +1 | 0.8 | 1:6 | 8:7:2 |
| 0 | 0.7 | 1:5 | 7:6:2 |
| −a | 0.53 | 1:3 | 5:4:2 |
| +a | 0.87 | 1:7 | 9:8:2 |
CAP cellulose acetate phthalate
Mathematical Model
A nonlinear quadratic polynomial model was generated for precise evaluation of the effects of independent variables on dependent variables using Design Expert v7.1.5 software (Stat-Ease, Inc., Minneapolis, Minnesota). Since the microballoons were formed at only a specific level of CAP, Eudragit S 100 and ethanol, polynomial models, were generated for the dependent variables by considering only the level of CAP (X1), Eudragit S 100 (X2), and ethanol in the solvent system (X3), as independent variables.
 |
1 |
where Yi is the level of response variable; βi is the regression coefficient; X1, X2, and X3 stand for the main effect; X1X2, X2X3, and X1X3 are the interaction terms of the main effects; and X21, X22, and X23 are quadratic terms of the independent variables that are used to simulate the curvature in the designed space.
Preparation of the Floating Microballoons
Floating microballoons were prepared using modified emulsion-solvent diffusion method (11–13). Accurately weighed quantity of drug, Eudragit S100, and CAP were dissolved in a solvent mixture containing dichloromethane, ethanol, and isopropyl alcohol. This mixture was introduced into the 100 ml aqueous solution of 0.5% w/v polyvinyl alcohol. The resultant solution was stirred at 300 rpm using a precision digital stirrer (LT400A, Yamato, Japan) for 1 h, and the temperature was maintained at 40°C. Due to fast evaporation of ethanol and isopropyl alcohol, a polymeric shell was developed enclosing dichloromethane. After 1 h, the formed microballoons were filtered and dried at 40°C to form inner gaseous phase by slow evaporation of enclosed dichloromethane.
Characterization of Developed Floating Microballoons
Prepared floating microballoons were evaluated for the selected dependant variables such as percentage yield, average particle size, encapsulation efficiency, buoyancy, and in vitro drug release. The surface of microballoons was characterized by scanning electron microscopy, and physical state of the entrapped drug was determined by X-ray diffraction study.
X-ray Diffraction Studies
X-ray diffraction analysis of pure amoxicillin and the optimized formulation was done by X-ray powder diffractometer (PW 3040/ 60 Xpert PRO, Panlytical, Netherlands). The X-ray diffraction patterns were recorded using Cu Kα radiations (λ = 1.5405980 Ả), a current of 30 ma, and a voltage of 40 kv. The samples were analyzed over 10–40 2θ range with a scan step size of 0.02 and 0.50 s per step.
Scanning Electron Microscopy
The external and internal morphology of the microballoons was studied by scanning electron microscopy (SEM). The samples for SEM were prepared by adhering the microballoons on a double adhesive tape stuck to an aluminum stub. The stubs were then coated with silver under an argon atmosphere using a high-vacuum evaporator (Polaron SEM coating system). The internal cavity of the microballoons was examined by cutting into two sections diametrically with a sharp surgical steel blade. The coated sample was then randomly scanned, and photomicrographs were taken with a scanning electron microscope (EVO-50, ZEISS; UK).
Encapsulation Efficiency
Accurately weighed (10 mg) microballoons were crushed and dispersed into 25 ml phosphate buffer (pH 7.4) for determination of encapsulation efficiency. The prepared mixture was shaken for 24 h. After 24 h, the solution was filtered, and the filtrate was analyzed for the drug content by a UV spectrophotometer at 227 nm after suitable dilution (14). The percentage encapsulation was calculated as follows:
 |
where, Da is the actual amount of drug present in the prepared microballoons, and Dt is the theoretical amount of drug added in the preparation of microballoons.
Buoyancy Study
Fifty milligrams of prepared microballoons was placed in 100 ml simulated gastric fluid (SGF, pH 1.2) containing 0.02% Tween 20. The mixture was stirred at 100 rpm on a magnetic stirrer. After 8 h, the supernatant SGF was filtered through a microporous filter paper (0.2 μm) to separate floating microballoons. The settled microballoons were collected separately. Both floating and settled microballoons were dried at 40°C. The fractions of microballoons were weighed, and the buoyancy was determined by the following formula (15):
 |
where Wf and Ws are the weights of floating and settled microballoons, respectively.
In Vitro Drug Release Study
The drug release rate from different formulations (AMX1–AMX15) was determined using USP type II apparatus (TDT-08L, Electrolab, Mumbai, India). Dissolution medium (SGF, pH 1.2, 500 ml) containing 0.02% Tween 20 filled in the dissolution vessel, and the temperature was maintained at 37 ± 0.5°C. Microballoons equivalent to 50 mg of amoxicillin were placed in the dissolution vessel, and the paddle was rotated at 50 rpm. Aliquots were withdrawn every 15 min in the first hour and then every hour till the 4th hour followed by the 6th and 8th hours. Samples were then analyzed by a UV spectrophotometer at 228 nm. The study was conducted in triplicate.
Statistical Treatment of the In Vitro Release Data
The drug release data were statistically analyzed by two-way analysis of variance (ANOVA). The p value of <0.05 was considered statistically significant.
RESULTS AND DISCUSSION
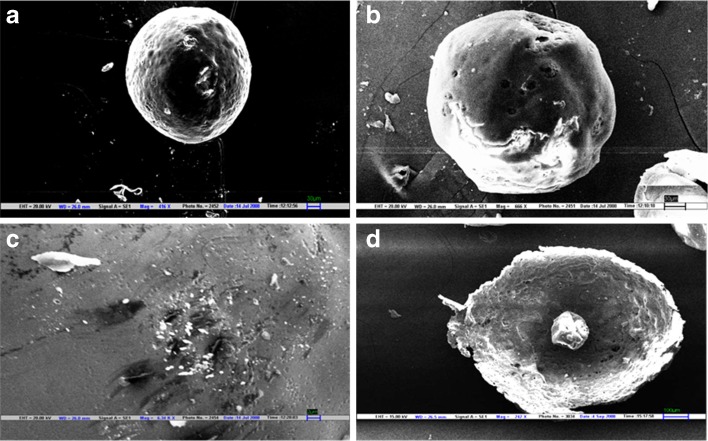
The developed microballoons of amoxicillin were predominantly spherical in appearance, which was confirmed in SEM photomicrographs (Fig. 1). The surface was observed to be smooth, dense, and less porous than the core, whereas the internal core was found to be highly porous and irregular with numerous depressions formed due to evaporation of water, ethanol, and dichloromethane. The less porous outer surface and highly porous internal core support the controlled release of drug and good buoyancy of the microballoons. The internal cavity formed is clearly visible in the cross-sectional view of microballoons.
Fig. 1.
Scanning electron micrographs of floating microballoons showing general appearance (a) and (b), surface morphology (c), and internal hollow structure (d). Scales are given on individual micrograph
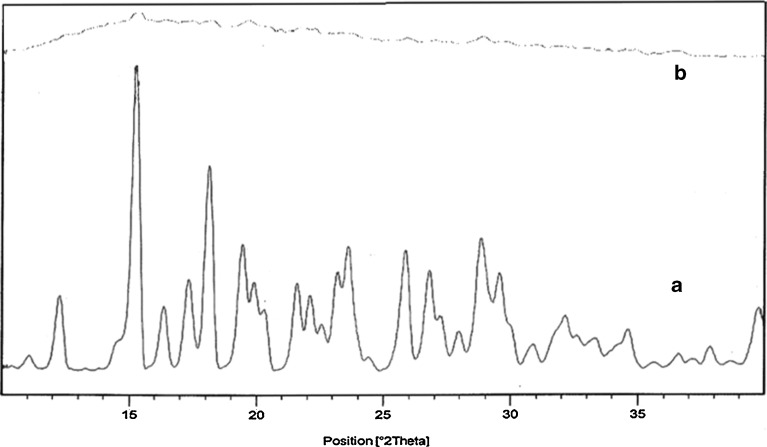
X-ray diffractograms of pure amoxicillin and drug-loaded microballoons are represented in Fig. 2. Pure amoxicillin showed various characteristic intense peaks, which disappeared in the diffractogram of the microballoons, indicating an amorphous dispersion of the drug in the polymer shell of the microballoons.
Fig. 2.
X-ray diffraction patterns of pure amoxicillin (A) and drug-loaded floating microballoons (B)
The results of the evaluation of dependable variables for different batches of microballoons (AMX1–AMX15) are given in Table II. Formulations AMX2, AMX3, AMX4, and AMX9 were not formed due to intensive precipitation of the polymer. This precipitation might be due to the fact that at higher concentration of polymers, the quantity of ethanol used was not sufficient to solubilize them, leading to aggregation of the polymers, when the polymer solution was added to the PVA solution. However, higher levels of ethanol supported the formation of microballoons when the drug–Eudragit S100-CAP concentrations were very high (AMX8). All these formulations confirmed that the microballoons were formed only at specific levels of CAP (X1), Eudragit S100 (X2), and ethanol in the solvent system (X3).
Table II.
Results of In Vitro Characterization of Microballoons
| Formulation code | Shape | Mean particle size (μm) | Yield (%) | Buoyancy (%) | Encapsulation efficiency (%) |
|---|---|---|---|---|---|
| AMX1 | Spherical | 31.62 | 77.63 | 91.28 | 93.02 ± 3.74 |
| AMX2 a | – | – | – | – | – |
| AMX3 a | – | – | – | – | – |
| AMX4 a | – | – | – | – | – |
| AMX5 | Spherical | 38.11 | 30.53 | 86.75 | 56.96 ± 7.45 |
| AMX6 | Spherical | 32.04 | 40.36 | 72.85 | 65.79 ± 0.79 |
| AMX7 | Spherical | 37.74 | 82.71 | 84.52 | 92.14 ± 10.4 |
| AMX8 | Spherical | 39.83 | 79.74 | 77.94 | 92.22 ± 5.26 |
| AMX9 a | – | – | – | – | – |
| AMX10 | Spherical | 33.57 | 72.71 | 52.63 | 73.50 ± 4.99 |
| AMX11 | Spherical | 35.90 | 79.27 | 43.10 | 87.32 ± 5.28 |
| AMX12 | Spherical | 39.69 | 80.54 | 62.82 | 83.19 ± 13.05 |
| AMX13 | Spherical | 47.03 | 72.69 | 42.68 | 57.43 ± 4.56 |
| AMX14 | Spherical | 36.10 | 79.22 | 59.05 | 91.47 ± 7.69 |
| AMX15 | Spherical | 38.90 | 80.25 | 95.75 | 93.13 ± 10.02 |
aMicroballoons did not form due to polymer precipitation
Polynomial quadratic models were generated for each response parameter, and the regression coefficients for each term in the regression model were summarized in Table III together with r2 and adjusted r2 of the regression model. To evaluate the effect of polymers and ethanol on the response variables precisely, the drug and other solvents used in the preparation of the floating microballoons were not considered in the development of polynomial models. The effect of formulation variables on different dependent or response variables was assessed by the generated regression coefficients and r2 values. The fitted quadratic equations relating the responses such as yield, mean particle size, encapsulation efficiency, buoyancy, and cumulative drug release to the transformed factor are given in Eqs. 2 to 6 respectively.
 |
2 |
 |
3 |
 |
4 |
 |
5 |
 |
6 |
Table III.
Regression Coefficient and r 2 Values for Different Response Variables
| Regression coeff. | Independent variable | Mean particle size | Yield | Buoyancy | Encapsulation efficiency | Cumulative drug release |
|---|---|---|---|---|---|---|
| β 0 | 38.62 | 81.24 | 95.04 | 93.84 | 73.99 | |
| β 1 | X 1 | 2.38 | 11.21 | −26.93 | 0.16 | −12.03 |
| β 2 | X 2 | 1.73 | −1.33 | 7.10 | −2.46 | −0.53 |
| β 3 | X 3 | −1.95 | −1.95 | 8.19 | 6.83 | 2.87 |
| β 4 | X 1 X 2 | 1.70 | −1.99 | 0.95 | −1.32 | 7.73 |
| Β 5 | X 1 X 3 | −3.72 | −8.29 | 20.94 | 2.93 | 5.84 |
| β 6 | X 2 X 3 | −0.22 | 25.43 | −7.26 | 18.73 | −0.62 |
| β 7 | X 21 | −2.63 | −11.72 | 2.49 | −8.75 | −5.62 |
| β 8 | X 22 | 0.068 | −1.49 | −14.14 | −3.77 | −6.30 |
| β 9 | X 23 | 1.33 | −2.47 | −14.88 | −7.59 | −10.21 |
| r 2 | 0.8502 | 0.8887 | 0.9486 | 0.9134 | 0.9134 | |
| Adjusted r 2 | −0.4980 | −0.113 | 0.4863 | 0.1344 | 0.1342 |
The correlation coefficients (r2) for mean particle size, yield, buoyancy, encapsulation efficiency, and cumulative drug release were found to be 0.8502, 0.8887, 0.9486, 0.9134, and 0.9134, respectively, which indicate a good fit. The polynomial equations can be used to draw conclusions after considering the magnitude of coefficient and the mathematical sign it carries (positive or negative). The interaction terms and quadratic terms also show a significant effect on the response variables.
A high percentage yield (30.53–82.71%) of the microballoons was found in all the formulations except AMX5 and AMX6. From Eq. 2, it can be observed that the yield of microballoons was significantly enhanced with an increase in the concentration of Eudragit S100, but at the higher level of CAP, the yield of microballoons decreased, which might be due to incomplete dissolution of CAP in the ethanol. A higher volume of ethanol was also found to suppress the yield. Hence, it can be concluded that the level of ethanol has a significant role in the formulation as Eudragit S100 is soluble in ethanol.
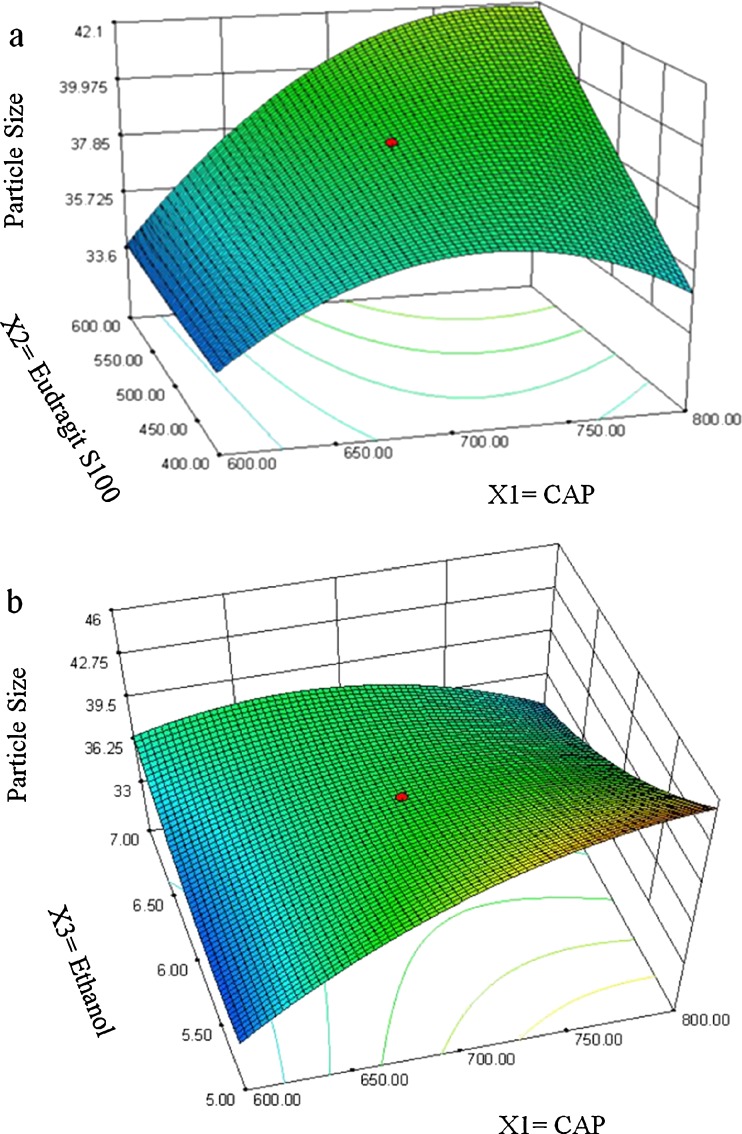
The positive magnitude of coefficient for Eudragit S100 in Eq. 3 indicates that Eudragit S100 enhances the particle size of microballoons. Larger particles were produced due to the rapid precipitation of the polymer, leading to hardening of the polymer shell, which avoids particle size reduction due to agitation. Therefore, a lower level of Eudragit S100 is suggested for producing microballoons of smaller particle size. The relationship between the dependent and independent variables was further elucidated using response surface plots. Figure 3 shows that the mean particle size of the microballoons increased with an increase in the polymer concentration. Ethanol has a suppressive effect on the particle size, as a higher level of ethanol decreases the viscosity of the organic phase, which, in turn, reduces the particle size.
Fig. 3.
Response surface plots showing the influence of CAP (X 1), Eudragit S 100 (X 2), and ethanol (X 3) on mean particle size of floating microballoons
The percentage encapsulation of amoxicillin was found to be high (56.96–93.13%) in all the formulations, which might be due to the poor aqueous solubility of the drug. CAP had negative correlation with encapsulation efficiency (Eq. 4). This means that higher levels of CAP decrease the drug loading in the microballoons. So, lower levels of CAP are suggested for high encapsulation. On the other hand, higher levels of Eudragit S100 enhanced the encapsulation efficiency of the drug. The buoyancy range of all the formulations was found to be 56.96 to 93.13%, which might be due to the lower density of microballoons than the SGF.
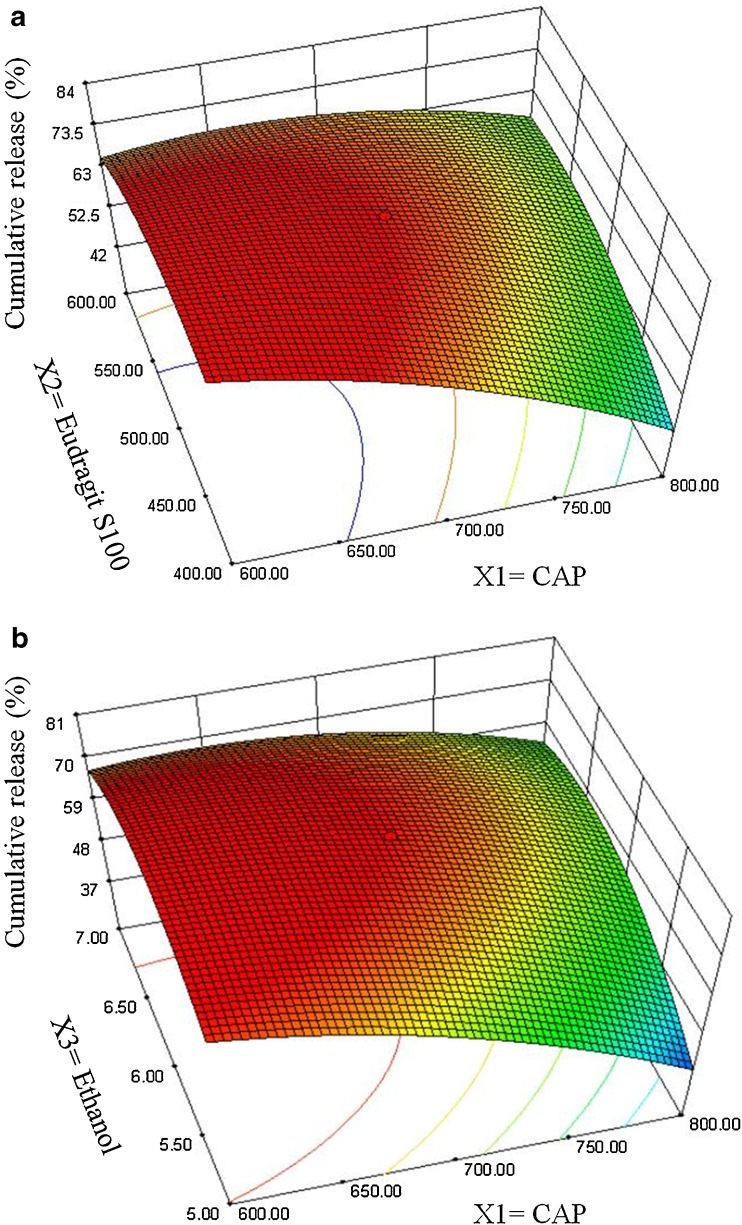
The negative value of regression coefficients for factor X1 and X2 in Eq. 6 and Fig. 4 suggests that all the independent variables have a significant effect on drug release and control the release of drug from the microballoons. The increased density of the polymer matrix at higher polymer concentration results in an increased diffusion path length, which may decrease the overall drug release from the polymer matrix. Also, smaller particles formed at lower polymer concentration exhibit larger surface area for exposure to the dissolution medium. The drug release pattern may be changed by appropriate selection of the X1, X2, and X3 levels.
Fig. 4.
Response surface plots showing the influence of CAP (X 1), Eudragit S 100 (X 2), and ethanol (X 3) on cumulative release of drug from floating microballoons
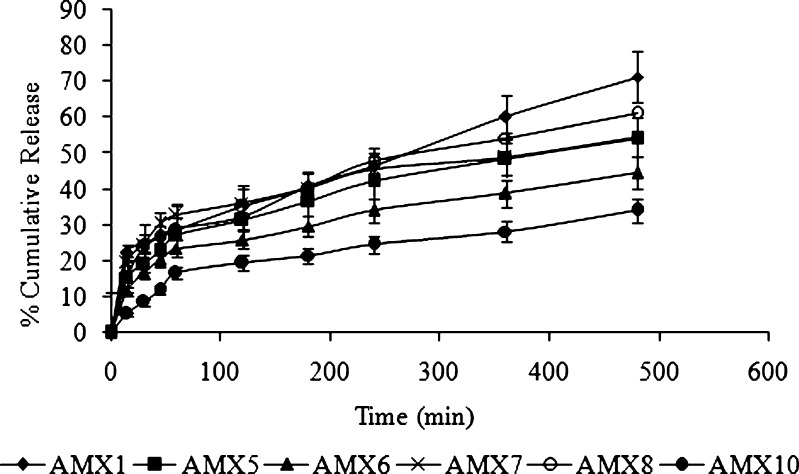
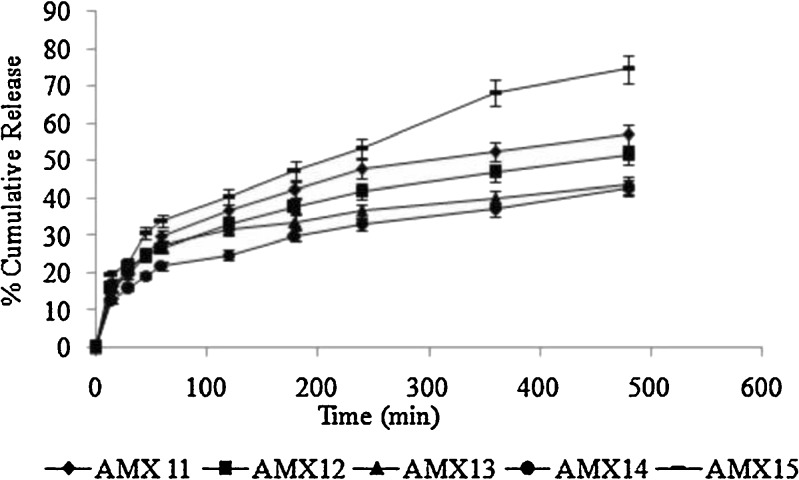
Drug release from the different formulations is shown in Figs. 5 and 6. The release mechanism of amoxicillin from the hollow microballoons was studied on the basis of Peppas’s equation (16). According to the logarithmic form of Peppas’s equation, the rate of drug release can be expressed as:
 |
where Q is the amount of drug released, t is the time, and n is the slope of the linear plot. If the value of n is less than or equal to 0.5, the mechanism of drug release is diffusion without swelling. If the value is greater than 0.5 and less than 1, the release is through diffusion with swelling, and if it is above 1, the release mechanism is anomalous diffusion, not confirming any of Fick’s laws (non-Fickian).
Fig. 5.
In vitro drug release profiles of different batches of floating microballoons containing amoxicillin (filled diamonds AMX1, filled squares AMX5, filled triangles AMX6, crossed lines AMX7, empty circles AMX8, filled circles AMX10) in simulated gastric fluid (pH 1.2) at 37°C (mean ± SD, n = 3)
Fig. 6.
In vitro drug release profiles of different batches of floating microballoons containing amoxicillin (filled diamonds AMX11, filled squares AMX12, filled triangles AMX13, filled circles AMX14, bold lines AMX15) in simulated gastric fluid (pH 1.2) at 37°C (mean ± SD, n = 3)
In the present study, the regression coefficient (r2) and diffusion coefficient (n) were calculated for the Peppas plots and are reported in Table IV. From the table, it can be seen that all the formulations had n values less than or equal to 0.5, which confirms that the release mechanism of amoxicillin in SGF (pH 1.2) from the floating hollow microballoons was Fickian diffusion without swelling. This indicates that the smooth-walled microballoons have adequate pores and channels to allow the drug to be released in a smooth and controlled manner. Also, there was no polymer dissolution or chain relaxation due to non-swelling, insoluble nature of the polymer. This ensures high reproducibility of the developed system.
Table IV.
Peppas’s Equation Parameters for Drug Release from Different Batches of Microballoons
| Formulation code | r 2 values | n values |
|---|---|---|
| AMX1 | 0.9267 | 0.3302 |
| AMX5 | 0.9943 | 0.3599 |
| AMX6 | 0.9781 | 0.3539 |
| AMX7 | 0.9817 | 0.2797 |
| AMX8 | 0.9871 | 0.3729 |
| AMX10 | 0.9510 | 0.5037 |
| AMX11 | 0.9875 | 0.3770 |
| AMX12 | 0.9966 | 0.3323 |
| AMX13 | 0.9445 | 0.2940 |
| AMX14 | 0.9925 | 0.3403 |
| AMX15 | 0.9882 | 0.3880 |
On application of two-way ANOVA, a significant difference was observed in the in vitro drug release profiles among the various formulations (AMX1–AMX15) at 95% confidence interval (p < 0.05), as the calculated F value was higher than the tabulated value. This substantiates the role of polymers in controlling the drug release (Table V). All the calculations were performed using GraphPad Prism v5 (GraphPad Prism Software Inc., San Diego, California). The predicted values and the observed values were found to be in good agreement (Table VI), which indicates the validity of the developed model.
Table V.
Results of ANOVA on the Release Profiles of Amoxicillin from Different Formulations (AMX1–AMX15)
| Source of variation | Sum of square | Degree of freedom | MSS | Calculated F | Tabulated |
|---|---|---|---|---|---|
| CSS | 3,875 | 10 | 387.5 | 23.22 | 1.91 |
| RSS | 25,330 | 9 | 2,814 | 168.7 | 1.96 |
| ESS | 1,502 | 90 | 16.69 |
MSS Mean squares, CSS Column sum of squares, RSS Raw sum of squares, ESS Error sum of squares
Table VI.
Actual (A) and Predicted (P) Values for All Response Variables for Different Batches of Microballoons
| Formulation | Yield | Mean particle size | Encapsulation efficiency | Buoyancy | Cumulative drug release | |||||
|---|---|---|---|---|---|---|---|---|---|---|
| A | P | A | P | A | P | A | P | A | P | |
| AMX1 | 77.63 | 72.79 | 31.62 | 32.99 | 93.02 | 89.55 | 91.28 | 94.78 | 71.26 | 74.50 |
| AMX5 | 30.53 | 34.60 | 38.11 | 36.96 | 56.96 | 59.88 | 86.75 | 83.81 | 72.53 | 69.81 |
| AMX6 | 40.36 | 44.43 | 32.04 | 30.89 | 65.79 | 68.71 | 72.85 | 69.91 | 44.68 | 41.96 |
| AMX7 | 82.71 | 86.78 | 37.74 | 36.59 | 92.14 | 95.06 | 84.52 | 81.58 | 54.76 | 52.04 |
| AMX8 | 79.74 | 88.65 | 39.83 | 37.31 | 92.22 | 98.61 | 77.94 | 71.49 | 61.08 | 55.12 |
| AMX10 | 72.71 | 66.95 | 33.57 | 35.20 | 73.50 | 69.37 | 52.63 | 56.79 | 34.01 | 37.86 |
| AMX11 | 79.27 | 79.27 | 35.90 | 35.90 | 87.32 | 87.32 | 43.10 | 43.10 | 57.08 | 57.08 |
| AMX12 | 80.54 | 74.78 | 40.10 | 41.73 | 83.19 | 79.06 | 62.82 | 66.98 | 51.43 | 55.28 |
| AMX13 | 72.69 | 77.53 | 47.03 | 45.66 | 57.43 | 60.90 | 42.68 | 39.18 | 43.51 | 40.27 |
| AMX14 | 81.58 | 70.98 | 36.10 | 39.09 | 91.47 | 83.87 | 59.05 | 66.72 | 42.84 | 49.93 |
| AMX15 | 80.25 | 81.24 | 38.90 | 38.62 | 93.13 | 93.84 | 95.75 | 95.04 | 74.65 | 73.99 |
On the basis of dependent variables, formulation AMX15 was selected as optimized formulation, as the microballoons of this batch exhibited spherical shape, good buoyancy (95.75%), high encapsulation efficiency (93.13%), and effective release of drug (74.65%) at the end of the 8-h dissolution study. Finally, the optimized experimental conditions for preparation of amoxicillin microballoons were identified as:
Drug–polymer ratio, 1:2.5
Dichloromethane/ethanol/isopropyl alcohol ratio, 7:6:2
CAP concentration, 0.7 g
CONCLUSION
Hollow floating microballoons of amoxicillin were prepared and optimized effectively by RSM. RSM can be used to reduce the time and cost of the development of the experimental procedure. The developed floating microballoons of amoxicillin increase the gastric residence time and prolong the drug release in the stomach, which, in turn, improves the local availability of the drug. This prolonged local residence time may lead to effective management of H. pylori-induced peptic ulcer. However, this needs to be proved in a suitable in vivo model.
REFERENCES
- 1.Majumdar D, Bebb J, Atherton J. Helicobacter pylori infection and peptic ulcers. Medicine. 2007;35:204–209. doi: 10.1016/j.mpmed.2007.01.006. [DOI] [Google Scholar]
- 2.Bardronnet P, Faivre V, Pugh WJ, Piffaretti JC, Falson F. Gastroretentive dosage forms: overview and special case of Helicobacter pylori. J Control Release. 2006;111:1–18. doi: 10.1016/j.jconrel.2005.10.031. [DOI] [PubMed] [Google Scholar]
- 3.Selgrad M, Malfertheiner P. New strategies for Helicobacter pylori eradication. Curr Opin Pharmacol. 2008;8:1–5. doi: 10.1016/j.coph.2008.04.010. [DOI] [PubMed] [Google Scholar]
- 4.Davis SS. Formulation strategies for absorption window. Drug Discov Today. 2005;10:249–257. doi: 10.1016/S1359-6446(04)03351-3. [DOI] [PubMed] [Google Scholar]
- 5.Talukder R, Fassihi R. Gastroretentive drug delivery system: a mini review. Drug Dev Ind Pharm. 2004;30:1019–1028. doi: 10.1081/DDC-200040239. [DOI] [PubMed] [Google Scholar]
- 6.Arora S, Ali J, Ahuja A, Khar RK, Baboota S. Floating drug delivery system: a review. AAPS Pharm. Sci. Tech. 2005; 6 Article-47. http://www.aapspharmscitech.org. Accessed on 05.06.2010 [DOI] [PMC free article] [PubMed]
- 7.Choudhury PK, Kar M, Chauhan CS. Cellulose acetate microspheres as floating depot system to increase gastric retention of antidiabetic drug: formulation, characteristics and in vitro-in vivo evaluation. Drug Dev Ind Pharm. 2008;34:349–354. doi: 10.1080/03639040701542531. [DOI] [PubMed] [Google Scholar]
- 8.Soppimath KS, Aminabhavi TM, Agnihotri SA, Mallikarjuna NN, Kulkarni PV. Effect of coexipients on nifedipine hollow microspheres: a novel gastroretentive drug delivery system. J Appl Polym Sci. 2006;100:486–494. doi: 10.1002/app.23192. [DOI] [Google Scholar]
- 9.Varshosaz J, Tabbakhian M, Zahrooni M. Development and characterization of floating microballoons for oral delivery of cinnarizine by a factorial design. J Microencapsul. 2007;24:253–262. doi: 10.1080/02652040601162723. [DOI] [PubMed] [Google Scholar]
- 10.Prajapati ST, Patel LD, Patel DM. Gastric floating matrix tablets: design and optimization using combination of polymers. Acta Pharm. 2008;58:221–229. doi: 10.2478/v10007-008-0006-3. [DOI] [PubMed] [Google Scholar]
- 11.Sato Y, Kawashima Y, Takeuchi H, Yamamoto H. In-vitro and in-vivo evaluation of riboflavin-containing microballoons for a controlled drug delivery system in healthy humans. Int J Pharm. 2004;275:97–107. doi: 10.1016/j.ijpharm.2004.01.036. [DOI] [PubMed] [Google Scholar]
- 12.Lee JH, Park TG, Choi HK. Development of oral drug delivery system using floating microspheres. J Microencapsul. 1999;16:715–729. doi: 10.1080/026520499288663. [DOI] [PubMed] [Google Scholar]
- 13.Nepal PR, Chun MK, Choi HK. Preparation of floating microspheres for fish farming. Int J Pharm. 2007;341:85–90. doi: 10.1016/j.ijpharm.2007.03.049. [DOI] [PubMed] [Google Scholar]
- 14.Patel JK, Patel MM. Stomach specific anti-Helicobacter pylori therapy: preparation and evaluation of amoxicillin-loaded chitosan mucoadhesive microspheres. Curr Drug Deliv. 2007;4:41–50. doi: 10.2174/156720107779314811. [DOI] [PubMed] [Google Scholar]
- 15.Jain SK, Awasthi AM, Jain NK, Agrawal GP. Calcium silicate based microspheres of repaglinide for gastroreteneive floating drug delivery: preparation and in-vitro characterization. J Control Release. 2005;107:300–309. doi: 10.1016/j.jconrel.2005.06.007. [DOI] [PubMed] [Google Scholar]
- 16.Peppas NA. Analysis of Fickian and non-Fickian drug release from polymers. Pharm Acta Helv. 1985;60:110–111. [PubMed] [Google Scholar]


