Abstract
In order to overcome poor bioavailability of narrow absorption window drugs, a gastrosphere system comprising two mechanisms of gastric retention, namely buoyancy and gastroadhesion, has been investigated in this study employing poly(lactic-co-glycolic acid) (PLGA), polyacrylic acid (PAA), alginate, pectin, and a model drug metformin hydrochloride. Fifteen formulations were obtained using a Box–Behnken statistical design. The gastrosphere yield was above 80% in all cases; however, due to the high water solubility of metformin, drug entrapment efficacy was between 18% and 54%. Mean dissolution time and gastroadhesive strength were used as the formulation responses in order to optimize the formulation. Furthermore, the molecular mechanics force field simulations were performed to corroborate the experimental findings. Drug release profiles revealed three different release kinetics, namely, burst, first-order and zero-order release. Varying gastroadhesive results were obtained, and were highly sensitive to changes in polymer concentrations. FTIR revealed that strong bonds of PAA and PLGA were retained within the gastrosphere. Surface area and porosity analysis provided supporting evidence that the lyophilization process resulted in a significant increase in the porosity. Analysis of the surface morphology by SEM revealed that air pockets were spread over the entire surface of the gastrosphere, providing a visual proof of the high porosity and hence low density of the gastrosphere. The spatial disposition and energetic profile of the sterically constrained and geometrically optimized multi-polymeric complex of alginate, pectin, PAA, and PLGA corroborated the experimental results in terms of in vitro drug release and gastroadhesive strength of the fabricated gastrospheres.
KEY WORDS: Box–Behnken design, gastroretentive drug delivery, molecular mechanics simulations, narrow absorption window drugs, polymeric gastrosphere synthesis
INTRODUCTION
Modulated drug delivery and the use of synthetic biodegradable polymers have received much attention in recent years (1–4). The ability to control the release of drug from a delivery system has resulted in numerous advantages, including reduced toxicity, improved efficacy, and improved patient compliance (5–7). The gastric residence time is generally described as highly variable due to the influence of a range of variables connected with both the dosage form characteristics and the fed or fasting conditions of the individual. The small intestinal transit time is known to be more consistent (3–5 h) and is generally shorter than the colonic one, which may extend much over 20 h. The gastric time will determine the duration that drug remains in contact with its specific site of adsorption in the intestine (8). The efficacy of drug therapy may therefore be enhanced by prolonging transit time of a drug through the gastrointestinal tract (9,10). Modulating the release of drugs within the gastrointestinal tract by means of increasing their gastric residence time offers numerous advantages over conventional oral immediate release drug delivery systems (9–13). Advantages that are more specific to modulated release due to the prolongation of gastric residence time are that the drug is slowly released into the stomach and filters via the pyloric sphincter into the intestines over a longer period of time, allowing an increase in time available for drugs with low bioavailability or narrow absorption windows to be absorbed. Furthermore, the transport mechanism at the absorption site may not be saturated with drug, resulting in more efficient transcellular transport instead of drug excretion.
Drugs which have a poor bioavailability such as narrow absorption window drugs are ideal candidates to be incorporated into gastrofloatable and gastroadhesive modulated release drug delivery systems (12). Examples of such drugs include metformin (50%), acyclovir (23%), captopril (65%), riboflavin (15%), levodopa (30%), nitrofurantoin (40%), and ciprofloxacin (69%) (8, 14–16). Metformin hydrochloride is a di-substituted biguanide (N-1,1-dimethylbiguanide) anti-hyperglycaemic agent used in the treatment of type II non-insulin-dependent diabetes mellitus. It is highly water soluble and has a relatively low bioavailability of 50% as well as a short, variable biological half-life of 0.9–2.6 h. Gastrointestinal absorption is completed after 6 h with peak plasma concentrations reached after 2–3 h (17, 18). Initial doses start between 500 mg administered twice a day or 850 mg once a day with a maximum dosage of 3 g per day administered in divided doses (19). There are numerous factors which affect gastric emptying and as a result may influence the gastric retention time of an oral drug delivery system. The size and shape of the system affects its transit through the pyloric sphincter, while the density will determine whether the system would float on the gastric contents or sink to the base of the stomach. These factors are important to consider when designing a gastrofloatable and gastroadhesive drug delivery system. Biological factors also play an important role in the functioning of the gastrointestinal tract. These include the age and gender of the patient, the presence of disease as well as the level of physical activity, body mass index, and posture. Further factors that influence gastric emptying include the ingestion of food and particular drugs which may have an impact on gastrointestinal motility (9, 15, 20, 21). Many types of drug delivery systems have been designed in order to achieve gastric retention. The most popular methods of achieving gastric retention include floating or buoyant systems, which must fall under the following attributes: (1) have a density less than that of the gastric fluid (∼1.002 g cm−3), (2) gastroadhesive systems which result from the interaction of the polymers utilized and the mucin lining the stomach, and (3) swelling and expanding systems which are retained due to their large size and high density systems which sink to the base of the stomach and become trapped within the folds of the fundus.
Alginate is a linear copolymer made up of β-d-mannuronic acid and α-l-guluronic acid in different configurations (22,23). The carboxyl groups present on the alginate molecule is responsible for its pH-sensitive nature (23). Contact with a multivalent ion such as calcium results in instantaneous gelation (22). This gelation process can be explained through the egg-box model, where the carboxylic acid groups of two adjacent alginate molecules are bound by the multivalent ion (22,24). Pectin, a naturally occurring polysaccharide, mainly consists of α-(1,4)-galacturonic acid. The characteristics of pectin are highly dependent on its level of esterification and gels in the presence of particular multivalent ions such as calcium through the binding of galacturonic acid on adjacent chains (25). This gelation process reduces hydration and results in a more stable molecule at low pH (26).
Polyacrylic acid (PAA) is commonly used in drug delivery systems due to its biocompatibility, mucoadhesivity, unique properties, and multifunctional nature (27,28). The mucoadhesive properties of PAA are due hydrogen bonding with mucin in the gastrointestinal system (28). At low pH values such as within the gastric region, carboxylic acid groups on the PAA chain are non-ionized, displaying the strongest mucoadhesion (27). Poly-lactic-co-glycolic acid (PLGA) is widely used in the area of pharmaceutical drug delivery due to its good biocompatibility, toxicity, and biodegradation profiles (29,30). It is one of very few synthetic polymers approved for human use (30).
The purpose of this study therefore, was to design and optimize a gastrofloatable and gastroadhesive multi-particulate drug delivery system utilizing a composite synergistically functioning polymeric matrix for the delivery of model narrow absorption window drug, metformin, with the use of a Box–Behnken experimental design. The polymer combination was selected to impart functional parameters that include the gastrosphere yield, drug entrapment efficiency, in vitro drug release kinetics in simulated gastric fluid, buoyancy, gastroadhesion, swellability, surface area and porositometry, as well as an investigation of transitions that may occur within the polymeric gastrosphere. Furthermore, molecular mechanics (MM) force field simulations were conducted to investigate the inherent phenomenon involved in the structural integrity, and hence, the drug release and gastroadhesive properties arising from the incorporation of various polymeric entities in the Ca2+-cross-linked multi-particulate drug delivery system.
MATERIALS AND METHODS
Materials
The following materials were all of analytical grade and used as received. The polymers used were sodium alginate (ALG) (Protanal LF 10/60®; FMC BioPolymer, Drammen, Norway), pectin (PEC) (classic CU 701®; Herbstreith & Fox, Neuenbürg, Germany), polyacrylic acid (PAA) (Carbopol 974P NF®; Noveon, Cleveland, OH, USA), and poly(lactic-co-glycolic acid) (PLGA) (Resomer RG 858 S®) (Boehringer Ingelheim Pharma, Ingelhiem, Germany). 1,1-Dimethylbiguanide hydrochloride (metformin) was purchased from Aldrich (St Louis, MO, USA). Calcium hydroxide was purchased from BDH Chemicals Ltd. (Poole, Dorset, UK) and dichloromethane which was used as a solvent (Merck Chemicals Ltd, Wadeville, Gauteng, South Africa). All other reagents used were of analytical grade and were employed as purchased.
Construction of a Randomized Box–Behnken Experimental Design
A randomized Box–Behnken statistical experimental design was constructed (Minitab® V15, Minitab Inc., PA, USA) in order to model the number of formulations required for optimization as well as to establish the interaction effects of the independent formulation variables on the physicochemical and physicomechanical properties of the gastrospheres. Experimental trials were performed on 15 statistically derived formulations of various combinations. Alginate, pectin, PAA (1–2% w/v), and PLGA (0–2% w/v) were selected as the independent formulation variables, with alginate and pectin at a ratio of 1:1, and the mean dissolution time at 12 h (MDT12h). The strength of gastroadhesion was selected as the formulation response. A statistical model incorporating interactive and polynomial terms was utilized to evaluate the design and responses based on preliminary studies that have shown the composite nature of the matrix to uniquely use a narrow polymer concentration range for the statistical design approach since the sensitivity of the changes in polymer concentration was significantly reduced in the order of fractions thus still facilitating the optimization process. Response surface plots were constructed to visually represent the influence of the polymeric concentrations on the metformin release dynamics from the cross-linked gastrospheres.
Preparation of Gastrospheres
Gastrospheres were prepared by cross-linking and subsequent lyophilization using a combination of polymers in accordance with a Box–Behnken experimental design (Table I). Fifteen polymeric solutions of alginate, pectin, PAA, and metformin were dissolved in 100 mL water, and PLGA was dissolved in 5 mL dichloromethane. Both polymeric solutions were combined and allowed to stir for 1 h. The heterogeneous polymeric solution was injected dropwise into a cross-linking solution of 2% w/v calcium hydroxide (500 mL). Gastrospheres were allowed to cure for 20 min, after which they were removed from the cross-linking solution washed three times with 500 mL deionized water and frozen at −72°C for 24 h. Frozen gastrospheres were lyophilized (Labconco, MO, USA) with a 2-h condensation phase at −60°C and a 24-h sublimation phase at 25 mm Torr.
Table I.
Box–Behnken Design Template with Randomly Generated Formulations
| Gastrosphere formulations | [Alginate] (%) | [Pectin] (%) | [PAA] (%) | [PLGA] (%) |
|---|---|---|---|---|
| 1 | 1.0 | 1.0 | 2.0 | 1.0 |
| 2 | 2.0 | 2.0 | 1.5 | 2.0 |
| 3 | 1.0 | 1.0 | 1.5 | 2.0 |
| 4 | 1.5 | 1.5 | 1.5 | 1.0 |
| 5 | 1.5 | 1.5 | 2.0 | 0.0 |
| 6 | 2.0 | 2.0 | 2.0 | 1.0 |
| 7 | 1.0 | 1.0 | 1.5 | 0.0 |
| 8 | 1.5 | 1.5 | 1.5 | 1.0 |
| 9 | 1.5 | 1.5 | 1.0 | 0.0 |
| 10 | 2.0 | 2.0 | 1.0 | 1.0 |
| 11 | 1.5 | 1.5 | 1.0 | 2.0 |
| 12 | 1.5 | 1.5 | 1.5. | 1.0 |
| 13 | 1.5 | 1.5 | 2.0 | 2.0 |
| 14 | 1.0 | 1.0 | 1.0 | 1.0 |
| 15 | 2.0 | 2.0 | 1.5 | 0.0 |
Gastrosphere Yield and Drug Entrapment Efficiency
The yield of gastrospheres was determined by measuring the dry weight of the formed gastrospheres and comparing it to the weight of the initial dry formulation components. Entrapment efficiency studies were performed by stirring ground gastrospheres in 100 mL phosphate buffered solution (pH 7.6, 37°C). Thereafter, metformin content was determined in triplicate using ultraviolet spectroscopy (CE 3,021, Cecil Instruments, Cambridge, England) at the wavelength maximum of 241 nm. The EE was calculated utilizing Eq. 1 (21).
 |
1 |
In Vitro Analysis of the Drug Release from the Gastrospheres
Drug release studies were conducted employing the USP 35 apparatus two dissolution test approach (Erweka DT 700, Heusenstamm, Germany). A modification to the approach was made by immersing the samples under a ring–mesh assembly (31) in 900 mL simulated human gastric fluid (SHGF) (pH 1.2, 37°C) at a rotation speed of 50 rpm. SHGF was prepared according to USP 32, 2008. Two grams sodium chloride (NaCl) was dissolved in 1,000 mL deionized water. Seven milliliters of concentrated HCl was then added to the solution to result in a solution pH of 1.2. Samples of 5 mL were removed at predetermined time intervals and filtered through a 0.45 μm Millipore Millex filter (Billerica, MA, USA). Equal volumes of fresh drug-free SHGF were replaced in order to maintain sink conditions. Samples were then analyzed with UV spectroscopy at 241 nm. All experiments were conducted in triplicate. The release data was subjected to a model-independent analysis known as the time-point approach. Briefly, the mean dissolution time set at 12 h (MDT12) for each formulation was calculated. The application of the MDT12 approach provided a more precise analysis of the metformin release performance for comparison of several release datasets. Equation 2 was employed in this regard (31,32).
 |
2 |
Where Mt is the fraction of dose released in time ti = (ti + ti−1)/2 and M∞ corresponds to the loading dose.
Analysis of the Buoyancy of Gastrospheres
A total number of 50 gastrospheres of each formulation were immersed in 100 mL SHGF (pH 1.2, 37°C) and then placed in an orbital shaking incubator (LM-530–2, MRC Laboratory Instruments Ltd., Hahistadrut, Holon, Israel) for 12 h. Each sample was observed at predetermined time intervals while noting the number of spheres that were/were not buoyant. All experiments were conducted in triplicate.
Determination of the Gastroadhesion of Spheres
Gastrospheres were immersed in SHGF (pH 1.2, 37°C) for predetermined time periods. Adhesion was measured using a texture analyzer (TA.XT.plus, Stable Microsystems, Surrey, UK) with a simulated gastric membrane, a surrogate environment constituting a dialysis flat-sheet membrane of Mw = 12,000–14,000 g/mol (Spectrum Laboratories Inc., Rancho Dominguez, CA, USA) pre-impregnated with commercially available and standardized porcine gastric mucin type III (Sigma-Aldrich, St. Louis, MO, USA) that covered both the probe and stage platform. Samples were tested using an applied force of 2 N, a trigger force of 0.05 N, and a contact period of 15 s. Adhesion was determined by measuring the force required to separate the gastrosphere from the membrane, termed the detachment force. This detachment force was determined in terms of the work of adhesion which was obtained by calculating the area under the curve (AUC) of the force–distance textural profile. All experiments in this study were conducted in triplicate.
Evaluation of the Hydration of Gastrospheres
A total number of 50 spheres of each formulation was weighed and immersed in 100 mL SHGF (pH 1.2, 37°C) and placed in an orbital shaker incubator for 12 h. The spheres of each formulation were removed at predetermined time intervals, blotted with filter paper to remove excess SHGF and weighed. All experiments were conducted in triplicate. The swelling characteristics of the gastrospheres were expressed in terms of water uptake (13) using Eq. 3.
 |
3 |
Constraint Optimization of Formulation Responses
A model-independent approach (Minitab® V15, Minitab Inc., PA, USA) was used to optimize the lyophilized gastrospheres. Statistical optimization was therefore employed to ascertain the ideal polymeric combination with the desired physicochemical properties capable of attaining optimum gastroadhesive strength and a predicted MDT12h value which would conform to zero-order kinetics over 12 h.
Fourier Transmission Infrared Analysis
Fourier transform infrared (FTIR) spectroscopy was performed on the cross-linked gastrospheres and its constituent polymers. Samples were scanned over a wave number range of 4,000 to 650 cm−1 using a PerkinElmer FTIR spectrometer with a MIRTGS detector, (PerkinElmer Spectrum 100, Llantrisant, Wales, UK). The spectrum was at a ratio of 16 sample scans against 16 background scans. Samples were placed on a diamond crystal and processed by universal ATR polarization accessory for the FTIR spectrum series, at a resolution of 4 cm−1.
Analysis of Surface Area and Porosity
Surface area and porosity analysis was conducted using the Micromeritics ASAP Analyzer (Micromeritics ASAP 2020, GA, USA). Samples were initially subjected to degassing to remove surface moisture and gas particles prior to analysis. Degassing encompassed an evacuation phase and a heating phase. Each polymer matrix was weighed and inserted into the sample tube. Subsequently, a glass filler rod was inserted into the sample tube to decrease the total free space within the tube thus allowing a reduction in the time required for complete degassing to occur. The time required for degassing to be completed ranged from 7 to 9 h. After completely degassed, the sample tube was removed, covered with a thermal jacket, and transferred to the analysis port where it was cooled with liquid nitrogen prior to the analysis.
Analysis of the Surface Morphology of the Gastrospheres
Scanning electron microscope (SEM) analysis was carried out using a Phenom™ scanning electron microscope (FEI Company, OR, USA). Samples were made electrically conductive prior to analysis through the process of gold-sputter coating (SPI Module™ Sputter Coater, SPI Supplies, PA, USA). Samples were attached to an SEM stub using adhesive carbon tape. The stub was inserted into the stub holder thereafter putting the glass chamber and sputter head in place. Argon gas was allowed to flush the system before the leak valve was sealed and the vacuum was turned on. The sputter coater was turned on for 90 s when plasma current reached 18 mA, after which the system was turned off and the vacuum released.
Molecular Mechanics Simulations
Molecular mechanics computations in vacuum, which included the model building of the energy-minimized structures of multi-polymer complexes, were performed using the HyperChem™ 8.0.8 Molecular Modeling System (Hypercube Inc., Gainesville, FL, USA) and ChemBio3D Ultra 11.0 (CambridgeSoft Corporation, Cambridge, UK) on an HP Pavilion dv5 Pentium Dual CPU T3200 workstation. The decamers of PAA and PLGA were generated as 3D models from standard bond lengths and angles employing polymer builder tools using ChemBio3D Ultra in their syndiotactic stereochemistry, whereas the structures of alginate and pectin (ten oligosaccharide units each) were generated using sugar builder module on HyperChem 8.0.8. The structure of glycosylated gastric mucopeptide analogue (MUC) was generated using sequence editor module on HyperChem 8.0.8. The glycosylation was carried out at the threonine and serine amino acid residues. The generation of the overall steric energy associated with the energy-minimized structures was initially executed initially via energy minimization using MM+ force field and the resulting structures were again energy minimized using the assisted model building and energy refinements 3 (AMBER) force field. The conformer having the lowest energy was used to create the polymer–polymer and polymer–mucin complexes. A complex of one molecule with another was assembled by disposing them in a parallel way, and the same procedure of energy minimization was repeated to generate the final models: Alg–Pec, Alg–Pec–Ca2+, Alg–Pec–PAA, Alg–Pec–PAA–Ca2+, Alg–Pec–PAA–PLGA, Alg–Pec–PAA–PLGA–Ca2+, MUC Polymers, and MUC Polymers–Ca2+. Full geometry optimizations were carried out in vacuum employing the Polak–Ribiere conjugate gradient method until an RMS gradient of 0.001 kcal/mol was reached. Force field options in the AMBER (with all hydrogen atoms explicitly included) and MM+ (extended to incorporate non-bonded cutoffs and restraints) methods were the HyperChem 8.0.8 defaults. For calculations of energy attributes, the force fields were utilized with a distance-dependent dielectric constant scaled by a factor of 1. The 1–4 scale factors are following: electrostatic 0.5 and van der Waals 0.5.
RESULTS AND DISCUSSION
Determination of Gastrosphere Yield and Entrapment Efficiency
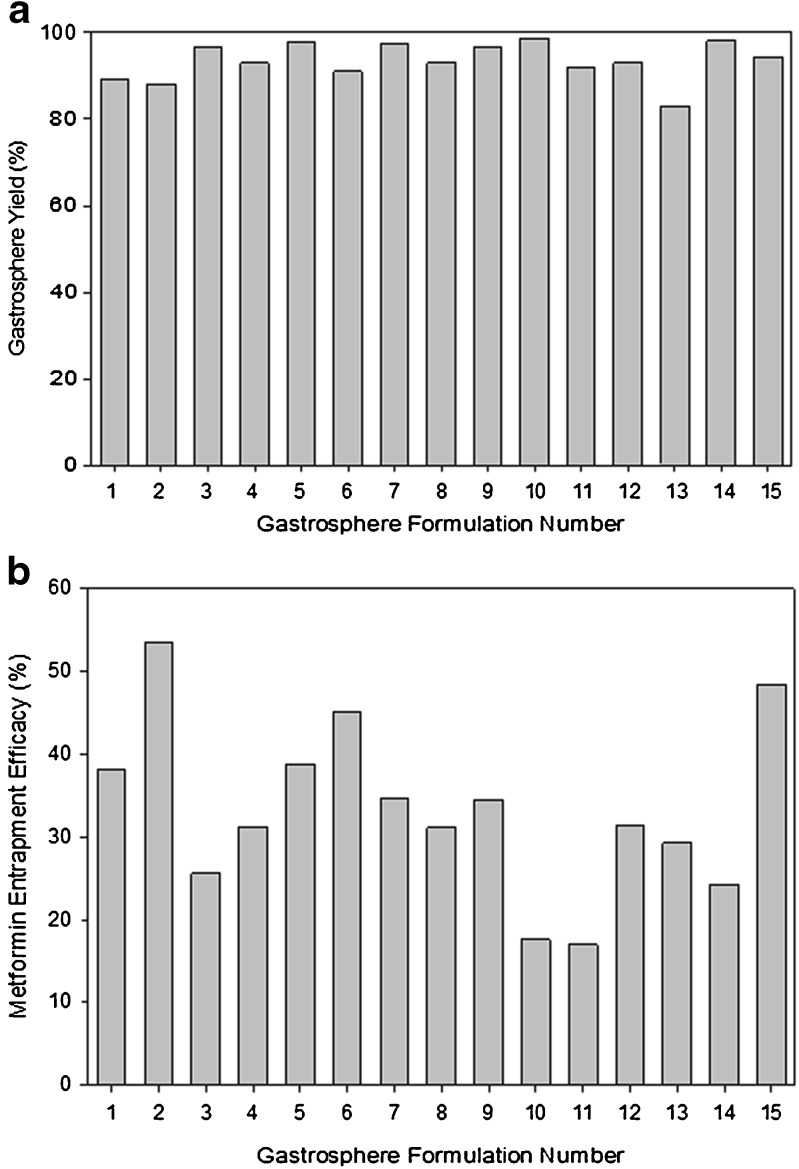
Gastrosphere yield values obtained from the 15 formulations ranged between 83% and 98%, with an average of 93.5%. Figure 1a provides the results obtained for each formulation. Entrapment efficiency values of metformin within the cross-linked gastrospheres ranged from 18% to 54%. Figure 1b provides the drug entrapment efficacy values obtained for each formulation. The rather low entrapment efficiency values are due to drug loss during the cross-linking step, which is exacerbated due to the high water solubility of metformin.
Fig. 1.
Profiles showing a gastrosphere yield and b entrapment efficiency of metformin of various cross-linked gastrospheres formulated as per the statistical experimental design template generated
In Vitro Drug Release from the Gastrospheres
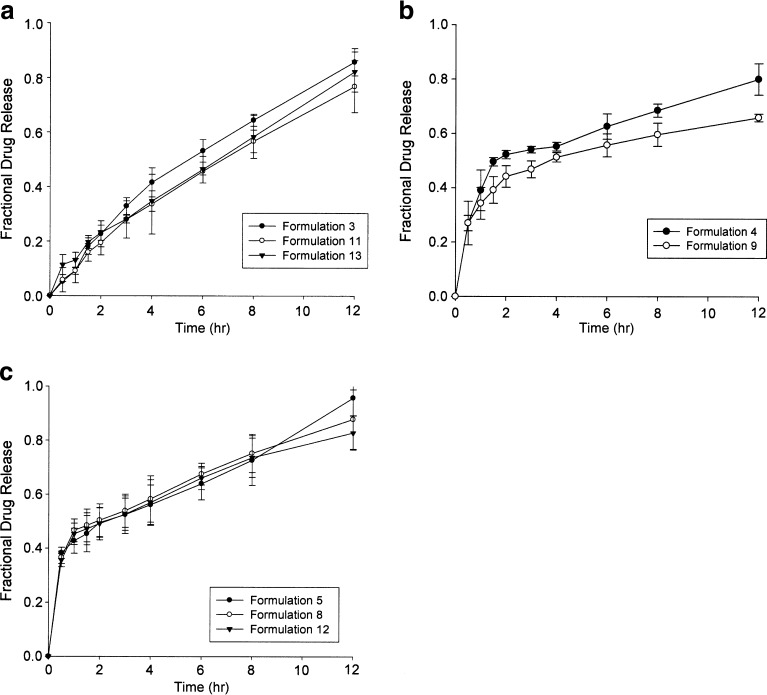
Due to the intended purpose of this drug delivery system, zero-order drug release is the ideal drug release pattern which was assessed by determining the release rate constants using mathematical modeling. Three profiles of drug release were achieved, namely near zero-order release, first-order release, and burst release. Figure 2a shows that formulations 3, 11, and 13 displayed near zero-order drug release over the 12-h period, resulting in 85%, 75%, and 60% final drug release, respectively. In order to achieve a constant plasma metformin concentration over the entire 12-h period and to avoid peaks and troughs which are commonly associated with side effects, zero-order release is ideal. First-order drug release was observed from formulations 4 and 9, with 80% and 66% final drug release as shown in Fig. 2b. Formulations 5, 8, and 12 (Fig. 2c) displayed an initial burst release, followed by a zero-order release. More than 50% of the final drug concentration was released within the first hour, followed by a gradual zero-order release over the subsequent 11 h. Although not ideal for our application, this profile may be appropriate for systems which may require a high loading dose and subsequent maintenance of plasma concentration. In order to evaluate drug release, mean dissolution time after 12 h (MDT12h) was employed. The application of the MDT12h approach provides a more precise analysis of the metformin release performance for comparison of several release datasets.
Fig. 2.
Drug release profiles showing a near zero-order drug release, b first-order drug release and c burst release of metformin from gastrospheres in SHGF (pH 1.2, 37°C) (N = 3; SD ≤ 0.075 in all cases)
Analysis of Gastrosphere Buoyancy
Excellent in vitro buoyancy was observed for all 15 formulations. The gastrospheres were immediately buoyant on contact with the SHGF and 99% of gastrospheres maintained buoyancy even after 8 h. Interestingly, the gastrospheres maintained their buoyancy for a prolonged period, and therefore, the study was conducted over 8 and 12 h which coincided with the duration of drug release. This was significant to ensure prolonged gastroretention of the device and ensure complete and constant drug release. Data obtained revealed that 99.0% of gastrospheres were buoyant after 8 h. Buoyancy was slightly reduced to 97.5% of gastrospheres after the full 12-h period. The buoyancy of this system can be attributed to the low apparent density of the gastrospheres, resulting from the highly porous structure attained from the lyophilization process.
Determination of the Gastroadhesion Strength
Gastroadhesion was found to be greatly variable between formulations due to the high sensitivity of PAA compared to other polymers. PLGA, due to its hydrophobic nature, inhibited the absorption of water, whereas PAA being hydrophilic resulted into the attraction of water molecules. The results indicated that both high PAA and PLGA concentrations were required for two distinctive purposes: PAA being highly bioadhesive maintained proper gastroadhesivity, while PLGA inhibited the water uptake (by virtue of its hydrophobicity) so as to give room for PAA to facilitate adhesion over the 12-h period. The concentrations of pectin and alginate also played a significant role in facilitating the adhesion. It was decided that two factors relating to mucoadhesion had to be taken into account when analyzing the results. The AUC of each formulation was calculated in order to analyze the data (i.e., to obtain the work of adhesion). In order to prevent an immediate passage of the gastrospheres from the stomach, the AUC from time 0 to 2 h (T0−2) was calculated as the first factor. The second factor was determined by calculating the AUC from time 2 to 12 h (T2–12), representing the ability to maintain adhesion throughout the full 12 h. The optimum formulation must possess the greatest of both factors.
Computation of Water Uptake and the Swelling Tendency of the Gastrospheres
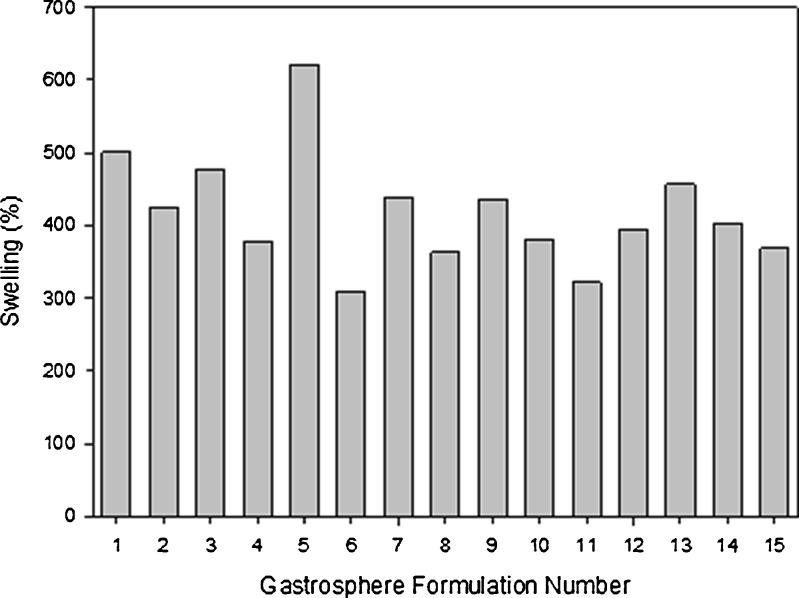
The degree of swelling for the polymers used has been determined by the water-uptake capacity of the gastrospheres. Although the drug delivery system is intended as a twice-daily dosage regime, it was found that optimal water uptake occurred at 8 h, after which, there was a slight reduction in water uptake. Figure 3 depicts the effects that each polymer had on the swelling ability of the drug delivery system. It was evident that an increase in PLGA resulted in a reduction of swelling. This was most probably due to the hydrophobic nature of the polymer, reducing the overall attraction of water to the gastrospheres. Pectin and sodium alginate had a similar effect, where the degree of swelling was reduced with increasing concentrations. However, due the high hydrophilic and bioadhesive nature of PAA, water molecules were strongly attracted to the gastrospheres, thus resulting in an increase in swelling with an increasing concentration.
Fig. 3.
Effect of various polymeric concentrations on swelling after 8 h
Response Surface Analysis
Response surface plots were obtained for the measured responses (MDT, T0–2, T2–12) based on the experimental model, representing the functional relationship between the response and the experimental factors.
Analysis of the Box–Behnken Response Surface Design
MDT, T0–2 and T2–12 for the experimental formulations were included in the statistical design for the identification of the formulation possessing optimum drug release and gastroadhesion. Residual analysis for MDT, T0–2 and T2–12 generally showed random scatter, indicating that no trends were present; however, some grouping was observed for T0–2. The normal probability plots of the residuals fell on a straight line, thus indicating that the data was normally distributed and there was a non-existence of unidentified variables.
The complete regression equations generated for MDT, T0–2 and T2–12 are indicated below:
 |
4 |
 |
5 |
 |
6 |
Response Surface Analysis for Mean Dissolution Time
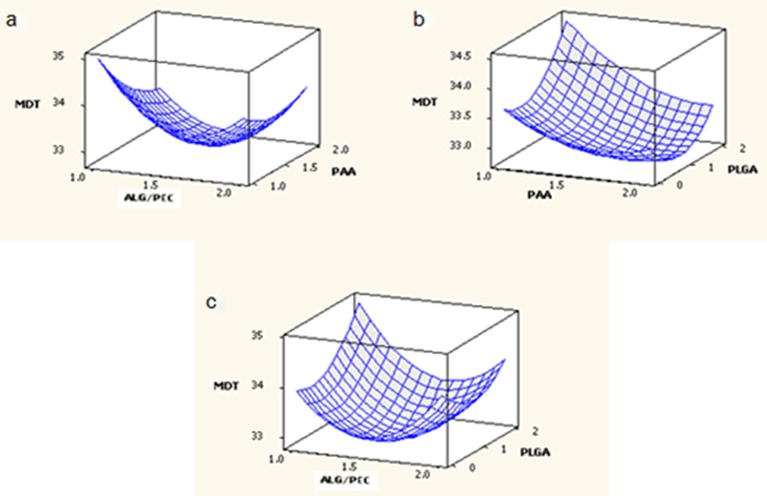
The effect of factors ALG/PEC and PAA at the midpoint of factor PLGA on response MDT is shown in Fig. 4a. At low levels of factor PAA, MDT was high and increasing the factor ALG/PEC from 1% to 1.5% resulted in a reduction of MDT, although as the factor was further increased from 1.5% to 2%, an increase in MDT was noted. At high levels of factor ALG/PEC, MDT was moderate. An initial increase in factor PAA from 1% to 1.5% resulted in a reduction of MDT, although further increasing the level of factor PAA from 1.5% to 2% resulted in the return of MDT to its original value. The effect of factors PAA and PLGA at the midpoint of factor ALG/PEC on response MDT is shown in Fig. 4b. At low levels of PAA, MDT was moderate, increasing with an increase in factor PLGA. At high levels of PAA, MDT was low, reducing as PLGA was increased from 0% to 1%, and returning to the original value as PLGA was further increased to 2%. The effect of factors ALG/PEC and PLGA at the midpoint of factor PAA on response MDT is shown in Fig. 4c. At low levels of ALG/PEC, MDT was moderate; increasing as factor PLGA was increased. At high values of factor ALG/PLGA, an increase in factor PLGA from 0% to 1% resulted in a reduction of MDT, although increasing this factor further to 2% resulted in an increase of MDT, returning to its original value. The effect of PLGA may be explained due to the fact that it is a lypophilic polymer which does not rapidly degrade or swell, obstructing the release of drug from the gastrospheres, thereby prolonging drug release.
Fig. 4.
Response surface plots generated for MDT
Response Surface Analysis for Mucoadhesion from 0 to 2 h
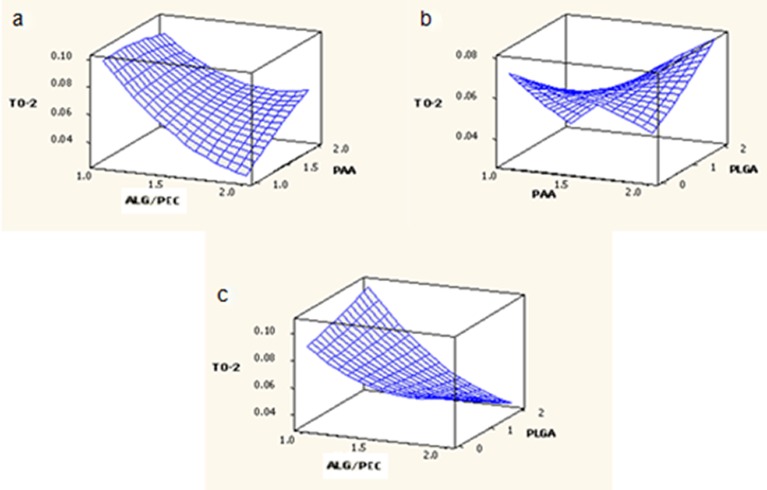
The effect of factors ALG/PEC and PAA at the midpoint of factor PLGA on response T0–2 is shown in Fig. 5a. At low levels of factor ALG/PEC, T0–2 was high. Increasing the level of factor PAA resulted in a slight reduction of T0–2. At high levels of ALG/PEC, was T0–2 low, increasing with an increase in PAA. The effect of factors PAA and PLGA at the midpoint of factor ALG/PEC on response T0–2 is shown in Fig. 5b. At low levels of PAA, T0–2 was high; decreasing as the level of factor PLGA was increased. However, T0–2 was low at high levels of PAA, increasing with an increase in the level of PLGA. The effect of factors ALG/PEC and PLGA at the midpoint of factor PAA on response T0–2 is shown in Fig. 5c. At low levels of PLGA and ALG/PEC, T0–2 was high, decreasing with an increase in the level of ALG/PEC. At low levels of ALG/PEC, T0–2 was moderate, increasing as the level of PLGA increased, although at high levels of ALG/PEC, T0–2 decreased as the level of PLGA increased.
Fig. 5.
Response surface plots generated for T 0–2
Response Surface Analysis for Mucoadhesion from 2 to 12 h
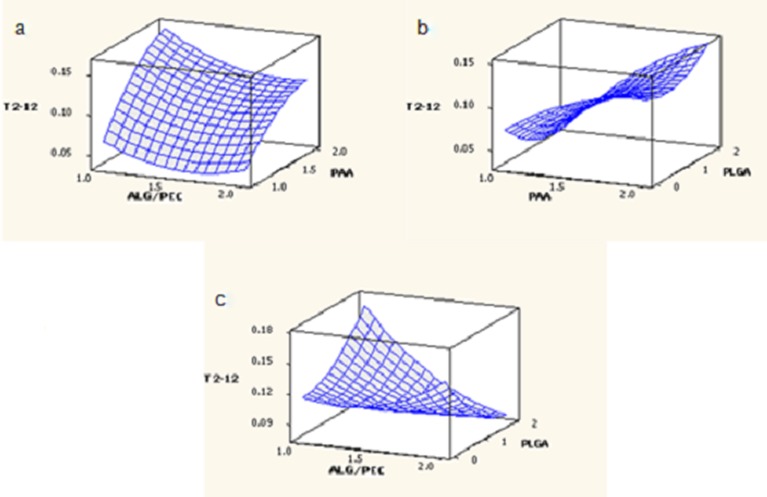
The effect of factors ALG/PEC and PAA (at the midpoint of factor PLGA) on response T2–12 is shown in Fig. 6a. At low levels, factor ALG/PEC was low, increasing with an increase in factor PAA. At high levels of ALG/PEC, T2–12 was also low and an increase in the levels of PAA had the same effect, although to a lesser degree. The effect of factors PAA and PLGA at the midpoint of factor ALG/PEC on response T2–12 is shown in Fig. 6b. At low levels of factor PAA, T2–12 was low and was further reduced as the level of factor PLGA increased. At high levels of PAA, T2–12 was high, although a reduction in T2–12 was noted as the level of factor PLGA increased from 0% to 1%, followed by a subsequent increase as levels reached 2%. The effect of factors ALG/PEC and PLGA at the midpoint of factor PAA on response T2–12 is shown in Fig. 6c. At low levels of ALG/PEC, T2–12 was moderate, increasing as the level of PLGA increased. At high levels of ALG/PEC, T2–12 was increased slightly, although a reduction of T2–12 was observed with an increase in the level of factor PLGA.
Fig. 6.
Response surface plots generated for T 2–12
Constraint Optimization of Formulation Responses for the Cross-linked Gastrospheres
Minitab® V15 (Minitab Inc., CA, USA) was used to optimize the formulation responses namely, the MDT, strength of adhesion after 2 h (T0–2) and strength of adhesion from 2 to 12 h (T2–12). These responses were selected due to the fundamental role they provide for the qualitative modeling of metformin release from the cross-linked gastrospheres. MDT was computed to converge to zero-order kinetics of metformin release from the optimized gastrosphere formulation. T0–2 and T2–12 were computed in a manner that would permit maximum gastroadhesion for both. The constraints were imposed in order to achieve the desired responses. According to the predictions of the statistical design, the optimal gastrosphere that would permit a desirable MDT value of 34.833 (which is reflective of zero-order kinetics over 12 h) and the greatest strength of adhesion for both the first 2 h as well as the subsequent 10 h would result in two possible formulations (Table II).
Table II.
Optimized Formulations Obtained via the Surface Response Method
| Gastrosphere formulations | [Alginate] (%) | [Pectin] (%) | [PAA] (%) | [PLGA] (%) |
|---|---|---|---|---|
| 1 | 1 | 1 | 2 | 2 |
| 2 | 1 | 1 | 1.478 | 0 |
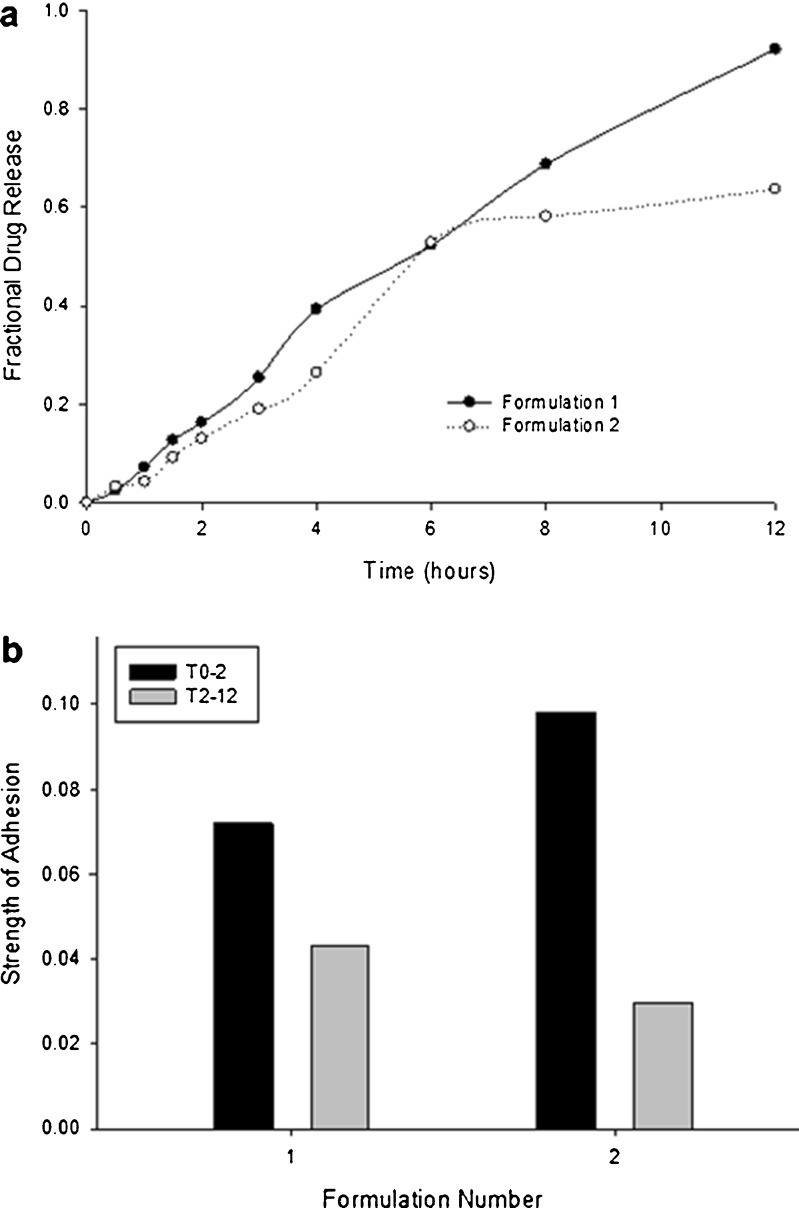
Drug release data obtained for the two optimized formulations are shown in Fig. 7a. It can be observed that the first optimized formulation displayed a more preferable profile due to the higher final drug release of 92% as compared to the 63% obtained from the second optimized formulation (Fig. 7a). From Fig. 7b, it is evident that Optimized Formulation 1 (OF1) possesses a much greater strength of adhesion after both t0–2 and t2–12 when compared with Optimized Formulation (OF2). Both ideal formulations were prepared in accordance with the optimal predicted settings. The experimentally derived values for the MDT, T0–2 and T2–12 of formulation OF1 was in close agreement with the predicted values, and is obviously a far superior formulation in comparison to formulation OF2.
Fig. 7.
Profiles showing a fractional drug release and b strength of adhesion obtained from the two optimized formulations
Chemical Structural Characterization of the Gastrospheres
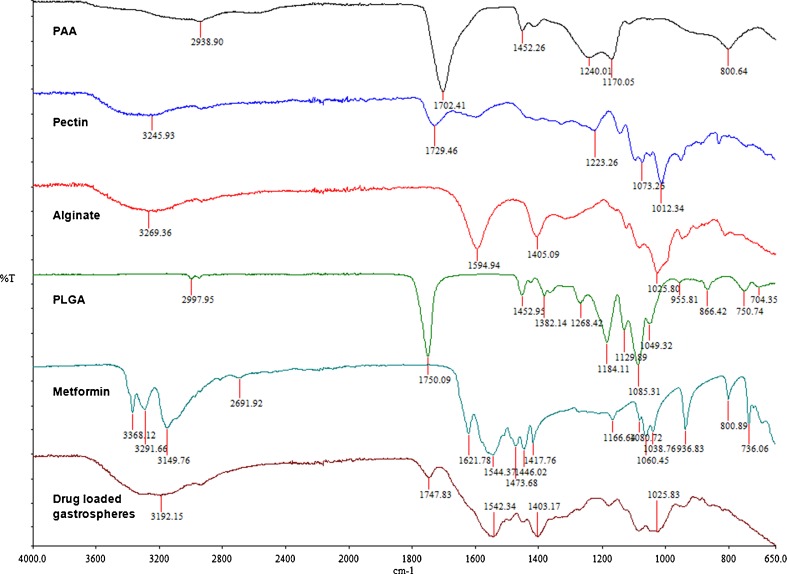
Figure 8 shows the FTIR spectra of each component polymer as well as that of the cross-linked gastrosphere and the drug metformin. It is evident that most of the strong bonds belonging to PLGA and PAA are still present, although to a lesser degree. These bonds include O–H stretching vibration (2,500–3,600 cm−1), ester bonds (1,600–1,800 cm−1), C=O stretching vibrations (1,590–1,750 cm−1) and C–O–C vibrations (1,000–1,200 cm−1). Notably, there was no overlapping tendency that featured between the wave bands of the native polymers and that of gastrospheres (Fig. 8) indicating that there was no interaction between the metformin and the polymers employed in the formulations.
Fig. 8.
FTIR spectra of the component polymers and the cross-linked gastrospheres
Analysis of Surface Area and Porosity
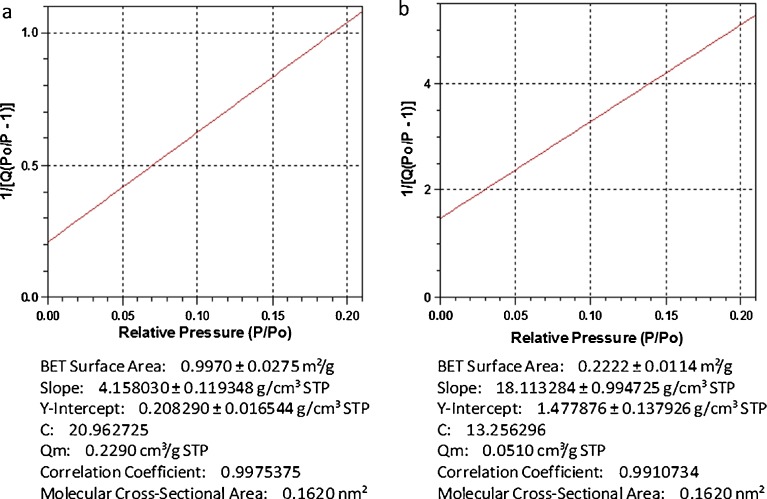
A comparison was made between a sample of gastrospheres which were lyophilized and a sample which was air-dried. The results of BET surface analysis are shown in Fig. 9. It could be visually elucidated that the air-dried sample was significantly smaller than the lyophilized sample due to structural collapse during the drying process. This was confirmed by the results obtained from the surface area analysis, which revealed that surface area and pore volume were reduced by 82.3% and 39.3%, respectively, with the exclusion of the lyophilization process. These results assist in emphasizing the importance of the lyophilization process in the development of a low-density gastrospheres, and therefore buoyant system.
Fig. 9.
BET surface analysis. a lyophilized and b air-dried gastrospheres
Surface Characterization of the Gastrospheres
Figure 10 shows an SEM image of a gastrosphere at a magnification of ×440. It was observed that the entire surface of the gastrospheres was covered with air pockets. This was significant since the extent or depth of pores in this regard was not of particular focus. The gastrospheres were not hydrated during SEM analysis in order for the air pockets to rupture and form pores. However, when these air pockets are in close proximity to the gastrosphere surface and when hydrated in the gastrointestinal tract, they rupture to form pores which affect drug release. The presence of these air pockets visually confirmed the morphology of the gastrospheres which was suitable to produce sufficient buoyancy upon hydration before drug release.
Fig. 10.
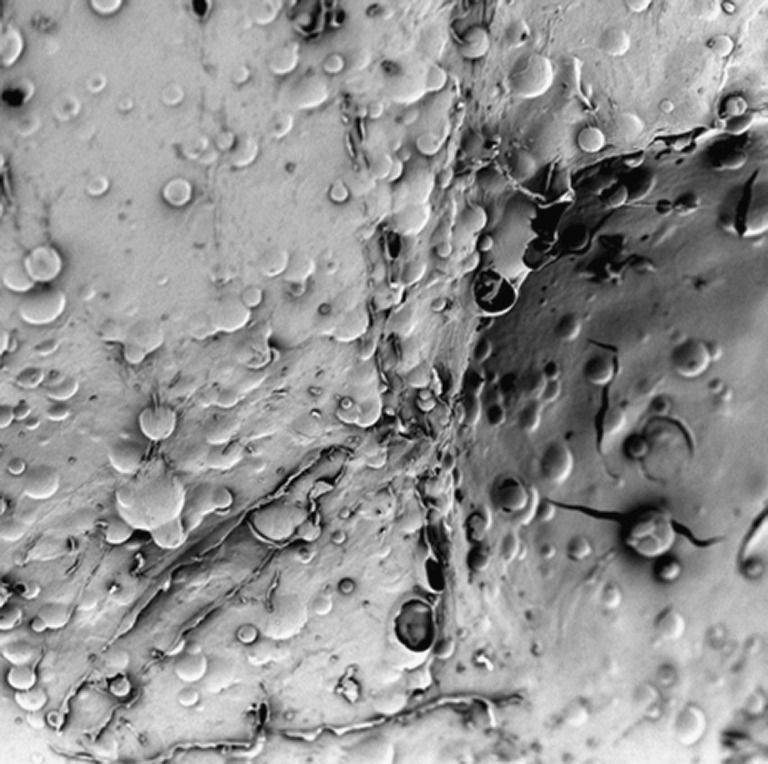
SEM image of the surface of a gastrosphere at a magnification of ×440
Molecular Mechanics Elucidation of the Performance of the Gastrospheres
The present communication dealt with the fabrication of a drug delivery system integrating a unique combination of polymers with acidic functionalities such as alginate (mannuronic and guluronic acid residues), pectin (galacturonic acid residues), PAA, and PLGA (polyhydroxy acid derivative of lactic and glycolic acid). Among these polymers, all except PLGA are known to exhibit interactions with divalent cations such as Ca2+ where alginate and pectin display cross-linking with Ca2+ ions (33) and polyacrylic acid exhibit complexation of calcium ions (34). It is evident from Table III that Alg–Ca2+ is energetically stabilized by 37 kcal/mol as compared to Alg because of strong electrostatic interactions along with high torsional energy. However, in case of Pec–Ca2+, the energy of interaction is about 9 kcal/mol mainly arising due to van der Waals forces. This somewhat hydrophobic stabilization was probably due to the presence of methyl groups (as methyl esters) in pectin structure. Furthermore, the Alg–Pec complex is destabilized by 13 kcal/mol demonstrating the necessity of cross-linking the bipolymeric structure with Ca2+ ions which was confirmed by the high degree of conformational stability (42 kcal/mol) in Alg–Pec–Ca2+. In addition, the cross-linked structures were more closely packed displaying the spatial preference of the polymeric chains in response to the presence of Ca2+. Both Alg–Pec and Alg–Pec–Ca2+ displayed intra- and inter-polymeric hydrogen bonding, although at different positions. These results are in line with the earlier reported studies where the polyguluronates (alginate) displayed better strength and the stereospecificity in binding to Ca2+ through “egg-box model” as compared to polygalacturonates (pectin) (35).
Table III.
Calculated Energy Parameters (kilocalories per mole) of the Polymer–Polymer and Polymer–Protein Assemblies’ Complexes Alg, Pec, PAA, PLGA, and Gylcosylated MUC
| Structure | Energy (kcal/mol) | |||||||
|---|---|---|---|---|---|---|---|---|
| Totala | ΔEb | Bondc | Angled | Dihedrale | VDWf | H bondg | Elech | |
| Alg | 74.426 | – | 5.204 | 32.485 | 34.108 | 30.709 | 0 | −28.142 |
| Alg Ca2+ | 36.548 | −37.452 | 5.502 | 30.586 | 40.364 | 35.197 | 0 | −75.102 |
| Pec | −68.280 | – | 5.231 | 50.779 | 59.971 | 15.331 | −8.022 | −191.564 |
| Pec Ca2+ | −76.894 | −8.614 | 5.194 | 50.977 | 60.072 | 6.704 | −8.024 | −191.817 |
| Alg–Pec | 19.509 | 13.363 | 10.923 | 85.783 | 97.369 | 26.523 | −8.034 | −193.054 |
| Alg–Pec Ca2+ | −22.862 | −42.371 | 11.215 | 84.019 | 100.076 | 32.13 | −8.699 | −241.603 |
| PAA | 10.258 | – | 1.517 | 7.178 | 4.244 | −2.540 | −0.142 | 0 |
| PAA Ca2+ | 1.597 | −8.661 | 1.504 | 7.202 | 4.151 | −11.117 | −0.143 | 0 |
| Alg–Pec–PAA | 2.167 | −17.342 | 13.099 | 98.079 | 104.553 | −8.058 | −9.624 | −195.883 |
| Alg–Pec–PAA Ca2+ | −48.238 | −50.405 | 13.124 | 96.918 | 104.16 | −11.512 | −11.336 | −239.593 |
| PLGA | 3.941 | – | 0.423 | 3.764 | 1.789 | −2.028 | −0.007 | 0 |
| Alg–Pec–PAA–PLGA | −48.608 | −54.346 | 13.786 | 109.649 | 106.446 | −63.481 | −9.367 | −205.64 |
| Alg–Pec–PAA–PLGA Ca2+ | −85.372 | −36.764 | 13.326 | 100.403 | 108.598 | −58.105 | −12.569 | −237.027 |
| GlycoMucin | −166.812 | – | 5.474 | 70.351 | 55.173 | −29.066 | −7.096 | −261.649 |
| GlycoMucin–polymers | −315.117 | −99.697 | 20.078 | 187.27 | 189.902 | −114.094 | −23.812 | −574.47 |
| GlycoMucin–polymers Ca2+ | −255.515 | −3.331 | 19.762 | 205.956 | 179.337 | −116.819 | −18.079 | −525.673 |
aTotal steric energy for an optimized structure
bΔEinteraction = E(Host/Guest) − E(Host) − E(Guest)
cBond-stretching contributions, reference values were assigned to all of a structure’s bond lengths
dBond angle contributions, reference values were assigned to all of a structure’s bond angles
eTorsional contribution arising from deviations from optimum dihedral angles
fvan der Waals interactions due to non-bonded interatomic distances
gHydrogen bond energy function
hElectrostatic energy
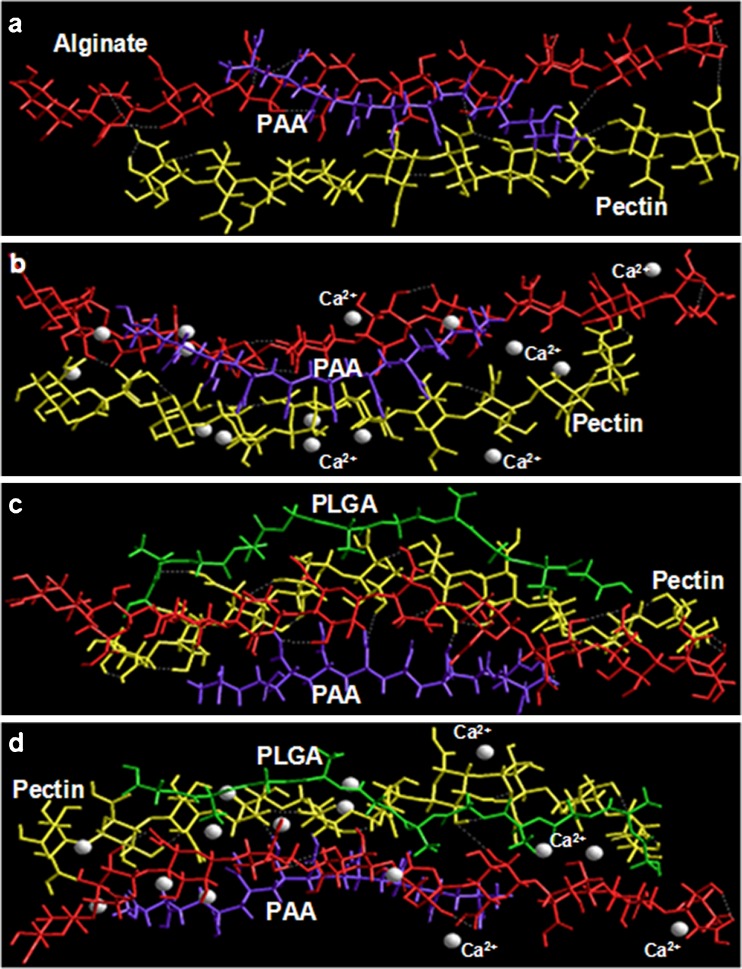
Likewise pectin, PAA–Ca2+ also displayed a rather small energy of interaction as compared to alginate and was stabilized mainly by the van der Waals forces owing to the presence of vinyl chain in the structure of PAA. The addition of PAA to Alg–Pec, further stabilized the polymeric structure by 17 kcal/mol instituted by all the non-bonding interactions viz., van der Waals forces, H-bonding and electrostatic interactions (Table III). These non-bonding interactions also contributed to the energy minimization of spatially constrained geometrical model of Alg–Pec–PAA–Ca2+ (Fig. 11a, b). It is noteworthy that the addition of PAA to Alg–Pec increased the inter-polymeric hydrogen bonding between alginate and pectin, and the addition of Ca2+ to Alg–Pec–PAA increased the structural integrity of the tripolymer complex as represented in Fig. 11. The formation of H-bonding between PAA and alginate and PAA and pectin can also be seen in Fig. 11 confirming the rationality of incorporating PAA in to the alginate–pectin platform. As expected, PLGA, a hydrophobic polymer, when added to the tripolymer complex displayed a very high energy of interaction (ΔE = −54.346) attributable to very high van der Waals interactions primarily due to non-bonded interatomic distances. Surprisingly, the total steric energy of this quad-polymer was almost equal to the Ca2+ cross-linked Alg–Pec–PAA and the ΔE of formation of both was also similar. However, the structural integrity in terms of closed packing was still a concern. The incorporation of Ca2+ to this quad-polymer decreased the bond angle contributions resulting in a more sterically constrained structure which was also responsible for the not-so-high ΔE in case of Alg–Pec–PAA–PLGA Ca2+. The aforementioned in silico results corroborated with the experimental in vitro drug release profiles in terms of MDT. The MDT decreased, and hence, the rate of drug release increased, with an increase in ALG/PEC and PAA levels from 1% to 1.5% at low and high levels of PAA and ALG/PEC, respectively. This increase in drug release with an increase in ALG/PEC and PAA may be due to the hydrophilic nature and hence increased swelling of the polymers leading to enhanced diffusion of the drug. Furthermore, an increase in polymer level, decrease the Ca2+ ions available per polymeric fragment resulting in a decrease in cross-linking and hence rigidity of the matrix (Fig. 11). However, a further increase in polymer levels from 1.5% to 2% increased the MDT and hence decreased the drug release. This may be attributed to the fact that with an increase in level of polymers, the polymer density increases and the space available for swelling decreases thereby decreasing the diffusion of the drug from the polymer matrix (Fig. 11). Furthermore, the increase in polymer density may have facilitate the Ca2+ to form all the possible associations with the ordered polyguluronate and polygalacturonate chains to form dimers resulting in a highly cross-linked polymeric framework (Fig. 11) (35). The increase in MDT with an increase in PLGA was obvious due to the fact that PLGA is hydrophobic and even energetically produced an effect similar to Ca2+ as described in the previous paragraph.
Fig. 11.
Energy minimized geometrical preferences of the multi-polymeric polyelectrolyte complexes derived from molecular mechanics calculations showing a alginate–PAA–pectin, b alginate–PAA–pectin Ca2+, c alginate–PAA–pectin-PLGA, and d alginate–PAA–pectin–PLGA
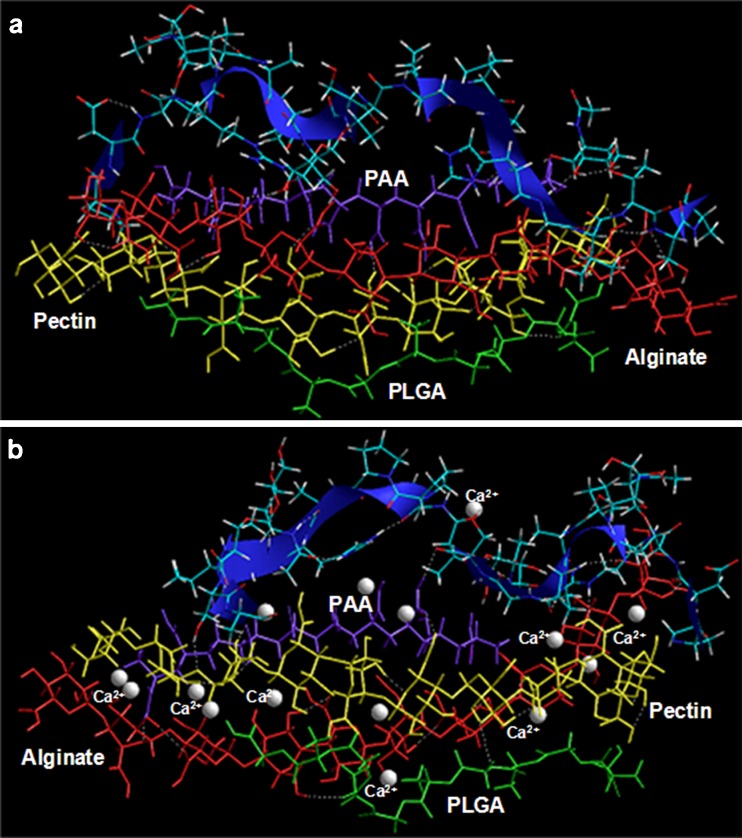
The bioadhesive or mucoadhesive potential of the multiparticulate delivery system was elucidated as being a measure of specific chemical interactions between the polymeric matrix (Alg–Pec–PAA–PLGA) or the Ca2+ cross-linked polymeric matrix (Alg–Pec–PAA–PLGA Ca2+) and the glycosylated gastric mucopeptide analogue after geometrical optimization using energy minimizations. The stress transduction for energy minimization was found to be a collective phenomenon including interactions in the form of van der Waals forces, H-bonding and electrostatic interactions contributing to the binding energy (Table III) while requiring a large fraction of the surface to establish connectivity between chemically transformed regions. The binding energy of the polymer matrix with MUC was quite high reaching up to 100 kcal/mol, confirming the significant interaction between the two (Fig. 12; Table III). However, the minimized energy increased significantly after introducing the Ca2+ ions in the MUC polymer system leading to a comparatively destabilized conformation. Additionally, the H-bonds formed between the polymer matrix and the MUC were lessened in case of Ca2+ cross-linked system. A deeper inspection of the MUC polymer shows that the specificity of this complex arises due to hydrophobic interactions of the methyl groups of the mucopeptide residues with oxygen atoms of the polymers. Furthermore, the binding was more pronounced with PAA and the polysaccharide chains, preferably the alginate, as depicted in Fig. 12. The inherent mechanism involved in the reduction and stabilization of Ca2+ cross-linked matrix may be attributed to the formation of a strained network structure due to calcium cross-linking thereby limiting the complete interaction as observed with the non-cross-linked structure (Fig. 12).
Fig. 12.
The chemical and geometrical binding interactions involving polymers and the glycosylated gastric mucopeptide analogue. a Glycomucin polymers and b glycomucin-polymers Ca2+. Polymers are depicted in tube rendering and MUC is depicted in stick rendering
The experimental mucoadhesion studies can as well be correlated to these in silico findings. Like MDT studies, mucoadhesion was also characterized by a “region of maximum” whereby the gastroadhesion was dependent on the swelling extent of the polymeric matrix. As described earlier in this communication, an optimum swelling was required for an effective bioadhesion. The 3D plot depicted an initial increase in mucoadhesion with increase in the amount of polymers up to the intermediate levels and decreased thereafter. Maximum mucoadhesion, therefore, was seen at the intermediate level of the polymer ratio. It may be because of the fact that the hydrogels swell readily (with higher amount of PAA) when they come in contact with hydrated mucous membrane and hydrogels become progressively rubbery due to uncoiling of polymer chains and subsequent increased mobility of the polymer chains resulting in a large adhesive surface for maximum contact with mucosa and flexibility to the polymer chains for interpenetration with mucosa (36). Increasing the alginate, pectin and PAA amount may provide more adhesive sites and polymer chains for interpenetration with mucosa, resulting consequently in the augmentation of mucoadhesive strength. On the other hand, a further increase in the amount of these hydrophilic polymers may render the network structure too loose to hold the tethered mucous chains thereby decreasing the mucoadhesion (36). PLGA appeared to play its role here in sustaining the matrix integrity by controlling the swelling of the matrix and hence the mucoadhesion.
CONCLUSIONS
A randomized Box–Behnken statistical experimental design was utilized in order to develop and optimize a novel approach for the formulation of gastrospheres intended for the delivery of narrow absorption window drugs. A range of formulations varying in release characteristics and gastroadhesion were obtained. Response surface design was employed in order to identify the relationships between the responses (MDT, T0–2 and T2–12) and the experimental factors (ALG/PEC, PAA, and PLGA). Optimization of experimental factors resulted in the generation of an optimal formulation possessing maximal gastroadhesion over the entire 12-h period as well as an MDT of 32.33, which is capable of displaying a zero-order rate of drug release. The molecular mechanics (MM) simulations ascertained that the in silico results corroborated well with the experimentally obtained in vitro drug release profiles. Furthermore, the bioadhesive or mucoadhesive potential of the multiparticulate delivery system was elucidated via MM simulations as being a measure of specific chemical interactions between the polymeric matrix (Alg–Pec–PAA–PLGA) or the Ca2+ cross-linked polymeric matrix (Alg–Pec–PAA–PLGA Ca2+) and the glycosylated gastric mucopeptide analogue after geometrical optimization using energy minimizations. Thus, stress transduction for energy minimization was found to be a collective phenomenon including interactions in the form of van der Waals forces, H-bonding, and electrostatic interactions contributing to the binding energy. The results obtained give much promise that the developed drug delivery system may find a good application in the delivery of narrow absorption window drugs.
REFERENCES
- 1.Chung HJ, Park TG. Surface engineered and drug releasing pre-fabricated scaffolds for tissue engineering. Adv Drug Delivery Rev. 2007;59:249–262. doi: 10.1016/j.addr.2007.03.015. [DOI] [PubMed] [Google Scholar]
- 2.Biondi M, Ungaro F, Quaglia F, Netti PA. Controlled drug delivery in tissue engineering. Adv Drug Delivery Rev. 2008;60:229–242. doi: 10.1016/j.addr.2007.08.038. [DOI] [PubMed] [Google Scholar]
- 3.Sam MT, Gayathri DS, Prasanth V, Vinod B. NSAIDs as microspheres. Internet J Pharmacol. 2008;6(1):1–8. [Google Scholar]
- 4.Gilhotra RM, Mishra DN. Polymeric systems for ocular inserts. In: Latest Reviews. 2009. Pharmainfo.net: Pharmaceutical information for you. http://www.pharmainfo.net/reviews/polymeric-systems-ocular-inserts [accssed May 30, 2010].
- 5.Uhrich KE, Cannizzaro SM, Langer RS, Shakesheff KM. Polymeric systems for controlled drug release. Chem Rev. 1999;99(11):3181–3198. doi: 10.1021/cr940351u. [DOI] [PubMed] [Google Scholar]
- 6.Klausner EA, Lavy E, Friedman M, Hoffman A. Expandable gastroretentive dosage forms. J Control Release. 2003;90(2):143–162. doi: 10.1016/S0168-3659(03)00203-7. [DOI] [PubMed] [Google Scholar]
- 7.Kim S, Kim JH, Jeon O, Kwon IC, Park K. Engineered polymers for advanced drug delivery. Eur J Pharm Biopharm. 2009;71(3):420–430. doi: 10.1016/j.ejpb.2008.09.021. [DOI] [PMC free article] [PubMed] [Google Scholar]
- 8.Davis SS. Formulation strategies for absorption windows. Drug Deliv Today. 2005;10(4):249–257. doi: 10.1016/S1359-6446(04)03351-3. [DOI] [PubMed] [Google Scholar]
- 9.Hoffman A, Stepensky D, Lavy E, Eyal S, Klausner E, Friedman M. Pharmacokinetic and pharmacodynamic aspects of gastroretentive dosage forms. Int J Pharm. 2004;277(1–2):141–153. doi: 10.1016/j.ijpharm.2003.09.047. [DOI] [PubMed] [Google Scholar]
- 10.Tang YD, Venkatraman SS, Boey FYC, Wang LW. Sustained release of hydrophobic and hydrophilic drugs from a floating dosage form. Int J Pharm. 2007;336(11):159–165. doi: 10.1016/j.ijpharm.2006.11.060. [DOI] [PubMed] [Google Scholar]
- 11.Singh BS, Kim KH. Floating drug delivery systems: an approach to oral controlled drug delivery via gastric retention. J Control Release. 2000;63(3):235–259. doi: 10.1016/S0168-3659(99)00204-7. [DOI] [PubMed] [Google Scholar]
- 12.Streubel A, Siepmann J, Bodmeier R. Drug delivery to the upper small intestine window using gastroretentive technologies. Curr Opin Pharmacol. 2006;6:501–508. doi: 10.1016/j.coph.2006.04.007. [DOI] [PubMed] [Google Scholar]
- 13.Chavanpatil MD, Jain P, Chaudhari S, Shear R, Vavia PR. Novel sustained release, swellable and bioadhesive gastroretentive drug delivery system for olfloxacin. Int J Pharm. 2006;316(1–2):86–92. doi: 10.1016/j.ijpharm.2006.02.038. [DOI] [PubMed] [Google Scholar]
- 14.El-Gibaly I. Development and in vitro evaluation of novel floating chitosan microcapsules for oral use: comparison with non-floating chitosan microspheres. Int J Pharm. 2002;249(1–2):7–21. doi: 10.1016/S0378-5173(02)00396-4. [DOI] [PubMed] [Google Scholar]
- 15.Fukuda M, Peppas NA, McGinity JW. Floating hot-melt extruded tablets for gastroretentive controlled drug release system. J Control Release. 2006;115(2):121–129. doi: 10.1016/j.jconrel.2006.07.018. [DOI] [PubMed] [Google Scholar]
- 16.Ahmed IS, Ayres JW. Bioavailability of riboflavin from a gastric retentive formulation. Int J Pharm. 2007;330(1–2):146–154. doi: 10.1016/j.ijpharm.2006.09.021. [DOI] [PubMed] [Google Scholar]
- 17.Corti G, Cirri M, Maestrelli F, Mennini N, Mura P. Sustained-release matrix tablets of metformin hydrochloride in combination with triacetyl-b-cyclodextrin. Eur J Pharm Biopharm. 2008;68(2):303–309. doi: 10.1016/j.ejpb.2007.06.004. [DOI] [PubMed] [Google Scholar]
- 18.Porta V, Schramm SG, Kano EK, Koono EE, Armando YP, Fukuda K, dos Reis Serra CH. HPLC-UV determination of metformin in human plasma for application in pharmacokinetics and bioequivalence studies. J Pharm Biomed Anal. 2008;46(1):143–147. doi: 10.1016/j.jpba.2007.10.007. [DOI] [PubMed] [Google Scholar]
- 19.Gibbon CJ, Blockman M. South African Medicines Formulary (SAMF) 8. Cape Town: Health and Medical Publishing Group of the South African Medical Association; 2007. [Google Scholar]
- 20.Stops F, Fell JT, Collett JH, Martini LG, Sharma HL, Smith AM. The use of citric acid to prolong the in vivo gastro-retention of a floating dosage form in the fasted state. Int J Pharm. 2006;308(1–2):8–13. doi: 10.1016/j.ijpharm.2005.09.036. [DOI] [PubMed] [Google Scholar]
- 21.Streubel A, Siepmann J, Bodmeier R. Floating microparticles based on low density foam powder. Int J Pharm. 2002;241(2):279–292. doi: 10.1016/S0378-5173(02)00241-7. [DOI] [PubMed] [Google Scholar]
- 22.Tu J, Bolla S, Barr J, Meidema J, Li X, Jasti B. Alginate microparticles prepared by spray-coagulation method: preparation, drug loading and release characteristics. Int J Pharm. 2005;303(1–2):171–181. doi: 10.1016/j.ijpharm.2005.07.008. [DOI] [PubMed] [Google Scholar]
- 23.Xu Y, Zhan C, Fan L, Wang L, Zheng H. Preparation dual crosslinked alginate-chitosan blend gel beads and in vitro controlled release in oral site-specific drug delivery system. Int J Pharm. 2007;336(2):329–337. doi: 10.1016/j.ijpharm.2006.12.019. [DOI] [PubMed] [Google Scholar]
- 24.Al-Kassas RS, Al-Gohary OMN, Al-Faadhel MM. Controlling of systemic absorption of gliclazide through incorporation into alginate beads. Int J Pharm. 2007;342(1–2):230–237. doi: 10.1016/j.ijpharm.2007.03.047. [DOI] [PubMed] [Google Scholar]
- 25.Itoh K, Hirayama T, Takahashi A, Kubo W, Miyazaki S, Dairaku M, Togashi M, Mikami R, Attwood D. In situ gelling pectin formulations for oral drug delivery at high gastric pH. Int J Pharm. 2007;335(1–2):90–96. doi: 10.1016/j.ijpharm.2006.10.042. [DOI] [PubMed] [Google Scholar]
- 26.Wei X, Sun N, Wu B, Yin C, Wu W. Sigmoidal release of indomethacin from pectin matrix tablets: Effect of in situ crosslinking by calcium cations. Int J Pharm. 2006;318(1–2):132–138. doi: 10.1016/j.ijpharm.2006.03.024. [DOI] [PubMed] [Google Scholar]
- 27.Khutoryanskiy VV. Hydrogen-bonded interpolymer complexes as materials for pharmaceutical applications. Int J Pharm. 2007;334(1–2):15–26. doi: 10.1016/j.ijpharm.2007.01.037. [DOI] [PubMed] [Google Scholar]
- 28.Jin L, Lu P, You H, Chen Q, Dong J. Vitamin B12 diffusion and binding in crosslinked poly(acrylic acid)s and poly(acrylic acid-co-N-vinyl pyrrolidinone)s. Int J Pharm. 2009;371(1–2):82–88. doi: 10.1016/j.ijpharm.2008.12.022. [DOI] [PubMed] [Google Scholar]
- 29.Mok H, Park TG. Water-free microencapsulation of proteins within PLGA microparticles by spray drying using PEG-assisted protein solubilisation technique in organic solvent. Eur J Pharm Biopharm. 2008;70(1):137–144. doi: 10.1016/j.ejpb.2008.04.006. [DOI] [PubMed] [Google Scholar]
- 30.Klose D, Siepmann F, Willart JF, Descamps M, Siepmann J. Drug release from PLGA-based microparticles: effects of the “microparticle:bulk fluid” ratio. Int J Pharm. 2010;383(1–2):123–131. doi: 10.1016/j.ijpharm.2009.09.012. [DOI] [PubMed] [Google Scholar]
- 31.Pillay V, Fassihi R. In vitro release modulation from crosslinked pellets for site-specific drug delivery to the gastrointestinal tract: comparison of pH-responsive drug release and associated kinetics. J Control Release. 1999;59(2):229–242. doi: 10.1016/S0168-3659(98)00196-5. [DOI] [PubMed] [Google Scholar]
- 32.Hopfenberg HB, Hsu KC. Swelling-controlled constant rate delivery systems. Polym Eng Sci. 1978;18(15):1186–1191. doi: 10.1002/pen.760181511. [DOI] [Google Scholar]
- 33.da Silva MA, Bierhalz ACK, Kieckbusch TG. Alginate and pectin composite films crosslinked with Ca2+ ions: effect of the plasticizer concentration. Carbohyd Polym. 2009;77:736–742. doi: 10.1016/j.carbpol.2009.02.014. [DOI] [Google Scholar]
- 34.Kriwet B, Kissel T. Interactions between bioadhesive poly(acrylic acid) and calcium ions. Int J Pharm. 1996;127(2):135–145. doi: 10.1016/0378-5173(95)04098-6. [DOI] [Google Scholar]
- 35.Braccini I, Pérez S. Molecular basis of Ca2+-induced gelation in alginates and pectins: the egg-box model revisited. Biomacromolecules. 2001;2:1089–1096. doi: 10.1021/bm010008g. [DOI] [PubMed] [Google Scholar]
- 36.Kumar P, Bhatia M. Functionalization of chitosan/methylcellulose interpenetrating polymer network microspheres for gastroretentive application using central composite design. PDA J Pharm Sci Technol. 2010;64(6):497–506. [PubMed] [Google Scholar]


