Abstract
The current challenge in designing effective drugs against HIV-1 is to find novel candidates with high potency, but with a lower susceptibility to mutations associated with drug resistance. Trying to address this challenge we developed in our previous study1 a novel computational strategy for fighting drug resistance by predicting the likely moves of the virus through constraints on binding and catalysis. This has been based on calculating the vitality values (defined as the ratio ((Kikcat/KM)mutant/ (Kikcat/KM)wild-type) and using it as guide for the moves of the virus. The corresponding calculations of the binding affinity, Ki, were based on using the semi-macroscopic version of the protein dipole Langevin dipole (PDLD/S) in its linear response approximation (LRA) in its β version (PDLD/S-LRA/β). We, also, calculate the proteolytic efficiency, kcat/KM, by evaluating the transition state (TS) binding free energies using the PDLD/S-LRA/β method. Here we provide an extensive validation of our strategy by calculating the vitality of six existing clinical and experimental drug candidates. It is found that the computationally determined vitalities correlate reasonably well with those derived from the corresponding experimental data. This indicates that the calculated vitality may be used to identify mutations that would be most effective for the survival of the virus. Thus, it should be possible to use our approach in screening for mutations that would provide the most effective resistance to any proposed antiviral drug. This ability should be very useful in guiding the design of drug molecules that will lead to the slowest resistance.
Keywords: mutation screening, transition state, binding affinity, empirical valence bond, coarse grained model
I. INTRODUCTION
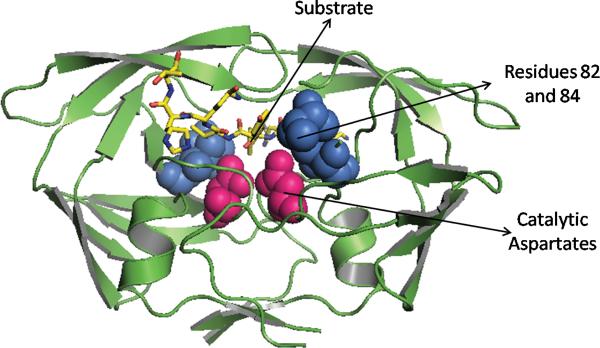
Human immunodeficiency virus type-1 (HIV-1) protease is an important target of Acquired Immunodeficiency Syndrome (AIDS) therapy. The protease is composed of two structurally identical monomers with a pair of catalytic aspartyl residues (D25 and D25') situated at the bottom of a deep cavity in close proximity to the symmetry axes and the scissile bond of the substrate.2, 3 This cavity is covered by a so-called flap that controls the access of the substrate or an inhibitor into the binding pocket.4 The enzyme cleaves the virally encoded gag and gag-pol polyproteins, which is an essential step for the replication of the HIV,5, 6 releasing enzymes and structural proteins that are essential for viral infectivity (Figure 1).7, 8 Inhibition of HIV protease activity in infected cells leads to production of immature, non-infectious viral particles.
Figure 1.
Showing the HIV-1 protease dimer, highlighting the two catalytic aspartates, the P1 and P1' site residues (Val82 and Ile84), and the substrate (ATHQVY*FVRKA: where `*' designate the site of cleavage).
Clinically, protease inhibitors are an effective and widely used class of drugs against the HIV.9 With the exception of tiprinavir, all clinically approved protease inhibitors are peptidic in nature and mimic the structure of the natural substrate where the scissile peptide bond is replaced by an uncleavable hydroxyethylene or hydroxyethylamine linkage. These inhibitors interact with the active site and some non-active site residues. Mutations in the protein residues may affect affinity for either inhibitor or substrate, or both by altering their contacts with the interacting residues. Thus, in the presence of a protease inhibitor, there is a replicative advantage for the HIV variants in the viral population that lowers inhibitor affinity, while maintaining sufficient catalytic efficiency for the post-translational processing of the polyprotein gene products of gag and gag-pol.
Although protease inhibitors show significant effectiveness in preventing the progression of HIV infection, their long-term therapeutic efficacy is limited, due to the rapid emergence of drug-resistant variants. High replication rates (108−109 virions/day), error-prone reverse transcriptases (error rate ~ 1 in 10,000 bases) as well as replication strategies favoring genetic recombination result in rapid evolution of drug resistant variants.10 Consequently, the pervasive emergence of antiviral resistance is a general problem for current antiviral therapy. Thus, the current pharmaceutical challenge is to discover potent antiviral agents which keep plasma viral load at undetectable levels while obstructing the development of drug resistance.
The availability of the three-dimensional structures with a plethora of information on drug-resistance mutations has enabled the use of molecular modeling and other structure-based approaches to evaluate various factors that contribute to the protein-inhibitor binding of the wild-type as well as mutant enzymes. In particular, the investigation of binding free energies of drugs to different mutants is thought to provide some clues about the resistance mechanism. However, considering the enormity of possible mutants, one needs to find constraints that will drastically limit search for viable mutations. In general, the constraints that can limit active mutations in enzymes include correct protein folding, the overall stability and the catalytic function. In HIV-1 protease, the dimeric nature of the enzyme presents an additional constraint in that every mutation at the genetic level results in a double mutation at enzyme level. The cleavage sites of HIV-1 protease recognizes and accommodates at least nine different polyproteins, and share very low sequence similarity. This further restricts appearance of mutations that will reduce processing below certain threshold level. Of course, incorporating relevant constraints in computational screening presents a significant challenge.
Several interesting attempts to explore drug resistance of HIV-1 proteases have been reported.11–13 For example, Wang and coworkers proposed analyzing the energetics of binding and residue variability at each sequence position of HIV-1 protease on the basis of which they tried to predict mutations that may cause drug resistance.11, 13 These studies suggested that designing drugs that interact more strongly with highly conserved residues may limit the emergence of resistance. However, the above approach failed to predict the most likely mutation that may be selected under pressure of an inhibitor when two different protease inhibitors exhibit the same elevated Ki toward a particular mutant. Apparently, focusing only on the binding affinity does not provide sufficiently effective constraints on the design of drugs that can fight the drug resistance problem. In this context, the concept of vitality14 that describes the correlation between enzyme activity and inhibition of antiviral replication, suggests a promising direction. That is, according to the vitality concept, by comparing the parameters for activity and inhibition of wild-type and mutant enzymes, one may be able to predict the more likely drug resistance mutation as the one that allows higher kcat/KM and largest Ki in the mutated enzyme. Thus, the vitality may provide a way to predict the selective advantage of different mutants in the presence of a particular inhibitor to wild type HIV-1 protease.1, 14 More specifically, the virus must develop mutations that allow its enzymes to perform their functions, while reducing the binding affinity of the currently available drugs. With this idea in mind we developed a strategy for avoiding resistance, based on analyzing and predicting vitality of different mutations and thereby, anticipating the moves of pathogen. This strategy can be used to design effective inhibitors that target different mutants and thus, may reduce the resistance problem.
The initial study of ref1 established, as a proof of principle, our ability to reproduce the observed vitality factors for HIV-1 protease and DMP323. This work successfully reproduced the effect of polar / ionized, as well as more difficult to predict, non polar residues. Exploiting our initial success in predicting drug resistant mutations that evolved against one inhibitor, we report here an extensive validation study with HIV drug resistant mutants that evolved under drug pressure. The performance of our approach in this validation study provides an encouraging support for its potential in fighting drug resistance.
II. METHODS AND SYSTEMS
II.1 CATALYTIC MECHANISM
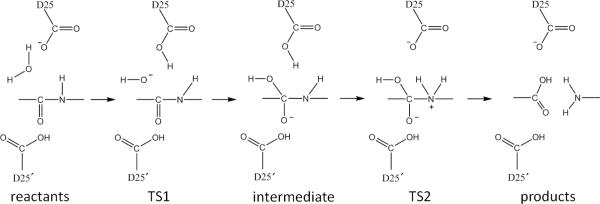
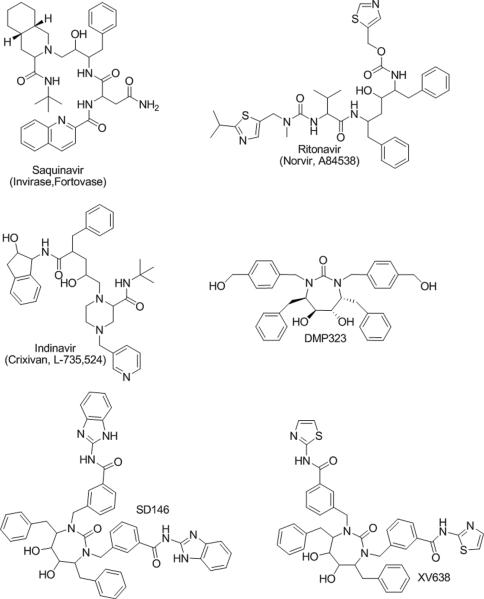
Our approach requires one to determine the transition state (TS) for the relevant enzymatic reaction, since this is needed for calculations of the TS binding energy. In this respect we noted that the catalytic mechanism of aspartic proteases has been studied extensively and that several mechanisms of action have been proposed.15–21 Some of the proposed mechanisms reflect the problematic low barrier Hydrogen bond proposal (e.g., Ref20) and/or reflect gas phase calculations (e.g., Ref16) that cannot capture the effect of the enzyme. At present, the most convincing and reliable theoretical study is provided by the EVB study of Åqvist and coworkers,15, 22 who reproduced quantitatively the observed catalytic effect of the enzyme by the mechanism depicted in Figure 2. In this mechanism, the negatively charged aspartyl residue abstracts a proton from the catalytic active site water molecule located between the active site aspartates. The resulting hydroxide ion acts as a nucleophile and attacks the carbonyl carbon of the amide bond yielding an oxyanion tetrahedral intermediate. Subsequently, the aspartic residue, which functioned as a general base in the previous step, acts as a general acid and donates a proton to the nitrogen which then spontaneously dissociates to hydrolysis products.15, 21 The other aspartic residue, which is protonated, stabilize the negative charge on the transition state (TS2) carbonyl oxygen. Here we consider the same mechanism after verifying that is presents the most reasonable option. The inhibitors considered in this work are depicted in Chart 1.
Figure 2.
The most likely catalytic mechanism for HIV-1 protease.
Chart 1.
Our strategy for calculating the TS and the TS binding free energy will be described below.
II.2 COMPUTATIONAL METHODOLOGIES
II.2.a Binding Free Energy Calculations
A key part of our screening approach involves the ability to obtain reliable binding free energies. This is accomplished by using the PDLD/S-LRA/β method. 23–25 This method evaluates both the electrostatic and non-electrostatic contributions to the binding free energy. The electrostatic part is evaluated by the PDLD/S-LRA considering the electrostatic free energy of transferring a given ligand (l) from water to the protein by using:
| (1) |
where ΔG is the free energy of charging the ligand in the given environment (i.e., w or p).
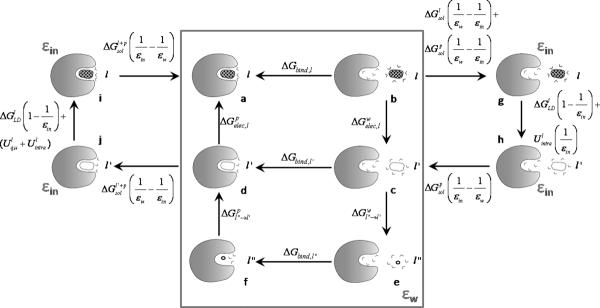
Using the cycle in Figure 3, we start with the effective PDLD/S-LRA potentials:
| (2) |
| (3) |
where ΔGsol denotes the electrostatic contribution to the solvation free energy of the indicated group in water (e.g., denotes the solvation of the protein-ligand complex in water). To be more precise, ΔGsol should be scaled by 1 / (1 − 1/εw), but this small correction is neglected here. The values of the ΔGsol's are evaluated by the Langevin dipole solvent model. is the electrostatic interaction between the charges of the ligand and the protein dipoles in vacuum (this is a standard PDLD notation). In the present case, . is the intramolecular electrostatic interaction of the ligand. B and UB stand for calculations with the ligand is bound and unbound respectively. The dielectric εp which is called εin in Figure 3 is a parameter whose nature is considered in many of our works (e.g., Ref26). Now, the PDLD/S results obtained with a single protein-ligand configuration cannot capture properly the effect of the protein reorganization (see discussion in Ref27). A more consistent treatment should involve the use of the LRA or related approaches (e.g., Ref27, 28). This approach provides a quite reliable approximation for the corresponding electrostatic free energies by:24
| (4) |
where the effective potential U is defined in Eqs. 2 and 3, and 〈〉l and 〈〉l' designate an MD average over the coordinates of the ligand-complex in their polar and non-polar forms. It is important to realize that the average of Eq. 4 is always calculated where both contributions to the relevant are evaluated at the same configurations. That is, the PDLD/S energies of the polar and non-polar states are evaluated at each averaging step by using the same structure. However, we generate two set of structures - one from MD runs on the polar state and one from MD runs on the non-polar state. This is basically the same approach used in the microscopic LRA but with the effective potential, .
Figure 3.
A thermodynamic cycle for calculating binding energy using the PDLD/S method. l and l′ represents the charged and uncharged forms of the ligand, respectively, while ℓ″ and represents the ligand being reduced to “nothing”. The inner binding cycle (b→c→d→a) corresponds in part to the cycle described in Ref28. The electrostatic terms associated with b→c and d→a are evaluated by the external cycles in the figure (b→g→h→c and d→j→i→a) and are evaluated by using Eqs. 2 and 3 (in the text) with εin = 4. The free energy and the other contributions of are evaluated by Eq. 5 (in the text) using an approximation to the c→e→f→d cycle. For more details, see Ref24, 25.
The non-electrostatic term is evaluated by the approach described in Ref24, considering the contribution of the hydrophobic effect (using a field dependent hydrophobic term), the contribution of water penetration and van der Waals effect. Our full treatment can also include calculations of binding entropy by a restraint release (RR) approach (see Ref24), which is not used in the PDLD/S-LRA calculations (note that the LRA/β include configurational entropy term implicitly in the β term). However, in some cases, we use a version where the non-electrostatic contribution is evaluated by the same β term used in the LRA/β approach. Consequently, we use:
| (5) |
This is referred to as the PDLD/S-LRA/β approach.
For the purpose of qualitative assessment, one may make use of the electrostatic group contributions that offers an extremely fast way for the initial screening using a single set of MD run on the native protein. The group contribution is defined as the effect of mutating all the residual charges of the given group to zero. In principle, one may perform such mutations and evaluate the PDLD/S-LRA binding energy for the given native and mutant. However, when we are dealing with charged and polar residues, it is reasonable to start with the faster screening approximation introduced by Muegge and coworkers.29, 30 This approach evaluates the electrostatic group contributions to the binding energy by looking at the second term in Eq. 2. This leads to
| (6) |
where εx = 4 for polar residues and εx = εeff ≈ 40 for ionized residues.
Recently, we demonstrated the ability of our PDLD/S-LRA/β method to accurately predict the absolute binding free energies of large number of structurally diverse inhibitors and discussed its implication as an effective scoring function.25 Besides the PDLD/S-LRA/β, another widely used physics-based approach to score protein-ligand affinity is the molecular mechanics Poisson–Boltzmann/surface area (MM/PBSA).25, 31 This approach has also been used in studies of drug resistance11–13 (without the vitality crucial constraint). We note, however, that although the MM/PBSA simulations of several protein–ligand systems have been widely reported in the literature, is has drawn some criticism.32, 33 In particular, although the MM/PBSA and the molecular mechanics generalized born/surface area (MM/GBSA) methods has clear similarity to our earlier PDLD/S-LRA idea of MD generation of conformations for implicit solvent calculations, but these methods only calculate the average over the configurations generated with the charged solute whereas ignoring the uncharged term. In the MM/PBSA approach, rather than looking for more physical (and complex) implicit solvent representations. More importantly, this approach has major problems, such as the treatment of the protein dielectric and the problematic entropic treatment (see Ref26). In any rate, using the vitality concept may also augment the applicability of the MM/PBSA.
The actual calculations of the binding free energy were performed using the Surface Constrained All-Atom Solvent (SCAAS)34 boundary conditions and the Local Reaction Field (LRF) long-range treatment35 that provides a very efficient way of solving the problem of a proper treatment of long-range electrostatic interactions. The boundary condition for the protein system is described in Figure S1 (see SI). The binding free energy of the relaxed structures was evaluated by placing the ligand bound to the protein inside a water sphere of a 16Å radius. Considering the ligand at the center, the protein-water sphere was completed to a radius of 18Å by surrounding it with a grid of Langevin dipoles. The region beyond the 18Å radius was treated as a continuum. A small harmonic potential of the form, , with A = 0.03 kcal mol−1Å−2, was applied in order to keep the protein atoms near the corresponding observed positions. The protein atoms outside this sphere were held fixed and their electrostatic effect excluded from the model. The MD simulations were performed with the built in polarizable ENZYMIX forcefield.23, 24, 36 Additionally, the PDLD/S simulation system involved the replacement of the explicit water in the SCAAS model by the Langevin dipoles. The PDLD/SLRA/β simulations involved the generation of five configurations in the charged and uncharged forms of the ligand by MD runs of 10ps with a 1fs time step at 300K, and an automatic averaging of the corresponding PDLD/S effective potential for the generated configurations.
The starting coordinates of the HIV-1 protease in complex with their respective ligands were obtained from the Protein Data Bank (PDB).37 The PDB IDs and the corresponding resolutions of the X-ray crystallographic structures used in this study are as follows: 1QBS38 (DMP323; 1.8 Å), 1HSH39 (Indinavir; 1.9 Å), 1HXW40 (Ritonavir; 1.8 Å), 3D1Y41 (Saquinavir ; 1.05 Å), 1QBR42 (XV638; 1.8 Å) and 1QBT42 (SD146; 2.1 Å).
The partial atomic charges of the ligands were determined from the electronic wave functions by fitting the resulting electrostatic potential in the neighborhood of these molecules using Merz-Kollman scheme. The electronic wave functions were calculated with hybrid density functional theory (DFT) at the B3LYP/6-311G** level, performed with the Gaussian03 package.43
Depending on the inhibitor, either the symmetrically related D25 or D25' of the HIV-1 protease may be protonated in a complex.
II.2.b Empirical Valence Bond (EVB) Calculations
Our computational strategy requires us to first simulate the catalytic mechanism of the peptide bond cleavage by HIV-1 proteases. As discussed above we considered here the two TSs in the catalytic reaction of HIV-1 protease (see Figure 2) and focused on the TS of the rate-limiting step TS1→Int. The calculations of the activation free energy profile and the TS were performed by the empirical valence bond (EVB) method.44 This method, which has been described extensively elsewhere, 44–46 is an empirical quantum mechanics/molecular mechanics (QM/MM) method that can be considered as a mixture of diabatic states describing the reactant(s), intermediate(s) and product(s) in a way that retains the correct change in structure and charge distribution along the reaction coordinate. The EVB diabatic states provide an effective way for evaluating the reaction free energy surface by using them for driving the system from the reactants to the product states in a free energy perturbation umbrella sampling procedure (see Ref44–46). The reason for the remarkable reliability of the EVB is that it is calibrated on the reference solution reaction and then the calculations in the enzyme active site reflect (consistently) only the change of the environment, exploiting the fact that the reacting system is the same in enzyme and solution. Thus, the EVB approach is calibrated only once in a study of a given type of enzymatic reaction.
The EVB calculations were evaluated by using the MOLARIS simulation program using the ENZYMIX force field.23, 36 The EVB activation barriers were calculated at the configurations selected by using the same free energy perturbation umbrella sampling (FEP/US) approach used in all of our EVB studies. 47–49 The simulation systems were solvated by the surface-constrained all atom solvent (SCAAS) model34 using a water sphere with a radius of 18Å, centered on the substrate and surrounded by total of 20Å grid of Langevin dipoles and then by a bulk solvent, while long-range electrostatic effects were treated by the local reaction field (LRF) method.35 The EVB for the present reaction has been constructed by using the EVB states described in Figure 2 (see also Figure S2 in SI). The EVB region consisted of the peptide bond of the substrate, water molecule and the carboxylate ion of the D25 (the D25' group does not change its protonation state and is kept in classical region). The EVB parameters are described in Figure S2, Table SI and SII (see SI). All acidic and basic residues (R8 and R8', D29 and D29', D30 and D30', R87 and R87') were considered ionized based on pKa calculations (see Table SIII in SI) performed by the PDLD/S approach of the MOLARIS program.23, 27, 36 The residue D25' was kept protonated during the EVB calculations. The FEP mapping was evaluated by 21 frames of 10 ps each for moving along the reaction coordinate with our all atom surface-constrained spherical model in water as well as in protein. Initial relaxations were performed at low temperature 30K for 40ps for each system. All the simulations were conducted at 300K with a time step of 1fs with small region I constraints of 0.3 kcal mol−1Å−2 in order to keep the reacting fragments near the corresponding observed positions. The simulations were repeated 5 times in order to obtain reliable results with different initial conditions (obtained from arbitrary points of the relaxation trajectory). This simulation protocol was applied to both reaction steps, the proton-transfer and the nucleophilic attack.
II.2.c Calculating the Vitality Value
HIV can acquire drug resistance by mutating an enzyme (here HIV protease) such that it reduces the affinity of the drug to the enzyme (large Ki) while maintaining a reasonable catalytic efficiency towards the native substrate (namely, large kcat/KM) which is important for the virus's viability. One way to outmaneuver the virus is by designing inhibitors whose binding to HIV protease cannot be reduced by mutations without significantly reducing its catalytic efficiency. Effective computational screening requires constraints on the ability of the virus to perform its specific function. With this in mind, we calculate the effect of mutating protein residues with respect to its affect on the substrate/drug binding and express the ratio as vitality value (γ) as follows:
| (7) |
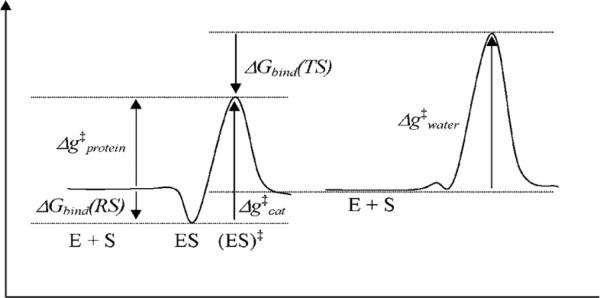
Our aim is to express the vitality value in terms of relevant free energies. We start by noting that the energetics of a chemical reaction in enzyme and in water can be described by the free energy surface of Figure 4.
Figure 4.
Defining key parameters that determine the catalytic effect. ΔGbind(RS) and ΔGbind(TS) stand for the binding energies of the reactant state and transition states, respectively. E, S, E + S, ES, and (ES)‡ stand for enzyme, substrate, enzyme + substrate isolated in water, enzyme-substrate complex, and enzyme-substrate complex in the transition state.
Using this figure and standard kinetic description (e.g., see Ref44), we may write
| (8) |
| (9) |
| (10) |
| (11) |
Using Eq. 8, we can write
| (12) |
Using Eq. 9, we can write
| (13) |
Combining Eqs. 12 and 13, we obtain
| (14) |
Similarly, the binding affinity (Ki) of the drug may be calculated from free energy estimates for the binding of the drug to the native or the mutant enzyme.
| (15) |
The vitality ratio, γ = Kikcat / KM, can also written as
| (16) |
Finally, we may write
| (17) |
where M and N denote mutant and native form of the protein, respectively.
A high vitality value suggests that the given mutation will adversely affect the inhibitor binding more than its effect on the catalytic efficiency of the protease and hence will have a greater chance to be integrated as a resistance mutation.
The TS binding free energy ΔGbind(TS) was calculated using PDLD/S-LRA/β method (for details, see Methodology section II.2.a) and its corresponding values were converted to kcat/KM using Eq. 14. The substrate TS1' model was taken from the rate-limiting step TS1 → Int of the EVB calculations for the subsequent calculations of the TS binding free energy ΔGbind(TS). The structure of the HIV-1 protease-substrate complex was taken from the available X-ray structure (PDB ID: 2NXL; 2.0 Å)50 with a bound long substrate peptide (GAEVF*YVDGA). Since this structure represents an inactive variant (D25N) of HIV-1 protease, residues N25 and N25' were mutated back to D25 and D25'. Finally, the substrate was modified to the peptide THQVY*FVRK as shown in Figure 1 for our binding studies, to reproduce the experimental vitality values reported in Ref 51. For the calculations of the ΔGbind(TS), the partial atomic charges of the transition-state model TS1' (see Figures S2 and S3) were calculated using Gaussian03 package.43 All the acidic and basic residues were considered to be ionized, except for one of the two D25 residues in TS2, that was protonated in accordance with the pKa calculations (see Table S3 in the SI) performed by the PDLD/S approach of the MOLARIS program.23, 27, 36
III.RESULTS AND DISCUSSION
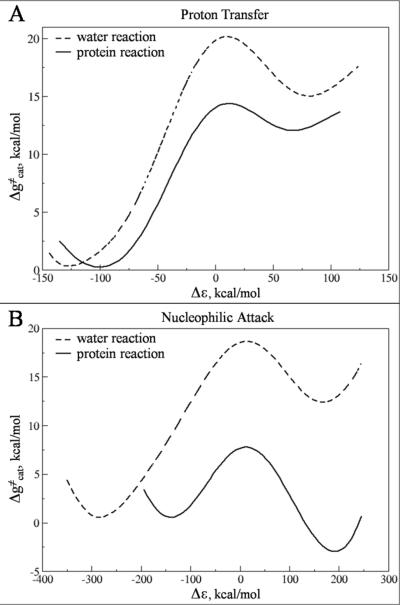
The main effort in this work has been directed at the validation of a reliable computational tool for a reasonably fast detection of existing and likely to emerge resistance mutations. This approach should help in designing modifications of protease inhibitors to improve their effectiveness for resistant variants of HIV-1 protease. The first step toward achieving this task involved modeling the enzymatic reaction and gaining a quantitative understanding of the nature of the substrate TS. The modeling of the catalytic mechanism of HIV-1 protease was accomplished, following Ref22, using the EVB method (as described in the Methodology section II.2.b) with its free energy perturbation / umbrella sampling treatment 44, 46 The parameters for the EVB surface were calibrated by forcing the free energy profile for the solution reaction to reproduce the corresponding results from high level ab initio calculations and the experimental information considered in Refs15, 22, 52–54 (the detailed description of the calibration procedure for is given in Ref 15, 22). The calibrated EVB parameters were kept unchanged for the generation of the protein EVB surface. The free energy profiles from EVB simulations of both the solution and enzyme reactions are summarized in Figure 5 and in Table I. Overall, the calculated activation free energies are in agreement with experimental data derived from transition state theory.
Figure 5.
The calculated free energy profile for the peptide hydrolysis reaction catalyzed by HIV-1 protease. The figure depicts the activation free energy barriers for the reaction in water (dashed line) as well as the reaction in protein (solid line).
Table I.
Observed and calculated reaction free energies (ΔG0) and activation free energies (ΔG≠) of the uncatalyzed reaction in water and HIV-1 protease.c
The experimental information of the uncatalyzed reaction in water are taken from Ref15.
The experimental information of the reaction in protein are taken from Ref51.
The EVB parameters used in calculations are described in the Table SI and Table SII (see SI). ψ1,ψ2 and ψ3 designates the reactant state (RS), the TS1 and the intermediate (Int) respectively (See Figure 2).
The substrate TS1' geometry (depicted in Figure S3 in the SI) and the charge distribution (Figure S2 in SI) was used as a guide in generating a TS model for the subsequent calculations of the TS binding free energy.
Although one may argue that different peptide substrates may yield different vitality values55, 56 we believe that changing substrates should not have an effect on the correlation for a set of HIV protease inhibitors toward mutation. In the future, we may include several different substrates representing the natural cleavage sites in the gag and gap-pol polyproteins. In general however there should not be a major problem in considering several substrates in a globally optimized function.
The binding free energies of the generated substrate TS1' model was calculated using our PDLD/S-LRA/β method51 (see section II) and this value was, in turn, utilized to calculate kcat/KM for the native as well as mutant forms of HIV-1 protease.
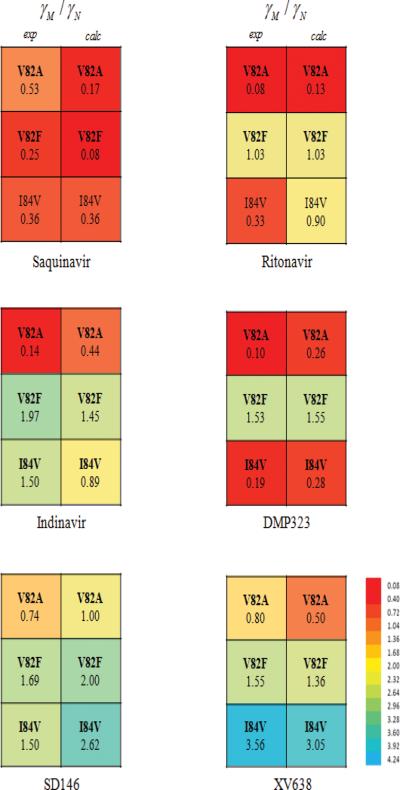
Following the calculations of the TS binding free energy we evaluated the absolute binding free energies of the drugs/inhibitors and compared them with the corresponding experimentally determined energies.51 The calculated and observed results are summarized in Tables II, III and Figure 6. As seen from the figure we obtained significant correlation between the calculated and experimental vitality values, indicating the usefulness of the modeling approach in predicting drug resistant mutations (Figure 7).
Table II.
Calculated and experimentally observed catalytic efficiency for wild-type (WT) and mutant HIV-1 protease.
| PDLD/S-LRA/βa |
||||||
|---|---|---|---|---|---|---|
| (default; β = 0.25) | (fitted d; β = 0.26) | (kcat/KM)calca (X 10−3) | (kcat/KM)expa, b (X 10−3) | |||
| WT | −5.97 | −28.33 | −13.05 | −13.34 | 21.35 | 29.9 |
| V82F | −5.93 | −29.06 | −13.20 | −13.49 | 27.51 | 35.4 |
| V82A | −5.37 | −31.27 | −13.19 | −13.50 | 28.20 | 34.2 |
| I84V | −5.41 | −27.78 | −12.36 | −12.63 | 6.50 | 7.6 |
All binding free energies are in kcal/mol. The catalytic efficiencies, kcat/KM, are in M−1 s−1.
The experimental catalytic efficiencies, kcat/KM, are taken from Ref51.
Table III.
Calculated and Experimentaly observed Vitality values for Mutant Proteases.a
| Inhibitor | Mutation |
Ki (inhibitor) |
kcat/KM (substrate TS) |
Vitality |
|||||||
|---|---|---|---|---|---|---|---|---|---|---|---|
|
(fitted; β = 0.26) |
(γM / γN)exp | (γM / γN)calc | |||||||||
| Saquinavir | WT | −13.39 | −13.69 | −13.53 | −13.34 | - | - | - | - | - | - |
| V82A | −13.09 | −12.48 | −13.61 | −13.49 | −0.3 | 0.08 | −0.91 | 0.15 | 0.53 | 0.17 | |
| V82F | −12.68 | −12.16 | −13.63 | −13.63 | −0.71 | 0.1 | −1.23 | 0.29 | 0.25 | 0.08 | |
| I84V | −11.99 | −12.07 | −12.73 | −12.63 | −1.4 | −0.8 | −1.32 | −0.71 | 0.36 | 0.36 | |
| Ritonavir | WT | −13.32 | −12.7 | −13.53 | −13.34 | - | - | - | - | - | - |
| V82A | −11.89 | −11.66 | −13.61 | −13.49 | −1.43 | 0.08 | −1.04 | 0.15 | 0.08 | 0.13 | |
| V82F | −13.44 | −13.01 | −13.63 | −13.63 | 0.12 | 0.1 | 0.31 | 0.29 | 1.03 | 1.03 | |
| I84V | −11.86 | −11.93 | −12.73 | −12.63 | −1.46 | −0.8 | −0.77 | −0.71 | 0.33 | 0.9 | |
| Indinavir | WT | −13.44 | −12.54 | −13.53 | −13.34 | - | - | - | - | - | - |
| V82A | −12.34 | −12.2 | −13.61 | −13.49 | −1.1 | 0.08 | −0.34 | 0.15 | 0.14 | 0.44 | |
| V82F | −13.94 | −13.05 | −13.63 | −13.63 | 0.5 | 0.1 | 0.51 | 0.29 | 1.97 | 1.45 | |
| I84V | −12.88 | −11.76 | −12.73 | −12.63 | −0.56 | −0.8 | −0.78 | −0.71 | 1.50 | 0.89 | |
| DMP323 | WT | −12.37 | −12.19 | −13.53 | −13.34 | - | - | - | - | - | - |
| V82A | −11.09 | −11.54 | −13.61 | −13.49 | −1.28 | 0.08 | −0.65 | 0.15 | 0.10 | 0.26 | |
| V82F | −12.72 | −12.74 | −13.63 | −13.63 | 0.35 | 0.1 | 0.55 | 0.29 | 1.53 | 1.55 | |
| I84V | −10.59 | −10.73 | −12.73 | −12.63 | −1.78 | −0.8 | −1.46 | −0.71 | 0.19 | 0.28 | |
| SD146 | WT | −13.63 | −13.23 | −13.53 | −13.34 | - | - | - | - | - | - |
| V82A | −13.53 | −13.38 | −13.61 | −13.49 | −0.1 | 0.08 | 0.15 | 0.15 | 0.74 | 1 | |
| V82F | −14.04 | −13.93 | −13.63 | −13.63 | 0.41 | 0.1 | 0.70 | 0.29 | 1.69 | 2 | |
| I84V | −13.07 | −13.09 | −12.73 | −12.63 | −0.56 | −0.8 | −0.14 | −0.71 | 1.50 | 2.62 | |
| XV638 | WT | −13.58 | −13.18 | −13.53 | −13.34 | - | - | - | − | - | - |
| V82A | −13.53 | −12.92 | −13.61 | −13.49 | −0.05 | 0.08 | −0.26 | 0.15 | 0.80 | 0.5 | |
| V82F | −13.94 | −13.65 | −13.63 | −13.63 | 0.36 | 0.1 | 0.47 | 0.29 | 1.55 | 1.36 | |
| I84V | −13.53 | −13.13 | −12.73 | −12.63 | −0.05 | −0.8 | −0.05 | −0.71 | 3.56 | 3.05 | |
All values in kcal/mol. and are the binding free energies of the inhibitor and substrate transition state, respectively (derived from the experimental Ki reported in Ref51). and are the calculated binding free energies of the inhibitor and the substrate transition state, respectively, calculated using our PDLD/S-LRA/β method.
Figure 6.
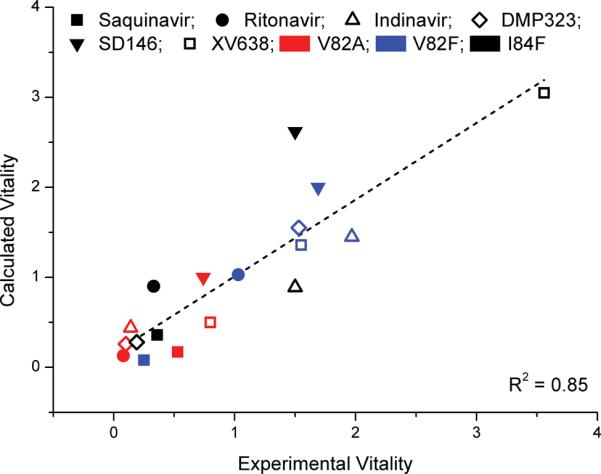
A graphical representation of the calculated and experimental vitality values for mutant of HIV proteases (see also Table III). For clarity purposes, the mutants studied here are color coded as follows: V82A (red), V82F (blue) and I84F (black).
Figure 7.
Calculated and experimental vitality values obtained with the PDLD/S-LRA/β method. The color in each element refers to the calculated energy in kcal/mol. Drug resistant mutants are expected when vitality value is greater than 1.
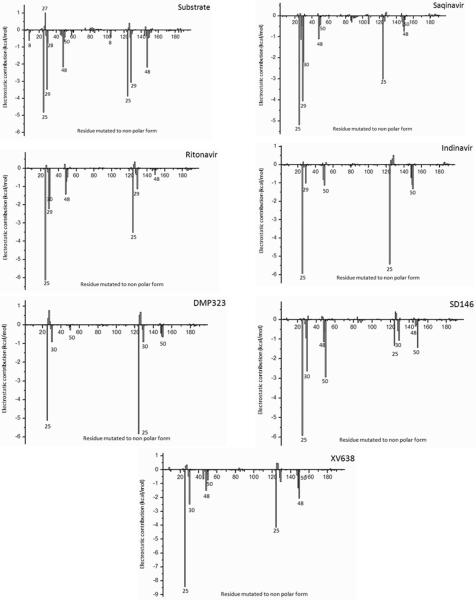
The PDLD/S approach for calculations of absolute binding free energies can also be useful in estimating the contributions of individual residues to the binding process. Figure 8 provides the group contributions of critical amino acid residues to the overall binding of the substrate as well as six experimental inhibitors and clinically approved drugs to the protease enzyme. A very useful definition of these group contributions is the effect of `mutating' the given residue to glycine, or alternatively of annihilating all the residual charges of the given residue (see section II.2). Although these definitions are not unique, they provide a `road map' for the location of `hot' residues whose mutations are likely to change the functional properties of the protein.57 This approach has been examined in several test cases (see Ref29, 30) and apparently provides reasonable results for an initial screening. It is particularly predictive when one is interested in the effect at ionized residue (for e.g., Ref58).
Figure 8.
Electrostatic contributions of the main chain and the side chains of HIV protease to ΔGbind for the substrate and the inhibitors.
The calculated group contributions for the system studies in this work are summarized in Figure 8. Overall we find that the residues predicted critical to substrate binding are well characterized, highly conserved residues. The trend obtained from Figure 8 is useful as a qualitative guide for assessing the key residues involved in the binding of different drugs. For example, the first inhibitor group includes transition state mimics, namely saquinavir, ritonavir and indinavir, all of which are FDA approved drugs for the treatment of AIDS. Amongst the peptidomimetics, indinavir binds most strongly to the protease inhibitors. The second group consists of compounds based on DMP323 that was generated on the basis of de novo concept and became the starting point for the design of second generation non-peptidic inhibitors, XV638 and SD146, developed to overcome the resistance to DMP323. As is obvious from Figure 8, these inhibitors bind more strongly to a key catalytic residue, D25 compared to DMP323. Particularly, XV638 shows strongest binding interactions to HIV protease. Unfortunately, neither of the aforementioned experimental compounds was pursued further due to solubility issues. Nevertheless, a clearer understanding of the strengths and failure of these compounds presents potential for new avenues of non-peptidic inhibitor design with improved thermodynamical and pharmaceutical properties. This may enhance our ability to continually design structurally diverse inhibitors effective against both wild type and predicted mutants and eventually may help reduce the rate of appearance of resistant variants. Clearly, our approach can be used to screen novel chemical entities against the mutant predicted by our vitality studies.
III.1 Performance Assessment
To assess the effectiveness of the reliable mutation screening, it is important to address information about the computational resources needed to obtained reliable results. The time required to perform the EVB calculations for two reaction steps for one system is 17 hours using one processor. Fortunately, the EVB calculations is only needed for defining the TS and this can be done only for the native enzyme as the rest of the calculations just involve evaluation of the TS binding energy. The rate determining part of the vitality calculation is the evaluation of the binding energies of the TS and the drug candidate. Performing such calculations using the PDLD/S-LRA/β approach allows us to study 11.8˙105 mutants in 24 hours using 1000 processors (for detailed information see Ref25). A faster mutation screening, we may use our coarse grained (CG) model59 for predicting protein-ligand binding with a reasonable reliability. The calculations can be streamline by initial evaluation of group contribution and focusing first on the mutants with the largest group contribution.
IV. CONCLUSIONS
This work examined our strategy for using computational predictions of vitality values as a new paradigm for fighting drug resistance. The essence of the computational strategy is the ability to predict the likely moves of the virus through constraints on both binding and catalysis. Such predictions should help in designing inhibitors capable of overcoming the effects of drug resistance mutations. Focusing on vitality prediction offers a major new addition to current approaches of fighting drug resistance, by using actual calculations of the binding energies of transition states and transition-state analogs in addition to the standard calculations of binding affinity of the inhibitor molecules. Such calculations can identify the subset of residues that are essential to catalysis as well as a formulation showing how these residues interact with different drugs.
The parameter and the approach used for decomposing the binding energies to individual contributions can potentially be used to assist the design of resistance-evading drugs for any target. The applicability of this method may be extended to analyze multiple mutations by assuming additively of the contribution of each mutant in future studies. Most significantly, the vitality values obtained in the present study reproduce the experimentally obtained values and corresponding drug resistance. The present work clearly shows the success of PDLD-S/LRA/β in single resistant mutation prediction, which suggests the potential of applying the protocol to predict multiple resistant mutations and/or to evaluate the potency of a large number of inhibitors during drug development, however not without limitations. The avalanche of accumulated data from actual experiments with diverse inhibitors and from resistant variants (identified during clinical exposure to drugs targeting protease enzyme) points toward an intricate pattern of resistance mutations which is not yet fully understood. Nevertheless, information resulting from such studies may contribute to a basic understanding of this phenomenon at a structural and thermodynamical level. Incorporation of this knowledge may add some value to either designing a new inhibitor de novo or modify an existing drug such that the virus cannot render the drug inactive by mutation without losing its efficiency.
Supplementary Material
ACKNOWLEDGEMENT
This work was supported by National Institutes of Health Grant R01 GM24492. We thank Dr. Hiroshi Ishikita for his help in the initial steps of this project. M. P. thanks Nikolay Plotnikov for stimulating discussion of the project and N.S. thanks Akshay Rao and Dr. Reena Isharani for reading the manuscript. We gratefully acknowledge the University of Southern California's High Performance Computing and Communication Center (HPCC) for computer time.
REFERENCES
- 1.Ishikita H, Warshel A. Predicting drug-resistant mutations of HIV protease. Angew Chem Int Ed Engl. 2008;47(4):697–700. doi: 10.1002/anie.200704178. [DOI] [PubMed] [Google Scholar]
- 2.Navia MA, Fitzgerald PM, McKeever BM, Leu CT, Heimbach JC, Herber WK, Sigal IS, Darke PL, Springer JP. Three-dimensional structure of aspartyl protease from human immunodeficiency virus HIV-1. Nature. 1989;337(6208):615–20. doi: 10.1038/337615a0. [DOI] [PubMed] [Google Scholar]
- 3.Wlodawer A, Miller M, Jaskolski M, Sathyanarayana BK, Baldwin E, Weber IT, Selk LM, Clawson L, Schneider J, Kent SB. Conserved folding in retroviral proteases: crystal structure of a synthetic HIV-1 protease. Science. 1989;245(4918):616–21. doi: 10.1126/science.2548279. [DOI] [PubMed] [Google Scholar]
- 4.Dunn BM. Structure and mechanism of the pepsin-like family of aspartic peptidases. Chem Rev. 2002;102(12):4431–58. doi: 10.1021/cr010167q. [DOI] [PubMed] [Google Scholar]
- 5.Debouck C, Gorniak JG, Strickler JE, Meek TD, Metcalf BW, Rosenberg M. Human immunodeficiency virus protease expressed in Escherichia coli exhibits autoprocessing and specific maturation of the gag precursor. Proc Natl Acad Sci U S A. 1987;84(24):8903–6. doi: 10.1073/pnas.84.24.8903. [DOI] [PMC free article] [PubMed] [Google Scholar]
- 6.Henderson LE, Benveniste RE, Sowder R, Copeland TD, Schultz AM, Oroszlan S. Molecular characterization of gag proteins from simian immunodeficiency virus (SIVMne) J Virol. 1988;62(8):2587–95. doi: 10.1128/jvi.62.8.2587-2595.1988. [DOI] [PMC free article] [PubMed] [Google Scholar]
- 7.Kohl NE, Emini EA, Schleif WA, Davis LJ, Heimbach JC, Dixon RA, Scolnick EM, Sigal IS. Active human immunodeficiency virus protease is required for viral infectivity. Proc Natl Acad Sci U S A. 1988;85(13):4686–90. doi: 10.1073/pnas.85.13.4686. [DOI] [PMC free article] [PubMed] [Google Scholar]
- 8.Peng C, Ho BK, Chang TW, Chang NT. Role of human immunodeficiency virus type 1-specific protease in core protein maturation and viral infectivity. J Virol. 1989;63(6):2550–6. doi: 10.1128/jvi.63.6.2550-2556.1989. [DOI] [PMC free article] [PubMed] [Google Scholar]
- 9.De Clercq E. Anti-HIV drugs: 25 compounds approved within 25 years after the discovery of HIV. Int J Antimicrob Agents. 2009;33(4):307–20. doi: 10.1016/j.ijantimicag.2008.10.010. [DOI] [PubMed] [Google Scholar]
- 10.Coffin JM. HIV population dynamics in vivo: implications for genetic variation, pathogenesis, and therapy. Science. 1995;267(5197):483–9. doi: 10.1126/science.7824947. [DOI] [PubMed] [Google Scholar]
- 11.Wang W, Kollman PA. Computational study of protein specificity: the molecular basis of HIV-1 protease drug resistance. Proc Natl Acad Sci U S A. 2001;98(26):14937–42. doi: 10.1073/pnas.251265598. [DOI] [PMC free article] [PubMed] [Google Scholar]
- 12.Zhang J, Hou T, Wang W, Liu JS. Detecting and understanding combinatorial mutation patterns responsible for HIV drug resistance. Proc Natl Acad Sci U S A. 107(4):1321–6. doi: 10.1073/pnas.0907304107. [DOI] [PMC free article] [PubMed] [Google Scholar]
- 13.Hou T, McLaughlin WA, Wang W. Evaluating the potency of HIV-1 protease drugs to combat resistance. Proteins. 2008;71(3):1163–74. doi: 10.1002/prot.21808. [DOI] [PMC free article] [PubMed] [Google Scholar]
- 14.Gulnik SV, Suvorov LI, Liu B, Yu B, Anderson B, Mitsuya H, Erickson JW. Kinetic Characterization and Cross-Resistance Patterns of HIV-1 Protease Mutants Selected under Drug Pressure. Biochem. 1995;34:9282. doi: 10.1021/bi00029a002. [DOI] [PubMed] [Google Scholar]
- 15.Bjelic S, Aqvist J. Computational prediction of structure, substrate binding mode, mechanism, and rate for a malaria protease with a novel type of active site. Biochemistry. 2004;43(46):14521–14528. doi: 10.1021/bi048252q. [DOI] [PubMed] [Google Scholar]
- 16.Carloni P, Rothlisberger U, Parrinello M. The role and perspective of ab initio molecular dynamics in the study of biological systems. Acc Chem Res. 2002;35(6):455–464. doi: 10.1021/ar010018u. [DOI] [PubMed] [Google Scholar]
- 17.Dunn BM. Structure and mechanism of the pepsin-like family of aspartic peptidases. Chem Rev. 2002;102(12):4431–4458. doi: 10.1021/cr010167q. [DOI] [PubMed] [Google Scholar]
- 18.Meek TD, Rodriguez EJ, Angeles TS. Use of steady state kinetic methods to elucidate the kinetic and chemical mechanisms of retroviral proteases. Methods Enzymol. 1994;241:127–56. doi: 10.1016/0076-6879(94)41063-1. [DOI] [PubMed] [Google Scholar]
- 19.Northrop DB. Follow the protons: a low-barrier hydrogen bond unifies the mechanisms of the aspartic proteases. Acc Chem Res. 2001;34(10):790–7. doi: 10.1021/ar000184m. [DOI] [PubMed] [Google Scholar]
- 20.Rodriguez EJ, Angeles TS, Meek TD. Use of nitrogen-15 kinetic isotope effects to elucidate details of the chemical mechanism of human immunodeficiency virus 1 protease. Biochemistry. 1993;32(46):12380–5. doi: 10.1021/bi00097a015. [DOI] [PubMed] [Google Scholar]
- 21.Suguna K, Padlan EA, Smith CW, Carlson WD, Davies DR. Binding of a reduced peptide inhibitor to the aspartic proteinase from Rhizopus chinensis: implications for a mechanism of action. Proc Natl Acad Sci U S A. 1987;84(20):7009–13. doi: 10.1073/pnas.84.20.7009. [DOI] [PMC free article] [PubMed] [Google Scholar]
- 22.Bjelic S, Aqvist J. Catalysis and linear free energy relationships in aspartic proteases. Biochemistry. 2006;45(25):7709–23. doi: 10.1021/bi060131y. [DOI] [PubMed] [Google Scholar]
- 23.Lee FS, Chu ZT, Warshel A. Microscopic and semimicroscopic calculations of electrostatic energies in proteins by the POLARIS and ENZYMIX programs. J. Comp. Chem. 1993;14:161–185. [Google Scholar]
- 24.Sham YY, Chu ZT, Tao H, Warshel A. Examining methods for calculations of binding free energies: LRA, LIE, PDLD-LRA, and PDLD/S-LRA calculations of ligands binding to an HIV protease. Proteins: Struct. Funct. Genet. 2000;39:393–407. [PubMed] [Google Scholar]
- 25.Singh N, Warshel A. Absolute binding free energy calculations: On the accuracy of computational scoring of protein-ligand interactions. Proteins. 2010;78(7):1705–23. doi: 10.1002/prot.22687. [DOI] [PMC free article] [PubMed] [Google Scholar]
- 26.Warshel A, Sharma PK, Kato M, Parson WW. Modeling electrostatic effects in proteins. Biochim. Biophys. Acta. 2006;1764(11):1647–1676. doi: 10.1016/j.bbapap.2006.08.007. [DOI] [PubMed] [Google Scholar]
- 27.Sham YY, Chu ZT, Warshel A. Consistent calculations of pKa's of ionizable residues in proteins: Semi-microscopic and microscopic approaches. J. Phys. Chem. B. 1997;101(22):4458–4472. [Google Scholar]
- 28.Lee FS, Chu ZT, Bolger MB, Warshel A. Calculations Of Antibody Antigen Interactions - Microscopic And Semimicroscopic Evaluation Of The Free-Energies Of Binding Of Phosphorylcholine Analogs To Mcpc603. Protein Engineering. 1992;5(3):215–228. doi: 10.1093/protein/5.3.215. [DOI] [PubMed] [Google Scholar]
- 29.Muegge I, Schweins T, Warshel A. Electrostatic Contributions to Protein-Protein Binding Affinities: Application to Rap/Raf Interaction. Proteins: Struct. Funct. Genet. 1998;30:407–423. doi: 10.1002/(sici)1097-0134(19980301)30:4<407::aid-prot8>3.0.co;2-f. [DOI] [PubMed] [Google Scholar]
- 30.Muegge I, Tao H, Warshel A. A fast estimate of electrostatic group contributions to the free energy of protein-inhibitor binding. Prot. Eng. 1997;10:1363–1372. doi: 10.1093/protein/10.12.1363. [DOI] [PubMed] [Google Scholar]
- 31.Srinivasan J, Cheatham TE, Cieplak P, Kollman PA, Case DA. Continuum solvent studies of the stability of DNA, RNA, and phosphoramidate - DNA helices. J. Am. Chem. Soc. 1998;120(37):9401–9409. [Google Scholar]
- 32.Pearlman DA. Evaluating the molecular mechanics Poisson- Boltzmann surface area free energy method using a congeneric series of ligands to p38 MAP kinase. J. Med. Chem. 2005;48:7796–7807. doi: 10.1021/jm050306m. [DOI] [PubMed] [Google Scholar]
- 33.Kuhn B, Gerber P, Schulz-gasch T, Stahl M. Validation and use of the MM-PBSA approach for drug discovery. J. Med. Chem. 2005;48:4040–4048. doi: 10.1021/jm049081q. [DOI] [PubMed] [Google Scholar]
- 34.King G, Warshel A. A surface constrained all-atom solvent model for effective simulations of polar solutions. J. Chem. Phys. 1989;91(6):3647–3661. [Google Scholar]
- 35.Lee FS, Warshel A. A local reaction field method for fast evaluation of long-range electrostatic interactions in molecular simulations. J. Chem. Phys. 1992;97:3100–3107. [Google Scholar]
- 36.Chu ZT, Villa J, Strajbl M, Schutz CN, Shurki A, Warshel A. MOLARIS. version 9.06 Los Angeles; University of Southern Calcifornia: 2006. [Google Scholar]
- 37.Berman HM, Westbrook J, Feng Z, Gilliland G, Bhat TN, Weissig H, Shindyalov IN, Bourne PE. The Protein Data Bank. Nucleic Acids Res. 2000;28(1):235–42. doi: 10.1093/nar/28.1.235. [DOI] [PMC free article] [PubMed] [Google Scholar]
- 38.Lam PY, Ru Y, Jadhav PK, Aldrich PE, DeLucca GV, Eyermann CJ, Chang CH, Emmett G, Holler ER, Daneker WF, Li L, Confalone PN, McHugh RJ, Han Q, Li R, Markwalder JA, Seitz SP, Sharpe TR, Bacheler LT, Rayner MM, Klabe RM, Shum L, Winslow DL, Kornhauser DM, Hodge CN, et al. Cyclic HIV protease inhibitors: synthesis, conformational analysis, P2/P2' structure-activity relationship, and molecular recognition of cyclic ureas. J Med Chem. 1996;39(18):3514–25. doi: 10.1021/jm9602571. [DOI] [PubMed] [Google Scholar]
- 39.Chen Z, Li Y, Chen E, Hall DL, Darke PL, Culberson C, Shafer JA, Kuo LC. Crystal structure at 1.9-A resolution of human immunodeficiency virus (HIV) II protease complexed with L-735,524, an orally bioavailable inhibitor of the HIV proteases. J Biol Chem. 1994;269(42):26344–8. [PubMed] [Google Scholar]
- 40.Kempf DJ, Marsh KC, Denissen JF, McDonald E, Vasavanonda S, Flentge CA, Green BE, Fino L, Park CH, Kong XP, et al. ABT-538 is a potent inhibitor of human immunodeficiency virus protease and has high oral bioavailability in humans. Proc Natl Acad Sci U S A. 1995;92(7):2484–8. doi: 10.1073/pnas.92.7.2484. [DOI] [PMC free article] [PubMed] [Google Scholar]
- 41.Liu F, Kovalevsky AY, Tie Y, Ghosh AK, Harrison RW, Weber IT. Effect of flap mutations on structure of HIV-1 protease and inhibition by saquinavir and darunavir. J Mol Biol. 2008;381(1):102–15. doi: 10.1016/j.jmb.2008.05.062. [DOI] [PMC free article] [PubMed] [Google Scholar]
- 42.Jadhav PK, Ala P, Woerner FJ, Chang CH, Garber SS, Anton ED, Bacheler LT. Cyclic urea amides: HIV-1 protease inhibitors with low nanomolar potency against both wild type and protease inhibitor resistant mutants of HIV. J Med Chem. 1997;40(2):181–91. doi: 10.1021/jm960586t. [DOI] [PubMed] [Google Scholar]
- 43.Frisch MJ, Trucks GW, Schlegel HB, Scuseria GE, Robb MA, Cheeseman JR, Montgomery JA, Vreven JT, Kudin KN, Burant JC, Millam JM, Iyengar SS, Tomasi J, Barone V, Cossi BM,M, Scalmani G, Rega N, Petersson GA, Hada HN,M, Ehara M, Toyota K, Fukuda R, Ishida JH,M, Nakajima T, Honda Y, Kitao O, Nakai H, Li MK,X, Knox JE, Hratchian HP, Cross JB, Adamo C, Gomperts JJ,R, Stratmann RE, Yazyev O, Austin AJ, Pomelli RC,C, Ochterski JW, Ayala PY, Morokuma K, Salvador GAV,P, Dannenberg JJ, Zakrzewski VG, Daniels SD,AD, Strain MC, Farkas O, Rabuck DKM,AD, Raghavachari K, Foresman JB, Cui JVO,Q, Baboul AG, Clifford S, Cioslowski J, Liu BBS,G, Liashenko A, Piskorz P, Komaromi I, Fox RLM,DJ, Keith T, Al-Laham MA, Peng CY, Challacombe AN,M, Gill PMW, Johnson B, Wong WC,MW, Gonzalez C, Pople JA. Gaussian 03, Revision C.03. 2004 [Google Scholar]
- 44.Warshel A. Computer Modeling of Chemical Reactions in Enzymes and Solutions. John Wiley & Sons; New York: 1991. [Google Scholar]
- 45.Kamerlin SC, Warshel A. The empirical valence bond model: theory and applications. Wiley Interdisciplinary Reviews: Computational Molecular Science. 2011;1:30–45. [Google Scholar]
- 46.Aqvist J, Warshel A. Simulation of Enzyme Reactions Using Valence Bond Force Fields and Other Hybrid Quantum/Classical Approaches. Chem. Rev. 1993;93:2523–2544. [Google Scholar]
- 47.Frushicheva MP, Cao J, Chu ZT, Warshel A. Exploring challenges in rational enzyme design by simulating the catalysis in artificial kemp eliminase. Proc Natl Acad Sci U S A. 2010;107(39):16869–74. doi: 10.1073/pnas.1010381107. [DOI] [PMC free article] [PubMed] [Google Scholar]
- 48.Frushicheva MP, Cao J, Warshel A. Challenges and advances in validating enzyme design proposals: the case of kemp eliminase catalysis. Biochemistry. 2011;50(18):3849–58. doi: 10.1021/bi200063a. [DOI] [PMC free article] [PubMed] [Google Scholar]
- 49.Roca M, Vardi-Kilshtain A, Warshel A. Toward accurate screening in computer-aided enzyme design. Biochemistry. 2009;48(14):3046–3056. doi: 10.1021/bi802191b. [DOI] [PMC free article] [PubMed] [Google Scholar]
- 50.Altman MD, Nalivaika EA, Prabu-Jeyabalan M, Schiffer CA, Tidor B. Computational design and experimental study of tighter binding peptides to an inactivated mutant of HIV-1 protease. Proteins. 2008;70(3):678–94. doi: 10.1002/prot.21514. [DOI] [PMC free article] [PubMed] [Google Scholar]
- 51.Klabe RM, Bacheler LT, Ala PJ, Erickson-Viitanen S, Meek JL. Resistance to HIV protease inhibitors: a comparison of enzyme inhibition and antiviral potency. Biochemistry. 1998;37(24):8735–42. doi: 10.1021/bi972555l. [DOI] [PubMed] [Google Scholar]
- 52.Deraniyagala SA, Adediran SA, Pratt RF. Beta secondary and solvent deuterium kinetic isotope effects and the mechanisms of base-catalyzed and acid-catalyzed hydrolysis of penicillanic acid. J Org Chem. 1995;60:1619–1625. [Google Scholar]
- 53.Johnson SL, Morrison DL. Kinetics and mechanism of decarboxylation of N-arylcarbamates. Evidence for kinetically important zwitterionic carbamic acid species of short lifetime. J Am Chem Soc. 1972;94(4):1323–34. doi: 10.1021/ja00759a045. [DOI] [PubMed] [Google Scholar]
- 54.Slebocka-Tilk H, Neverov AA, Brown RS. Proton inventory study of the base-catalyzed hydrolysis of formamide. Consideration of the nucleophilic and general base mechanisms. J Am Chem Soc. 2003;125(7):1851–8. doi: 10.1021/ja021055z. [DOI] [PubMed] [Google Scholar]
- 55.Pazhanisamy S, Stuver CM, Cullinan AB, Margolin N, Rao BG, Livingston DJ. Kinetic characterization of human immunodeficiency virus type-1 protease-resistant variants. J Biol Chem. 1996;271(30):17979–85. doi: 10.1074/jbc.271.30.17979. [DOI] [PubMed] [Google Scholar]
- 56.Wilson SI, Phylip LH, Mills JS, Gulnik SV, Erickson JW, Dunn BM, Kay J. Escape mutants of HIV-1 proteinase: enzymic efficiency and susceptibility to inhibition. Biochim Biophys Acta. 1997;1339(1):113–25. doi: 10.1016/s0167-4838(96)00224-5. [DOI] [PubMed] [Google Scholar]
- 57.Muegge I, Schweins T, Langen R, Warshel A. Electrostatic Control of GTP and GDP Binding in the Oncoprotein p21 ras. Structure. 1996;4:475–489. doi: 10.1016/s0969-2126(96)00052-4. [DOI] [PubMed] [Google Scholar]
- 58.Xiang Y, Oelschlaeger P, Florian J, Goodman MF, Warshel A. Simulating the effect of DNA polymerase mutations on transition-state energetics and fidelity: Evaluating amino acid group contribution and allosteric coupling for ionized residues in human pol b. Biochemistry. 2006;45(23):7036–7048. doi: 10.1021/bi060147o. [DOI] [PubMed] [Google Scholar]
- 59.Messer BM, Roca M, Chu ZT, Vicatos S, Kilshtain AV, Warshel A. Multiscale simulations of protein landscapes: using coarse-grained models as reference potentials to full explicit models. Proteins. 78(5):1212–27. doi: 10.1002/prot.22640. [DOI] [PMC free article] [PubMed] [Google Scholar]
Associated Data
This section collects any data citations, data availability statements, or supplementary materials included in this article.


