Abstract
Although diffusion tensor imaging (DTI) has provided substantial insights into early brain development, most DTI studies based on fractional anisotropy (FA) and mean diffusivity (MD) may not capitalize on the information derived from the three principal diffusivities (e.g. eigenvalues). In this study, we explored the spatial and temporal evolution of white matter structures during early brain development using two geometrical diffusion measures, namely, linear (Cl) and planar (Cp) diffusion anisotropies, from 71 longitudinal datasets acquired from 29 healthy, full-term pediatric subjects. The growth trajectories were estimated with generalized estimating equations (GEE) using linear fitting with logarithm of age (days). The presence of the white matter structures in Cl and Cp was observed in neonates, suggesting that both the cylindrical and fanning or crossing structures in various white matter regions may already have been formed at birth. Moreover, we found that both Cl and Cp evolved in a temporally nonlinear and spatially inhomogeneous manner. The growth velocities of Cl in central white matter were significantly higher when compared to peripheral, or more laterally located, white matter: central growth velocity Cl = 0.0465±0.0273/log(days), versus peripheral growth velocity Cl=0.0198±0.0127/log(days), p<10−6. In contrast, the growth velocities of Cp in central white matter were significantly lower than that in peripheral white matter: central growth velocity Cp= 0.0014±0.0058/log(days), versus peripheral growth velocity Cp = 0.0289±0.0101/log(days), p<10−6. Depending on the underlying white matter site which is analyzed, our findings suggest that ongoing physiologic and microstructural changes in the developing brain may exert different effects on the temporal evolution of these two geometrical diffusion measures. Thus, future studies utilizing DTI with correlative histological analysis in the study of early brain development are warranted.
Keywords: early brain development, DTI, longitudinal analysis, GEE, geometrical diffusion measures, brain growth
Introduction
Quantitative analysis of brain growth in the early postnatal period provides a critical tool in the understanding of normal brain development. In addition, the creation of a voxel-based, rather than ROI-based, digital atlas for the spatiotemporal maturation patterns of human brain affords valuable information in the identification of normal brain developmental features as well as abnormal brain developmental patterns in pediatric patients. Diffusion tensor imaging (DTI) (Basser and Pierpaoli, 1996; Le Bihan et al., 1986) enables a quantitative, non-invasive examination of brain maturation processes utilizing a set of water diffusion related parameters, including fractional anistropy (FA), mean (MD), axial (AD), and radial (RD) diffusivities. FA is a reflection of water diffusion anisotropy due to the differences among diffusitivities along the three principal directions. As a result of the presence of orderly arranged myelin sheaths within white matter fiber tracts, FA values are usually higher in white matter structures when compared to sourounding brain regions. MD is an averaged measure of local water diffusivty. In addition, AD and RD may permit the discrimination between the water diffusivities parallel and perpendicular to the long axis of white matter fiber tracts, with implications for axonal and myelin integrity, respectively, as previously suggested by Song et al (Song et al., 2003).
Over the past decade, substantial insights towards brain development from prenatal to adolescent stages has been gained with DTI (Cascio et al., 2007; Hüppi, 2006; Mukherjee and McKinstry, 2006; Neil, 2002). Mckinstry et al and Gupta et al have imaged the developing human fetal cortex, showing radially oriented major eigenvectors in the cortical plate and subplate (Gupta et al., 2005; McKinstry et al., 2002). In this study, the temporal changes in FA demonstrated an initial increase up to 27 weeks gestational age (GA), peaking at 26–28 weeks GA, followed by a gradual decrease in FA through 36 weeks GA. In early postnatal brain development, increased FA and decreased MD were observed within white matter with advancing age. Neonates demonstrated significantly lower anistropy values and significantly higher MD when compared with adults (Neil et al., 1998; Zhai et al., 2003). Zhai et al further demonstrated that neonates had consistently higher FA and lower MD values in the central white matter areas when compared to the peripheral white matter regions. Furthermore, this central-peripheral variation became smaller in adults when compared to neonates (Zhai et al., 2003). In preterm newborns, from 28 to 43 GA weeks, Berman and collegues found significant correlation between all tract-specific DTI parameters and age (Berman et al., 2005). Notably, motor tracts had higher FA and lower MD values than sensory pathways (Berman et al., 2005). In addition, Dubios et al performed correlation studies between ROI-based DTI parameters and age (Dubois et al., 2006). By examinging 7 pediatric volunteers and 23 pediatric patients (age range: 0~54 months), Hermoye and collegues observed three phases of FA and MD changes in the early postnatal period, consisting of a rapid change within the first 12 months, a slow maturation from 12 to 24 months, and a steady state following 24 months (Hermoye et al., 2006). In a study by Huang et al with human fetal, newborn and pediatric brains, the white matter developmental pattern was identified as limbic fiber tract developement preceeding association fiber tracts, and commisural and projection fiber tracts forming from anterior to posterior regions of the brain (Huang et al., 2006). More recently, Gao et al also demonstrated a significant elevation in FA and a signficant reduction in MD, AD and RD in a cross-sectional study consisting of three age groups, neonates, 1-year-olds and 2-year-olds (Gao et al., 2008).
Statistical regression analysis has been applied to quantify the growth trajectories of DTI parameters in early brain development. With selective ROIs, it has been demonstrated that the changes in DTI, including the principal diffusivities represented via the three eigenvalues, follow a non-linear pattern as shown in the studies by Mukhejee et al (Mukherjee et al., 2001; Mukherjee et al., 2002) and Schneider et al (Schneider et al., 2004). Later, in subjects 5 to 30 years of age, the non-linear developmental pattern was detected in a tractography based developmental study (Lebel et al., 2008). In a more recent study by Faria et al, a statistical atlas based linear fitting was performed in the voxel level between FA and MD with the logarithm of age. Investigators found that after two years of life, FA still increases and diffusivities still decrease linearly with the logarithm of age (Faria, 2010).
Current DTI based early brain developmental studies do not exploit information readily available through the three principal diffusivities (e.g. eigenvalues). Most of the FA or MD based work falls short in revealing specific microstructural changes of white matter during early brain development, since the composite DTI indices like FA or MD can not distinguish between different effects exerted by the myelination process on the three eigenvalues. To address this limitation, the hypothesis that AD and RD may reflect water diffusivities parallel and perpedicular to, respectively, the principle fiber direction (Song et al., 2003), has been applied to early brain development. Gao et al. have found that only RD but not AD showed significant changes from 1 to 2 years of age (Gao et al., 2008). Physiologic and microstructural alterations which may serve as the underpinnings of DTI parameters during early brain development are numerous, and include expansion and growth of the axon cylinders, axonal membrane permeability fluxes, the cellular proliferation of “myelinating glia”, and thickness and compaction of the myelin sheath (Wimberger et al., 1995)
This AD/RD hypothesis originated in a dysmyelination mouse model (Song et al., 2003) and assumed a cylindrical shape of white matter fiber bundles. It has been suggested that central white matter contains relatively compact cylinidrical structures, while peripheral white matter has more structurally complex fiber systems, including fiber crossings and fannings (Wiegell, 2000). Previous studies demonstrated that the geometrical diffusion parameters such as linear anistropy Cl (the trace normalized difference between the primary and second eigenvalues) and planar anisotropy Cp (the traced normalized difference between the secondary and tertertiary eigenvalues) can be utilized to more accurately model different white matter microstructures (Wiegell, 2000; Zhang, 2006). To date, the geometrical aspects of white matter maturation has not yet been explored in early brain development. Given the changing microstructural landscape within developing white matter, we hypothesized that the temporal evolution of linear (Cl) and planar (Cp) anistropies may show different characteristics between central and peripheral white matter regions.
In this study, we recruited only healthy, full term infants. Imaging was performed without the use of sedation, in order to control for confounding variables, such as drug effects, and to simulate as closely as possible, natural conditions in order to serve as a representative window into normal brain development1. We followed a longitudinal experimental design to minimize the bias which accrues from sporadic across-subject time-invariant factors, and accordingly, we adopted generalized estimate equations (GEE) based longitudinal regression in combination with model selection for soundness in statistical analysis. The spatial and temporal growth patterns of these two geometrical diffusion measures, Cl and Cp, were evaluated on a voxel basis. Furthermore, the growth velocites of Cl and Cp between some central and peripheral white matter regions were compared to address the proposed hypothesis.
Materials and Methods
Subjects
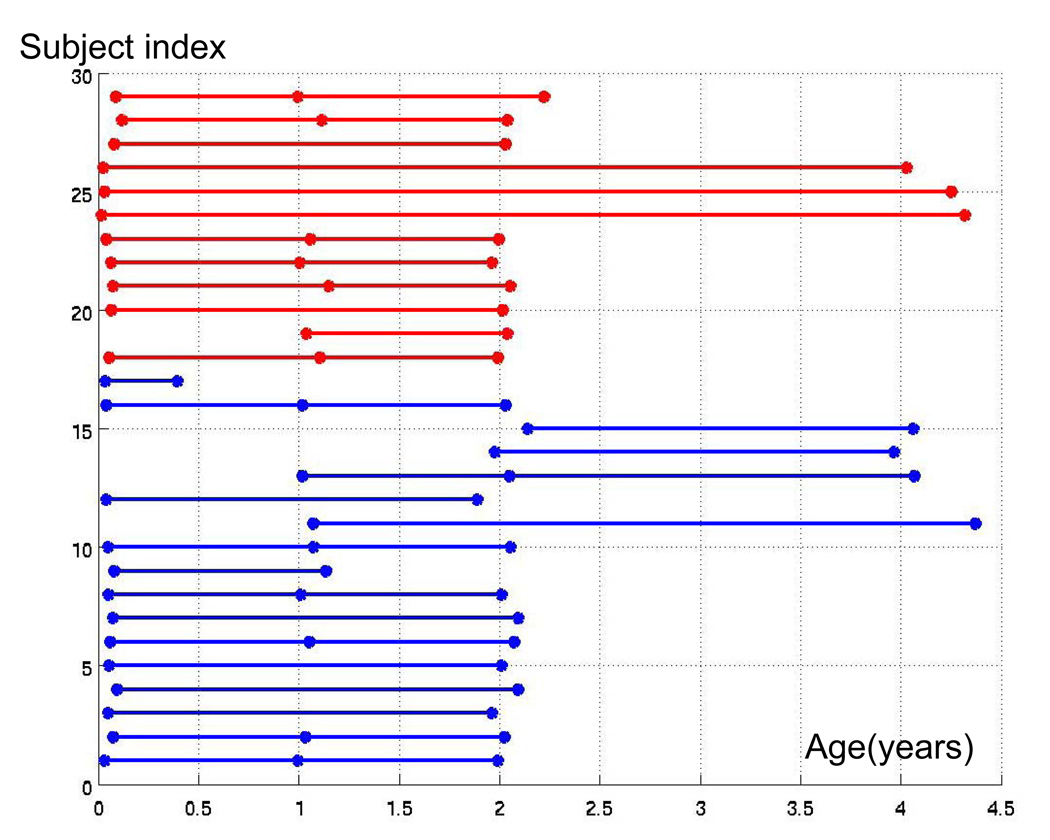
Our study was approved by the institutional review board. A total of 29 healthy full-term subjects (17M and 12F) during the first four years of age were recruited and written informed constents were obtained from their parents before image acquisition. The subjects were drawn from a larger study at our institution focused on the investigation of early brain development. A total of 71 datasets with 25 neonates (age 0.07±0.07 years, 14M and 11F), 16 1-year-olds (age 1.05±0.05 years, 9M and 7F), 23 2-year-olds (age 2.03±0.07 years, 14M and 9F), and 7 4-year-olds (age 4.15±0.16 years, 4M and 3F) were included in this study. Each subject was scanned at least twice (Fig. 1). None of the subjects was sedated during the imaging session. Instead, efforts were made to ensure the subjects sleep comfortably inside the MR scanner. All subjects were fed and calmed to sleep on a warm blanket with proper ear protection.
Fig. 1.
The gender (blue for male and red for female) and age (x-axis in years) distributions for the pediatric 29 subjects included the study with x-axis representing the age of one subject at image acquisition and y-axis indicating an arbitrary subject index.
Image acquisition and data preprocessing
All images were acquired on a 3T Allegra head only MR system (Siemens Medical Inc., Erlangen, Germany) with a maximal gradient strength of 40 mT/m and a maximal slew rate of 400 mT/(m·msec). A single shot double refocused EPI DTI sequence (TR/TE=5400/73 msec) with eddy current compensation was used to acquire DTI images. Diffusion gradients with a b-value of 1000 s/mm2 were applied in six non-collinear directions. The reference scan (b=0) was also acquired for the construction of diffusion tensor matrices. Continguous slices with a thickness of 2mm with no interslice gap were used to cover the whole brain. The voxel resolution was 2mm isotropically, and the in-plane field of view was 256mm in both directions. A total of ten scans were acquired and averaged to improve the signal-to-noise ratio of the DTI images. Three eigenvalues of DTI and FA were computed using the diffusion tensor tool box in FSL (http://www.fmrib.ox.ac.uk/fsl/) following the recommended DTI image processing procedures including correction of distortion and head motion using affine registration (Smith et al., 2007).
Geometrical diffusion measures
In this study, we focused on two geometrical diffusion measures Cl and Cp, derived from the three eigenvalues, which are considered as the decomposition of a diffusion tensor matrix into linear and planar components2 (Eq. [1]). In other words, these normalized quantities respectively represent the percentages of the shape of a diffusion tensor matrix attributable to a cylindrical or a planar object (Zhang, 2006).
| [1] |
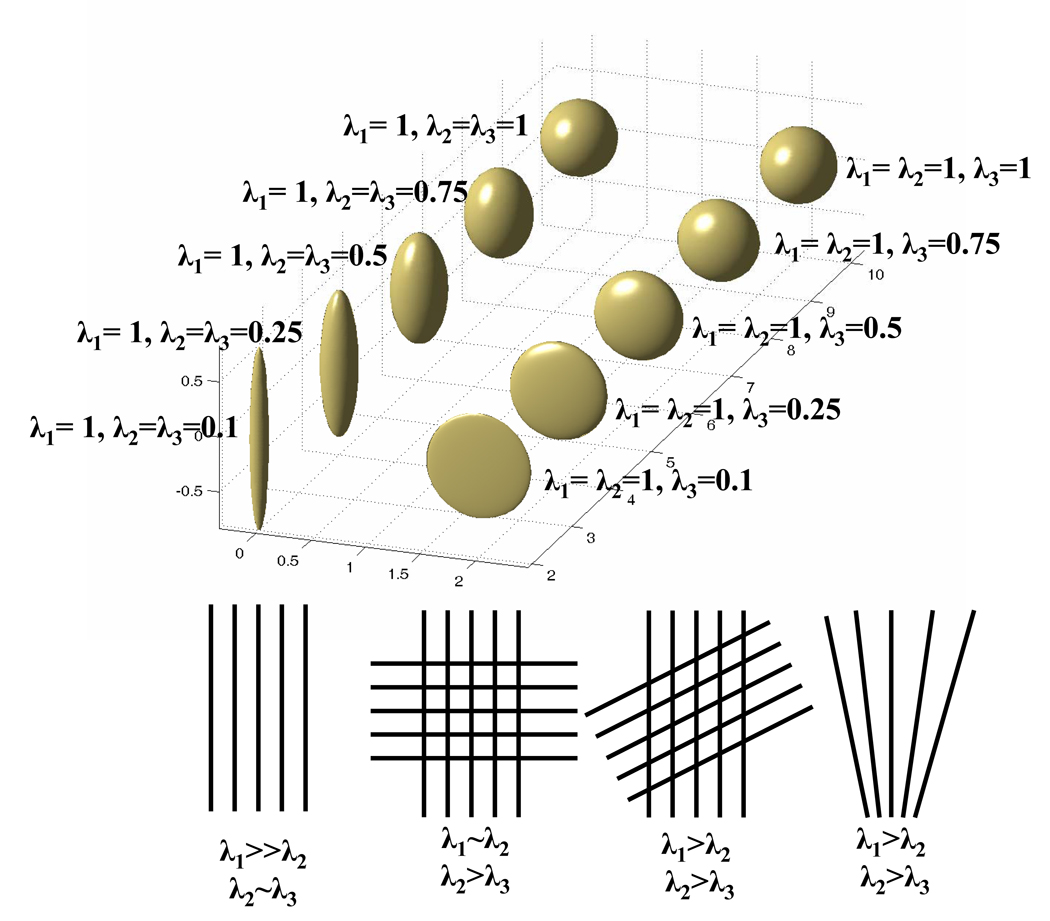
λ1, λ2 and λ3 are the three eigenvalues of a diffusion tensor matrix in descending order. An illustration of how the shape of a diffusion tensor matrix changes when Cl and Cp decrease is given in Fig. 2 (top panel). According to Cl and Cp, Wiegell et al categorized human white matter as uniaxial and planar models depending upon whether λ2 and λ3 assume similar values, and an illustration is also given in Fig. 2 (bottom panel). It is worth noting that when the white matter fibers of similar diffusion properties run perpendicular to each other, the largest two eigenvalues may be very similar (bottom panel, Fig. 2). It may also be difficult to differentiate the angled fiber crossing from fiber fanning, since these two situations may render similar eigenvalue configurations (bottom panel, Fig. 2)
Fig. 2.
An illustration of how the shape of a diffusion tensor matrix changes with a decreasing (from anterior to posterior) Cl (left top panel) and Cp (right top panel,) and the potential underlying fiber configurations leading to strong Cl (1st figure, bottom panel, λ1 >> λ2 ~ λ3) and Cp (2nd to the last figures, bottom panel) components. High Cp may include the fiber crossing with two groups of fibers running perpendicular to each other (2nd figure, bottom panel, λ1 ~ λ2 > λ3), or angled crossing (3rd figure, bottom panel, λ1 > λ2 > λ3), and fanning (the last figure, bottom panel, λ1 > λ2 > λ3).
For voxel-based analysis, the FA images from all subjects were co-registered with a template FA image from a 2-year-old subject (not included in this study) using derived geometrical features from the distribution of FA instead of merely the FA magnitude. (Shen, 2007; Shen and Davatzikos, 2002).
GEE method for longitudinal analysis
The GEE method was developed to analyze repeated measurements under weak parametric assumptions (Liang and Zeger, 1986). We also assumed that yi,j, which is a particular DTI parameter acquired at age ti,j (such as FA of the i-th subject at a time point j of a voxel), followed a polynomial model of order m as
| [2] |
The estimation of β⃗ is the solution to GEE (Eq. [2]) as given in Eq. [3].
| [3] |
where u⃗i = (ui,1, ui,2,…ui,ti)′, Yi = (yi,1, yi,2,…yi,ti)′ and Vi is the covariance matrix of Yi. (Diggle et al., 2002; Liang and Zeger, 1986). Since the repeated measurements (yi,1, yi,2,…yi,ti)T from the same subject are positively correlated, Vi can be decomposed as , where ϕ is a scale parameter, and Ri (a) is the working correlation matrix representing the correlation among the repeated measurements. In this study, auto regressive structure as in Eq. [4], which assumes a weaker correlation between the pair of measurement with a longer time interval, is used for modeling. The details of mathematical calculation can be found in (Diggle et al., 2002; Liang and Zeger, 1986).
| [4] |
Akaike’s information criterion (AIC) is a well accepted statistical measure of the goodness of fit (Akaike, 1974). For several competing models fitting the same given data, the model with the lowest AIC value is selected for a balance between the accuracy of fitting and the complexity of the model.
In the published literatures, linear fitting with logarithm of age (as in Eq. [5]) has been widely used in early brain development studies (Faria AV, 2010; Löbel U, 2009). We have compared this linear logarithm fitting against linear (m=1 in Eq. [2]), quadratic (m=2 in Eq. [2]), cubic (m=3 in Eq. [2]), quartic (m=4 in Eq. [2]), and quintic (m=5 in Eq. [2]) polynomial based fittings individually with AIC to determine whether linear logarithm fitting performs better than all these polynomial models.
| [5] |
Hypotheis testing and adjustment for multiple comparisons
More details regarding the testing procedures can be found in (Zhu et al., 2008). The null hypothesis was in the format of H0 : Rβ = b0, where R is an r×k matrix (of rank r), and b0 is an r×1 vector, and r represents the number of linear hypothesis to be tested and k is the number of covariates in the model. The vector b0 represents the hypothesized values for each linear summation formed by Rβ. If the null hypothesis is rejected with a small probability (e.g. p<0.05), the term tested has a significant effect. In order to adjust multiple comparisons, false discovery rate (FDR) was controled with a threshold value of 0.05 using the FDR tool provided in FSL software package (Nichols, 2003).
Growth trajectories from selected ROIs
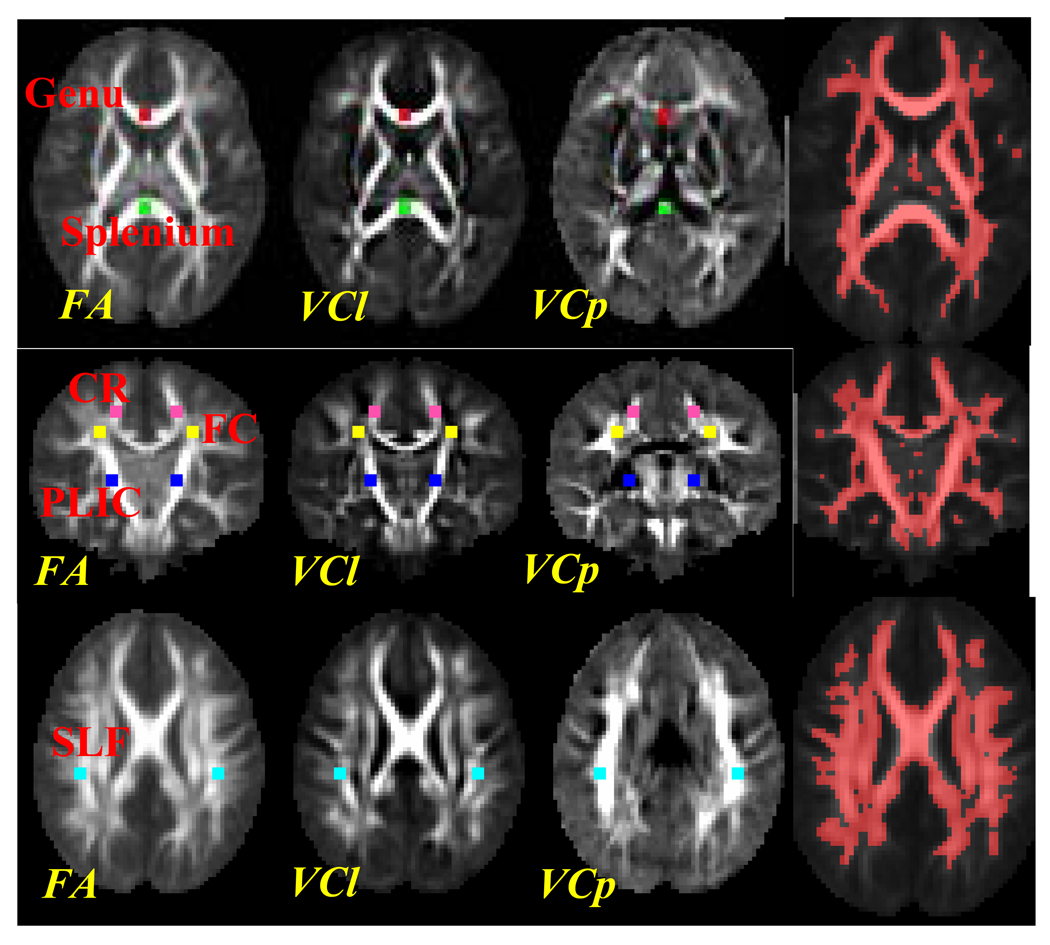
In order to demonstrate how white matter architectures may affect the growths of Cl and Cp, we evaluated the growth trajectories from several major central and peripheral white matter regions. In order to constrain the analysis within white matter, a white matter mask was generated by the the joint segmentation from the mean MD and FA images of the 7 4-year-olds in the study (Liu et al., 2007). The locations of the ROIs and the white matter mask were drawn on the mean FA images of the 4-year-old subjects (Fig. 6). Central white matter includes the genu, splenium and posterior limb of the internal capsule (PLIC) (Genu, Splenium and PLIC ROIs in Fig. 6), and are referred to as compact white matter (Provenzale JM, 2007). Peripheral white matter includes a well documented fiber crossing (FC) area between corpus callosum and corona radiata (FC in Fig. 6) (Wiegell, 2000; Zhang, 2006), a white matter region in the anterior corona radiata (CR) close to the fiber crossing region (CR in Fig. 6), and the superior longitudinal fasciculus (SLF) as fiber fanning white matter regions (SLF in Fig. 6) (Wiegell, 2000; Zhang, 2006). The ROIs for genu, splenium and SLF were chosen in the axial slices due to the presence of the largest profile of these white matter structures based on visual inspection. The ROIs for FC, CR and PLIC were chosen in one coronal slice with the largest profile of PLIC. All these ROIs were squares with a size of 3*3 voxels.
Fig. 6.
The locations of ROIs in genu (red), splenium (green), PLIC (blue), a fiber crossing area between corona radiata and genu (FC in yellow), anterior corona radiata (CR in mangneta) and superior longitudinal fasciculus (SLF in cyan) and the white matter mask from the segmentation of the mean FA and MD images from all the 4-year-olds. The size of the ROIs was 3×3 voxels. The white matter masks from the corresponding slices were drawn on top of the mean FA images from the 4-year-olds (last column).
In order to evaluate the effect of the ROIs’ location and size upon our findings, we have generated series of ROIs with different centers and sizes based upon the ROI regions as shown in Fig. 6. For instance, in Genu, the squared ROI with three different sizes (3*3, 5*5 and 7*7 voxels) were centered at each voxels within the original Genu ROI shown in Fig. 6. All these ROIs were constrained within white matter regions using a white matter mask (Fig. 6). In Genu, a total of 9*3 ROIs were obtained for their mean and standard deviations. Similarly, for regions represented by two ROIs (such as FC, CR, SLF), a total of 9*9*3 ROIs were employed.
Results
In this section, we will first demonstrate the mean Cl and Cp images from different age groups, followed by the growth velocity maps of Cl and Cp, and finally, evolution of Cl and Cp in representative white matter regions. These regions were selected to demonstrate the potential impact of white matter architectures on the temporal growth of these two geometrical diffusion measures (Provenzale JM, 2007; Wiegell, 2000; Zhang, 2006).
Mean images of geometrical diffusion measures from different age groups
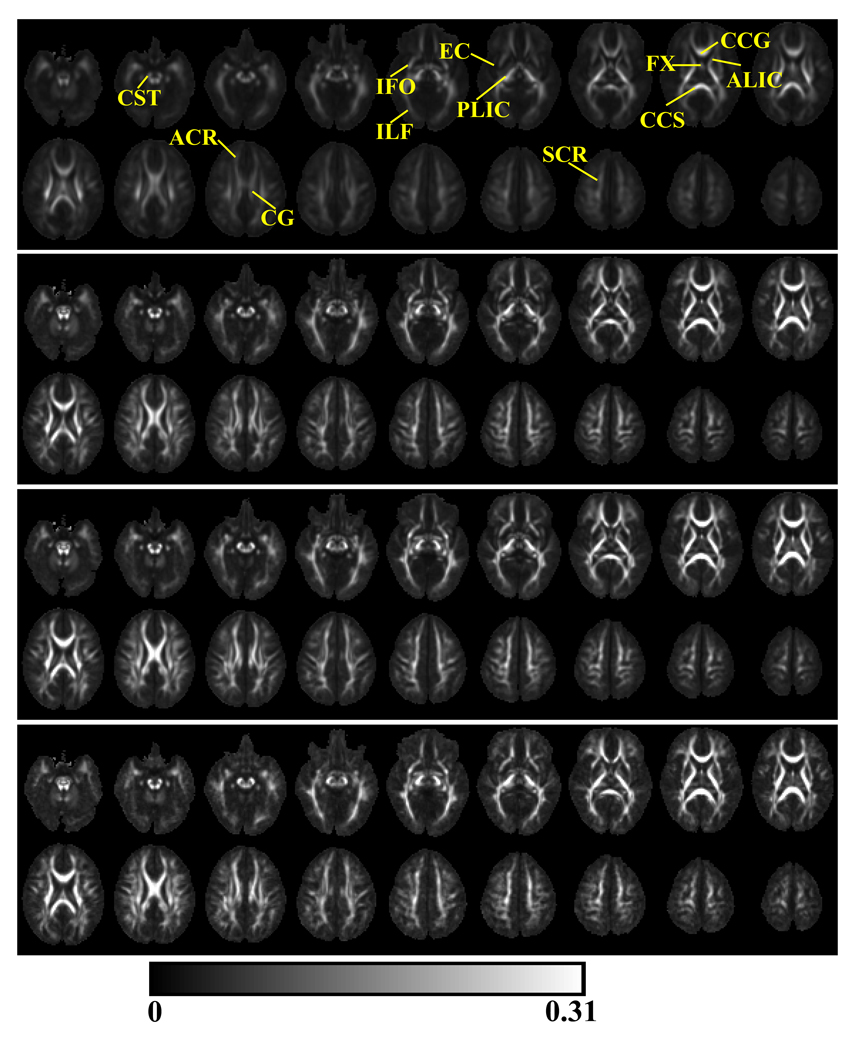
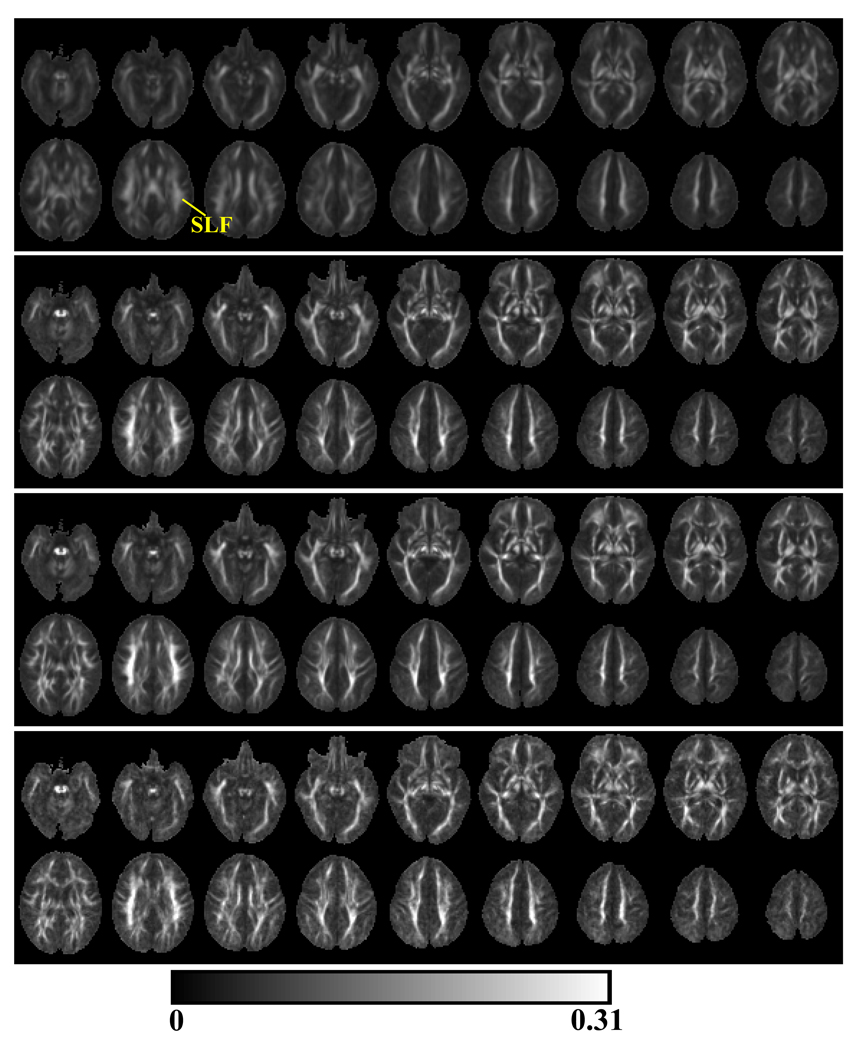
Within the mean Cl (top panel, Fig 3) and Cp (top panel, Fig 4) images from the neonates, major white matter regions were clearly indentifiable and these white matter structures included the cingulum (CG), corticospinal tract (CST), inferior longitudinal fasciculus (ILF), anterior and posterior limbs of internal capsule (ALIC and PLIC), external capsule (EC), genu (CCG), splenium (CCS) and body of corpus callosum, fornix (FX), inferior fronto-occipital fasciculous (IFO), anterior (ACR) and superior (SCR) corona radiata and superior longitudinal fasciculus (SLF). The identification of these white matter structures followed a previous atlas of the white matter tracts (Wakana et al., 2004).
Fig. 3.
The mean Cl images from neonates (top panel), 1-year-olds (2nd panel), 2-year-olds (3rd panel) and 4-year-olds (bottom panel). In neonates, the indentifiable white matter structures included cingulum (CG), corticospinal tract (CST), inferior longitudinal fasciculus (ILF), anterior and posterior limbs of internal capsule (ALIC and PLIC), external capsule (EC), genu (CCG), splenium (CCS) and body of corpus callosum, fornix (FX), inferior fronto-occipital fasciculous (IFO), anterior (ACR) and superior (SCR) corona radiata.
Fig. 4.
The mean Cp images from neonates (top panel), 1-year-olds (2nd panel), 2-year-olds (3rd panel) and 4-year-olds (bottom panel). Superior longitudinal fasciculus (SLF) was readily identifiable in the mean Cp images from neonates.
From the mean Cl and Cp as given Fig. 3 and 4, it was apparent that major central white matter regions, especially corpus callosum and PLIC could be readily indentified even in the neonates (Fig. 3), while substantial contrast based on Cp could only be clearly observed in peripheral white matter regions. Corpus callosum and PLIC had high Cl, but low Cp values. This observation suggested that even the basic white matter architectures have been already established at birth, white matter regions of high Cl do not overlap with regions of high Cp. Thus our results demonstrated that Cl and Cp might characterize different regions of white matter depending on the underlying microstructures. As demonstrated by the magnitude changes in Cl and Cp spanning 0–4 years, both Cl and Cp increased nonlinearly during early brain development with the most rapid changes occurring during the 1st postnatal year. Throughout the first four years of life, structures of peripheral white matter became more prominent, especially in Cp images.
Voxel base growth velocity maps of Cl and Cp
To quantify the evolution of Cl and Cp, an AIC based voting process was used to select the optimal regression model. In Cl, the percentages of votings received by linear logarithm fitting compared to the five polynomial fittings were (70.0%, 30.0%), (69.9%, 30.1%), (73.7%, 26.3%), (84.0%, 16.0%) and (99.2%, 0.8%) respectively for linear, quadratic, cubic, quartic and quintic fittings. In Cp, the precentages of votings received by linear logarithm fitting compared to the five polynomial fittings were (53.4%, 46.6%), (64.3%, 35.7%), (71.1%, 28.9%), (81.2%, 18.8%) and (99.3%, 0.7%). Since the linear logarithm fitting performed better than all these five candidate polynomial models, it was selected for further regression analysis. As in Eq. [5] of the linear logarithm fitting, the coefficient β1 (in the unit of 1/log(days)) was referred as the growth velocity and future analysis was based upon this coefficient. The β1 coefficients for FA, MD, C1 and Cp thus represent a logarithm scale based growth velocity for these four DTI parameters, and were referred as VCl, VCp, VFA and VMD. VCl, VCp and VFA are in the unit of 1/log(days), while VMD is in the unit of (10−3mm2/s)/log(days).
For Cl and Cp, the null hypothesis, H0 : Rβ = 0 was tested to detect the brain regions with significant growth velocities. Given the velocity as β1 as in Eq. [5], R was chosen as (0, 1) to detect the brain regions where the null hypothesis β1 = 0 was rejected. With the linear logarithm fitting, the coefficient maps of β1 suggested a nonlinear temporal evoluation patterns for Cl and Cp.
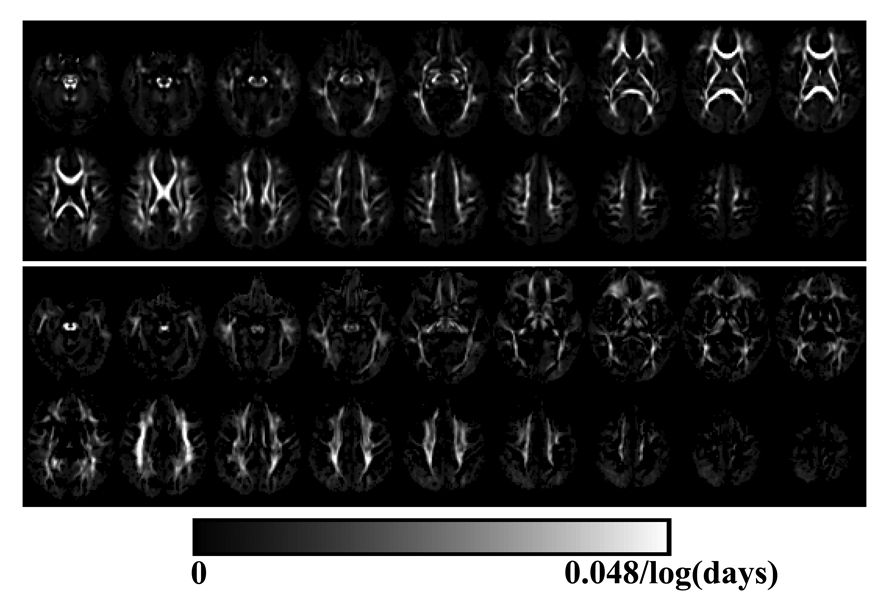
As apparent in Fig. 5, the growth velocities of Cl and Cp were positive, suggesting that Cl and Cp were nonlinearly increasing in white matter with development, which agreed with the observations from the mean images of different age groups (Fig. 3 and 4). The growth velocities of Cl were higher in major white matter tracts such as corpus callosum and PLIC. In contrast, the increasing growth velocities in Cp was more significant in some peripheral white matter regions, such as frontal white matter, CR and SLF, while the growth velocity remained low in major central white matter structures like the corpus callosum and PLIC (Fig. 5). It appeared that most of the prominent growths in Cl and Cp were not spatially concomitant.
Fig. 5.
White matter regions with significant temporal increase in Cl (top panel) and Cp (middle planel). It was apparent that most white matter regions demonstrated significant increase in Cl, while the regions with significant increase in Cp were more distributed within peripheral white matters.
Growth trajectories from selected white matter regions
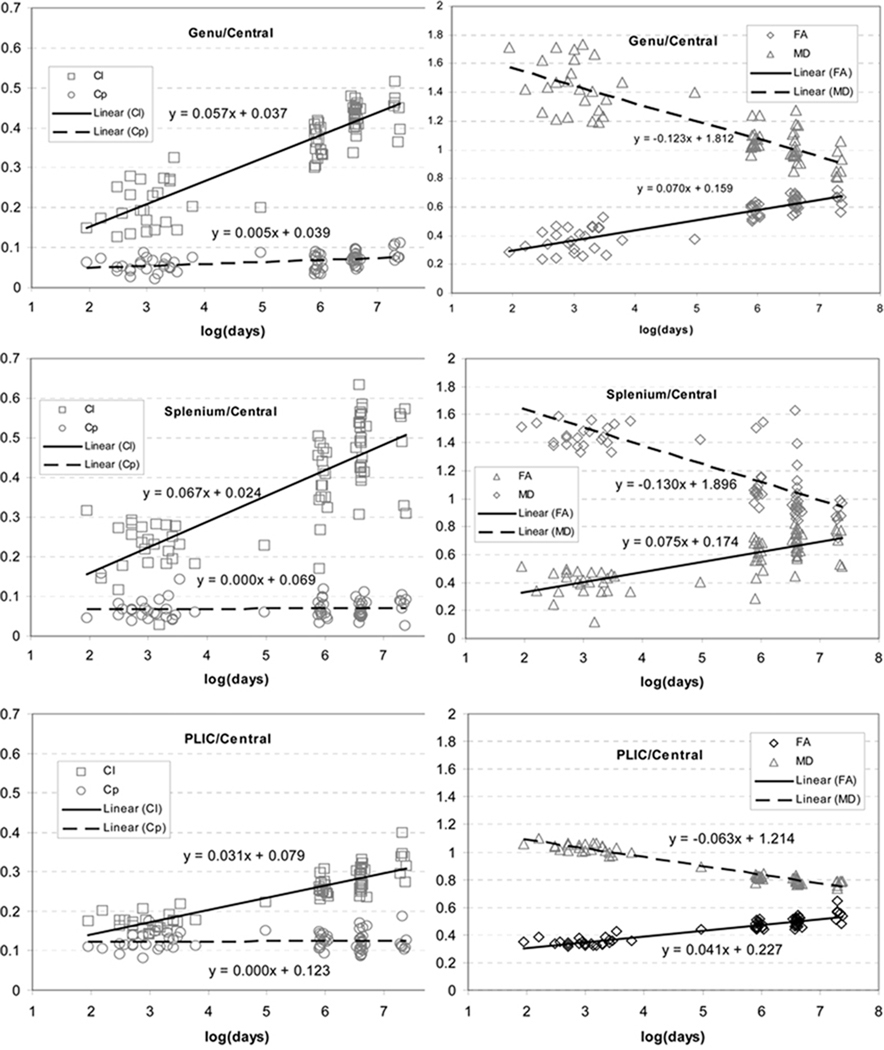
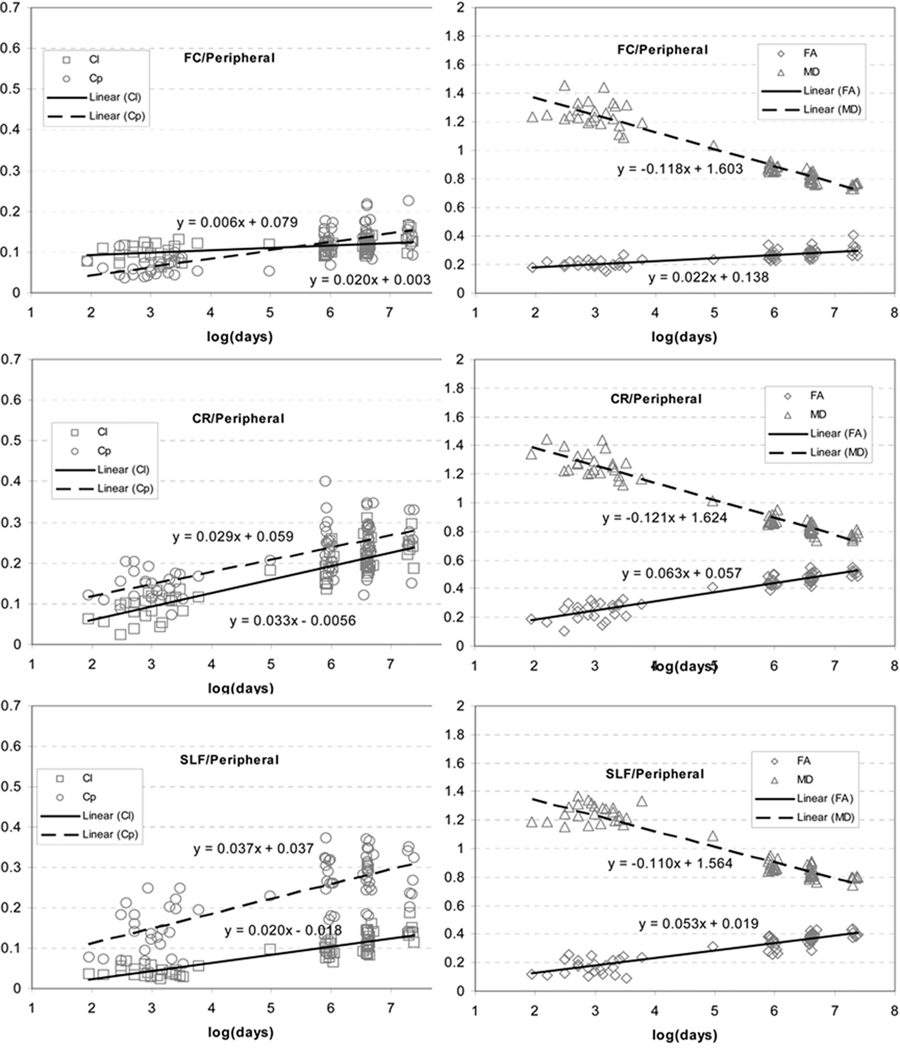
In the ROIs as given in Fig. 6, the growth trajectories in FA and MD (Fig. 7 and 8) confirmed the previous findings that FA increases while MD decreases in early brain development. The growth velocities for FA were 0.0700±0.0451, 0.0746±0.0078, 0.0410±0.0152, 0.0216±0.0125, 0.0632±0.0075 and 0.0531±0.0126 for Genu, Splenium, PLIC, FC, CR and SLF, respectively. The growth velocities for MD were −0.1226±0.0672, −0.1305±0.0138, −0.0632±0.0057, −0.1189±0.0126, −0.1211±0.0073 and −0.1099±0.0057 for these same aforementioned six regions, respectively.
Fig. 7.
The growth trajectories of Cl, Cp, FA and MD obtained with the linear logarithm fitting from central brain regions including Genu, Splenium, and PLIC (the central ROIs from Fig. 6).
Fig. 8.
The growth trajectories of Cl, Cp, FA and MD obtained with the linear logarithm fitting from pheripheral brain regions including FC, CR and SLF (the peripheral ROIs from Fig. 6).
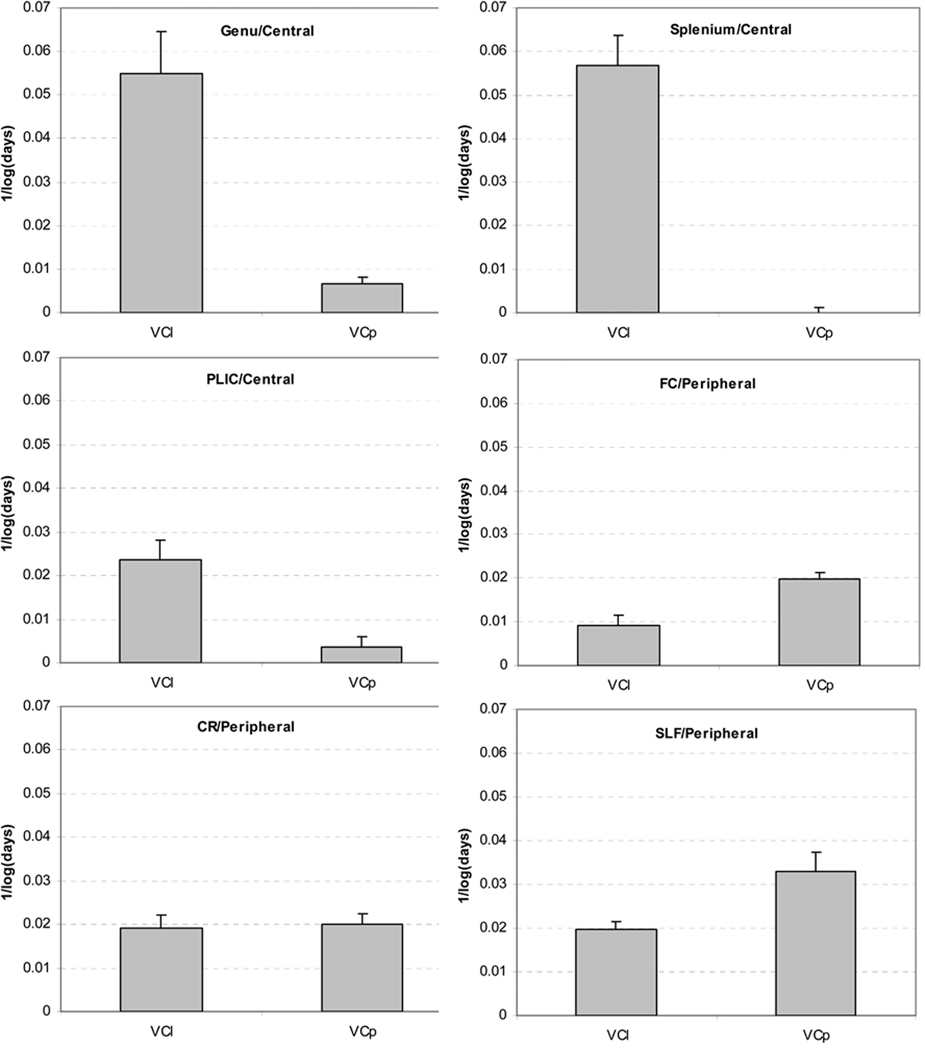
The three central white matter ROIs had high VCl (0.0573±0.398 for Genu, 0.0665±0.0093 for Splenium and 0.0311±0.0151 for PLIC), but a very low VCp (0.0052±0.0024 for Genu, 0.0001±0.0038 for Splenium and 0.0001±0.0070 for PLIC). VCl were approximately 10 times higher than VCp in these regions and paired t-tests revealed significant differences between them (p<0.01 for genu, p<10−4 for splenium and p<10−6 for PLIC). As shown in Fig 7, within Genu and Splenium, Cl was greater than Cp in neonates. Moreover, VCl was much greater than VCp in these two regions, resulting in an even greater difference between Cl and Cp at year 4. This observation suggests that, although the cylindrical structures of genu and splenium were already established at birth, myelination produced further barriers to the water diffusion perpendicular to the white matter tracts, leading to more prominent linear structures of the diffusion tensors. In the PLIC, a predominant linear white matter diffusion tensor structure was gradually constructed over time, due to the greater VCl (Fig. 7).
Compared to central regions, the differences between VCl and VCp were more complex in the three peripheral ROIs and they all had significant increases in Cp (Fig. 8). For FC, Cl remained consistently low and VCl was significantly lower than VCp (VCl = 0.0061±0.0071, VCp = 0.0201±0.0057, p<10−6). For CR, both Cl and Cp increased at a similar velocity (VCl = 0.0329±0.0056, VCp = 0.0293±0.0046, p=0.072). Conversely, for SLF, both Cl and Cp increased, however VCp was significantly greater than VCl (VCl = 0.0203±0.0061, VCp = 0.0371±0.0105, p<10−6).
In order to account for multiple comparisons between VCl and VCp among the above six ROIs, FDR was controled with a threshold of 0.05 (Nichols, 2003) to the above six comparisons. All the above identified significant differences between VCl and VCp remained signficant after FDR correction.
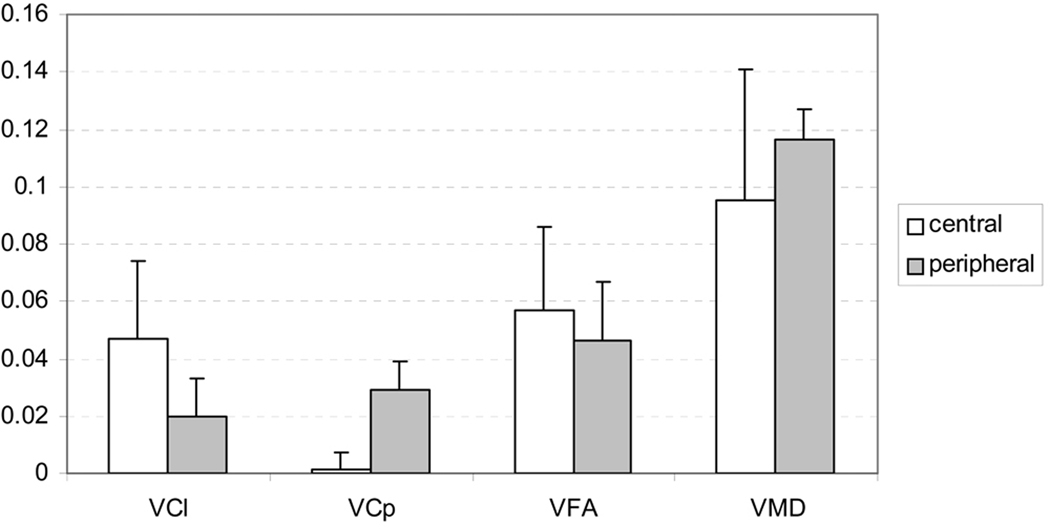
We also compared the growth velocities between central and peripheral white matters by combining the central ROIs (including Genu, Splenium and PLIC) and peripheral ROIs (including FC, CR and SLF), respectively, into two groups and the results were given in Fig. 9. VFA in central white matter was significantly higher than peripheral white matter (central: 0.0567±0.0291, peripheral: 0.0460±0.0210, p=0.045). VMD was significantly higher in peripheral white matter than the central (central: −0.0949±0.0462, peripheral: −0.1166±0.0101, p=0.0012). VCl in central white matter was significantly higher than its counterpart in peripheral white matter (central: 0.0465±0.0273, peripheral: 0.0198±0.0127, p<10−6, Fig. 9). In contrast, peripheral white matter VCp was significantly higher than central white matter (central: 0.0014±0.0058, peripheral: 0.0289±0.0101, p<10−6, Fig. 9). Furthermore, VCl in central white matter was also significantly higher than VCp in peripheral regions (p<10−4, Fig. 9). All these identified significanes remained signficant after FDR was controled at the level of 0.05 to adjust for multiple comparisons for these five comparisons (Nichols, 2003).
Fig. 9.
The comparisons of VFA, VMD, VCl and VCp between central (combing Genu, Splenium and PLIC) and peripheral (combining FC, CR and SLF) white matters. The VFA was significantly higher in central region (p=0.045), while VMD was significantly higher in peripheral white matter (p=0.0012). The VCl in the central was significantly higher than both the VCl (p<10−6) and VCp (p<10−4) in the peripheral. Contrarily, VCp was significantly higher in the peripheral than in the central (p<10−6).
The mean and standard deviations from the ROIs with different centers and sizes were summarized in Fig. 10. Central brain regions had very high VCl and very low VCp. In FC regions, VCp was higher than VCl, while in CR and SLF regions, comparable VCl and VCp were observed. Thus, these qualitative results suggested the consistency of our findings.
Fig. 10.
The mean and standard deviations of the VCl and VCp from the various ROIs centered at the voxels located in the original ROIs given in Fig. 6 with different sizes.
Discussion
Prior research by Wiegell et al has revealed that high planar components were observed in peripheral white matter, including fiber crossing areas, corona radiata and superior longitudinal fasciculus (Wiegell, 2000). Another study investigating the image contrast originating from the secondary and tertiary eigenvalues has demonstrated that their differences are helpful for tissue segmentation and diagnosis of white matter lesions (Zhang, 2006). Since different white matter regions have dissimilar underlying microstructures, we hypothesized that these brain regions may have different characteristics in diffusion tensors during the early postnatal brain maturation process. We have found that growth velocities of Cl and Cp revealed distinct patterns in central and peripheral white matter. To the best of our knowledge, the present study demonstrates, for the first time, the temporal changes of these geometrical diffusion parameters. Moreover, our results suggest that diffusion tensor changes during brain maturation need to be interpretated within the context of evolving, locoregional white matter structures.
In general, the identified nonlinear growth patterns in these two geometrical diffusion measures agreed with the nonlinear growth in FA and MD revealed by previous studies. Hermoye et al demonstrated that FA and MD underwent a rapid change within the first year, followed by a slower change within the 2nd year, and a more steady phase thereafter (Hermoye et al., 2006). In our study, as apparent in the mean Cl and Cp images from different age groups, Cl and Cp temporal progressions were also in line with this FA and MD based study. In addition, the presence of almost all major white matter tracts in the mean Cl and Cp images in neonates also agreed with the previous report that all major white matter tracts were clearly identifiable at birth with FA images (Zhang et al., 2007). Furthermore, the presences of high Cl and Cp contrasts within the white matter suggested that both the cylindrical and fanning or crossing structures of white matter may have already been formed at birth in various white matter regions.
Compared to FA based early brain developmental studies, the temporal evoluation of Cl and Cp may reveal additional information. The different spatial distribution patterns of VCl and VCp (Fig. 5) suggested that the information from Cl and Cp are completementary to each other. Since FA is a composite measure from all three eignvectors, both the increases in Cl and Cp will cause FA to increase. Thus, condensation of the growth patterns from Cl and Cp into FA may lose specificity.
We compared the growth velocities of Cl and Cp among several white matter regions distributed within central and peripheral white matter (Fig. 7 and 8). Our analysis revealed that the central white matter had significantly higher VCl and lower VCp when compared to the peripheral white matter (Fig. 9). Our results suggest the highly organized fiber bundles in these central major white matter regions (the structure with λ1 >> λ2 ~ λ3 as illustrated in Fig. 2) were already formed and the large growth velocity of Cl further enhanced the cylindrical-like shapes of diffusion tensors in these major white matter regions. The large growth in Cl may reflect the rapid myelination process in these centeral major white matter regions. Based on our current understanding, if the underlying white matter fibers are not arranged as compact bundles travelling in one direction, but rather form a meshwork, as in the case of fiber crossing areas or fanning sites, as depicted in Fig. 2, the 2nd eigenvector represents the dispersion of fibers (Wiegell, 2000). Therefore, if considerable Cp can be derived from the difference between the secondary and tertiary eigenvalues, a planar diffusion tensor model would better reflect these complex microstructures. Within these white matter regions, myelination will cause Cp to increase, and depending on the underlying white matter structures, Cl may either increase (like CR and SLF in Fig. 8) or remain steady (like FC in Fig. 8) with development. Thus, we speculate that within central white matter regions with a consistently low Cp (Cp<=0.1 and VCp ~ 0 Fig. 8), the increase in Cl may be associated with increased myelination. In contrast, the fiber crossing area (FC in Fig. 8) had a completely opposite temporal behaviour with an increase in Cp (VCp =0.0201) and a consistently low Cl (VCl =0.0061) (Fig. 8). We speculate that the consistently low Cl indicates that the fiber crossing structures were maintained and no improvement in fiber allignment occurred in this region occurred during early brain development. As a result, in this area, in contrast to central white matter, VCp may be a more accurate reflection of myelination than VCl. Unlike the central white matter and the fiber crossing region, where only either Cl or Cp changed with development, the interpretations of simultaneous increases in Cl and Cp, as observed in CR and SLF was more difficult. The concurent increases in Cl and Cp may represent both the changes in white matter microstructure and the myelination process. As pointed out by Beaulieu, it remains a challenge to address whether the observed increases in diffusion anisotropy with development is caused by ongoing myelination or more highly compacted architecture and regular orientation of white matter fiber tracts (Beaulieu, 2002). Our current work and the previous studies (Provenzale JM, 2007; Wiegell, 2000; Zhang, 2006) have not addressed this question. In addition, we can not differentiate whether the increase in Cp reflected fiber fanning or the change in the angles between the crossing fibers for CR and SLF. Previously, the high Cp values in SLF was attributed to fiber fanning as stated by Wiegell (Wiegell, 2000). Complementary information from other modalities, including histologic analysis, may be able to determine the physiological and structural origins of the temporal changes of Cl and Cp in such regions.
The significantly higher VCl in central white matter regions when compared to both VCl and VCp in selected peripheral white matter areas (Fig. 9) is in agreement with the central to peripheral patterns of maturation as previously reported (Gao et al., 2008; Gilmore et al., 2007; Hermoye et al., 2006; Zhai et al., 2003). Corpus callosum and PLIC consist of larger diameter axons and there is evidence that the diameter of an axon has to reach a critical threshold before myelination begins (Sherman, 2005). Thus, the time course of the onset of myelination between central and peripheral white matter may contriubte to their highly significant difference in VCl. Another factor may contribute to this central-peripheral difference is that the ratio between the axon diameter and the thickness of myelin sheath tends to follow a constant g-ratio between 0.6 and 0.7 (Sherman, 2005). The corpus callosum and PLIC have thicker myelin sheaths when compared to more peripheral white matter fibers, which may leave less extracelluar space for water diffusion and be more restrictive to water diffusion perpendicular to the axons.
In this work, we have identified brain regions with significant growth velocities of Cp, indicating where λ2 and λ3 had different growth trajectories during early brain development. One immediate physiological implication is that the current hypothesis that the the average of λ2 and λ3 (radial diffusivity) can be used as an indicator for myelination process (Song et al., 2003) may need further scrutiny in early brain developmental studies since this hypothesis originated from a dysmyelination study in shivering mice with an assumption of cylindrical shapes of white matter. Our current results suggested that in major white matter regions such as corpus callosum and PLIC, this hypothesis may still apply since the difference between λ2 and λ3 remained trivial during development (VCp ~ 0/log(days)). On the other hand, in regions where white matter crosses or fans out, caution should be exercised in relating the myelination process to the decrease in radial diffusivity. Future effort should be directed towards understanding the structural and physiological origin of the difference between these two eigenvalues, the average of which may not reflect myelination since these two eigenvalues may not pertain to the same structural or physiological entity.
Although the temptation exists to correlate the temporal evolutions of Cl and Cp with changes in underlying white matter structures, future investigations incorporating histological analysis may permit a more accurate view into the microstructural and physiological underpinning of the observed changes in Cl and Cp. Our current results were based exclusively upon DTI parameters and a narrow interpretation of DTI alone would be flawed without consideration of the numerous and complex factors leading to increases in diffusion anisotropy, including myelination, reduction in brain water, increasing alignment and compaction of the fibre tracts, and the reduced extra-axonal space during early brain development (Beaulieu, 2002). Another limitation is that, like previous works, the imaging protocol may not be optimized for early brain developmental studies. The optimal voxel size for DTI may be different in neonates, given the substantially smaller headsize compared to older individuals. The six gradient encoding directions for DTI acquistion used in our study may not be optimal. To the best of our knowledge, the optimal DTI protocol for pediatric imaging remains to be determined.
Conclusion
Even though DTI is considered a simplified representation of local water diffusion within tissue, information associated with temporal changes available from the three eigenvalues has not been fully interrogated in order to investigate early brain development. We have quantified the spatial and temporal growth patterns of two geometrical diffusion measures (Cl and Cp). Through comparing their growth veolocities involving multiple white matter regions, we demonstrated that, depending on the underlying white matter microstructure, different white matter regions may have different growth patterns in Cl and Cp. Thus, caution should to be taken when interpreting the temporal changes of DTI in early brain maturation due to the regionally specific, complex architecture of white matter. Future work, including DTI correlation with histologic evaluation, is imperative in order to elucidate the microstructural and physiological underpinnings of the temporal changes of these geometrical diffusion measures during early brain development.
Research highlights.
Longitudinal DTI data acquisition.
Longitudinal regression analysis for early brain developmental study with DTI.
Spatio-temporal growth patterns of Cl and Cp in early brain development.
Cl and Cp have different spatial distribution patterns.
White matter structures may affect the growth patterns of Cl and Cp.
Acknowledgement
This study was supported in part by NSF grant BCS-08-26844 and NIH grants RR025747-01, P01CA142538-01, MH086633, and AG033387, NIH grants 1R01EB006733, R01EB008374, and 1R01EB009634, NIH grants R01MH070890 and R01HD053000, and NIH grant R01NS055754.
Footnotes
Publisher's Disclaimer: This is a PDF file of an unedited manuscript that has been accepted for publication. As a service to our customers we are providing this early version of the manuscript. The manuscript will undergo copyediting, typesetting, and review of the resulting proof before it is published in its final citable form. Please note that during the production process errors may be discovered which could affect the content, and all legal disclaimers that apply to the journal pertain.
As pointed out in Mukherjee and McKinstry (2006), pretermity and sedation are two major limitations to numerous current brain developmental studies.
The spherical component (Cs) was not included in this study, because our analysis was focused upon the differences between the three eigenvalues. Furthermore, Cs is completely determined by the summation of Cl and Cp
References
- Akaike H. A new look at the statistical model identification. IEEE Transactions on Automatic Control. 1974;19:716–723. [Google Scholar]
- Basser PJ, Pierpaoli C. Microstructural and physiological features of tissues elucidated by quantitative-diffusion-tensor MRI. J Magn Reson B. 1996;111:209–219. doi: 10.1006/jmrb.1996.0086. [DOI] [PubMed] [Google Scholar]
- Beaulieu C. The basis of anisotropic water diffusion in the nervous system - a technical review. NMR Biomed. 2002;15:433–455. doi: 10.1002/nbm.782. [DOI] [PubMed] [Google Scholar]
- Berman JI, Mukherjee P, Partridge SC, Miller SP, Ferriero DM, Barkovich AJ, Vigneron DB, Henry RG. Quantitative diffusion tensor MRI fiber tractography of sensorimotor white matter development in premature infants. Neuroimage. 2005;27:862–871. doi: 10.1016/j.neuroimage.2005.05.018. [DOI] [PubMed] [Google Scholar]
- Cascio CJ, Gerig G, Piven J. Diffusion tensor imaging: Application to the study of the developing brain. J Am Acad Child Adolesc Psychiatry. 2007;46:213–223. doi: 10.1097/01.chi.0000246064.93200.e8. [DOI] [PubMed] [Google Scholar]
- Diggle P, Heagerty P, Liang K-Y, Zeger S. Analysis of Longitudinal Data. 2002 [Google Scholar]
- Dubois J, Hertz-Pannier L, Dehaene-Lambertz G, Cointepas Y, Le Bihan D. Assessment of the early organization and maturation of infants' cerebral white matter fiber bundles: a feasibility study using quantitative diffusion tensor imaging and tractography. Neuroimage. 2006;30:1121–1132. doi: 10.1016/j.neuroimage.2005.11.022. [DOI] [PubMed] [Google Scholar]
- Faria AV, Zhang J, Oishi K, Li X, Jiang H, Akhter K, Hermoye L, Lee SK, Hoon A, Stashinko E, Miller MI, van Zijl PC, Mori S. Atlas-based analysis of neurodevelopment from infancy to adulthood using diffusion tensor imaging and applications for automated abnormality detection. Neuroimage. 2010;52:415–428. doi: 10.1016/j.neuroimage.2010.04.238. [DOI] [PMC free article] [PubMed] [Google Scholar]
- Faria AVZJ, Oishi K, Li X, Jiang H, Akhter K, Hermoye L, Lee SK, Hoon A, Stashinko E, Miller MI, van Zijl PC, Mori S. Atlas-based analysis of neurodevelopment from infancy to adulthood using diffusion tensor imaging and applications for automated abnormality detection. Neuroimage. 2010;52:415–428. doi: 10.1016/j.neuroimage.2010.04.238. [DOI] [PMC free article] [PubMed] [Google Scholar]
- Gao W, Lin W, Chen Y, Gerig G, Smith JK, Jewells V, Gilmore JH. Temporal and Spatial Development of Axonal Maturation and Myelination of White Matter in the Developing Brain. AJNR Am J Neuroradiol. 2008 doi: 10.3174/ajnr.A1363. [DOI] [PMC free article] [PubMed] [Google Scholar]
- Gilmore JH, Lin W, Corouge I, Vetsa YS, Smith JK, Kang C, Gu H, Hamer RM, Lieberman JA, Gerig G. Early postnatal development of corpus callosum and corticospinal white matter assessed with quantitative tractography. AJNR Am J Neuroradiol. 2007;28:1789–1795. doi: 10.3174/ajnr.A0751. [DOI] [PMC free article] [PubMed] [Google Scholar]
- Gupta RK, Hasan KM, Trivedi R, Pradhan M, Das V, Parikh NA, Narayana PA. Diffusion tensor imaging of the developing human cerebrum. J Neurosci Res. 2005;81:172–178. doi: 10.1002/jnr.20547. [DOI] [PubMed] [Google Scholar]
- Hermoye L, Saint-Martin C, Cosnard G, Lee SK, Kim J, Nassogne MC, Menten R, Clapuyt P, Donohue PK, Hua K, Wakana S, Jiang H, van Zijl PC, Mori S. Pediatric diffusion tensor imaging: normal database and observation of the white matter maturation in early childhood. Neuroimage. 2006;29:493–504. doi: 10.1016/j.neuroimage.2005.08.017. [DOI] [PubMed] [Google Scholar]
- Huang H, Zhang J, Wakana S, Zhang W, Ren T, Richards LJ, Yarowsky P, Donohue P, Graham E, van Zijl PC, Mori S. White and gray matter development in human fetal, newborn and pediatric brains. Neuroimage. 2006;33:27–38. doi: 10.1016/j.neuroimage.2006.06.009. [DOI] [PubMed] [Google Scholar]
- Hüppi P, Dubois J. Diffusion tensor imaging of brain development. Semin Fetal Neonatal Med. 2006;11:489–497. doi: 10.1016/j.siny.2006.07.006. [DOI] [PubMed] [Google Scholar]
- Le Bihan D, Breton E, Lallemand D, Grenier P, Cabanis E, Laval-Jeantet M. MR imaging of intravoxel incoherent motions: application to diffusion and perfusion in neurologic disorders. Radiology. 1986;161:401–407. doi: 10.1148/radiology.161.2.3763909. [DOI] [PubMed] [Google Scholar]
- Lebel C, Walker L, Leemans A, Phillips L, Beaulieu C. Microstructural maturation of the human brain from childhood to adulthood. Neuroimage. 2008;40:1044–1055. doi: 10.1016/j.neuroimage.2007.12.053. [DOI] [PubMed] [Google Scholar]
- Liang KY, Zeger SL. Longitudinal data analysis using generalized linear models. Biometrika. 1986;73:13–22. [Google Scholar]
- Liu T, Li H, Wong K, Tarokh A, Guo L, Wong S. Brain tissue segmentation based on DTI data. Neurimage. 2007;38:114–123. doi: 10.1016/j.neuroimage.2007.07.002. [DOI] [PMC free article] [PubMed] [Google Scholar]
- Löbel USJ, Güllmar D, Kaiser WA, Reichenbach JR, Mentzel HJ. Diffusion tensor imaging: the normal evolution of ADC, RA, FA, and eigenvalues studied in multiple anatomical regions of the brain. Neuroradiology. 2009;51:253–263. doi: 10.1007/s00234-008-0488-1. [DOI] [PubMed] [Google Scholar]
- McKinstry RC, Mathur A, Miller JH, Ozcan A, Snyder AZ, Schefft GL, Almli CR, Shiran SI, Conturo TE, Neil JJ. Radial organization of developing preterm human cerebral cortex revealed by non-invasive water diffusion anisotropy MRI. Cereb Cortex. 2002;12:1237–1243. doi: 10.1093/cercor/12.12.1237. [DOI] [PubMed] [Google Scholar]
- Mukherjee P, McKinstry RC. Diffusion tensor imaging and tractography of human brain development. Neuroimaging Clin N Am. 2006;16:19–43. doi: 10.1016/j.nic.2005.11.004. vii. [DOI] [PubMed] [Google Scholar]
- Mukherjee P, Miller JH, Shimony JS, Conturo TE, Lee BC, Almli CR, McKinstry RC. Normal brain maturation during childhood: developmental trends characterized with diffusion-tensor MR imaging. Radiology. 2001;221:349–358. doi: 10.1148/radiol.2212001702. [DOI] [PubMed] [Google Scholar]
- Mukherjee P, Miller JH, Shimony JS, Philip JV, Nehra D, Snyder AZ, Conturo TE, Neil JJ, McKinstry RC. Diffusion-tensor MR imaging of gray and white matter development during normal human brain maturation. AJNR Am J Neuroradiol. 2002;23:1445–1456. [PMC free article] [PubMed] [Google Scholar]
- Neil J, Miller J, Mukherjee P, Hüppi PS. Diffusion tensor imaging of normal and injured developing human brain - a technical review. NMR Biomed. 2002;15:543–552. doi: 10.1002/nbm.784. [DOI] [PubMed] [Google Scholar]
- Neil JJ, Shiran SI, McKinstry RC, Schefft GL, Snyder AZ, Almli CR, Akbudak E, Aronovitz JA, Miller JP, Lee BC, Conturo TE. Normal brain in human newborns: apparent diffusion coefficient and diffusion anisotropy measured by using diffusion tensor MR imaging. Radiology. 1998;209:57–66. doi: 10.1148/radiology.209.1.9769812. [DOI] [PubMed] [Google Scholar]
- Nichols T, Hayasaka S. Controlling the familywise error rate in functional neuroimaging: a comparative review. Stat Methods Med Res. 2003;12:419–446. doi: 10.1191/0962280203sm341ra. [DOI] [PubMed] [Google Scholar]
- Provenzale JMLL, DeLong D, White LE. Diffusion tensor imaging assessment of brain white matter maturation during the first postnatal year. Am J Roentgenol. 2007;189:476–486. doi: 10.2214/AJR.07.2132. [DOI] [PubMed] [Google Scholar]
- Schneider JF, Il'yasov KA, Hennig J, Martin E. Fast quantitative diffusion-tensor imaging of cerebral white matter from the neonatal period to adolescence. Neuroradiology. 2004;46:258–266. doi: 10.1007/s00234-003-1154-2. [DOI] [PubMed] [Google Scholar]
- Shen D. Image registration by local histogram matching. IEEE Trans Med Imaging. 2007;40:1161–1172. [Google Scholar]
- Shen D, Davatzikos C. HAMMER: hierarchical attribute matching mechanism for elastic registration. IEEE Trans Med Imaging. 2002;21:1421–1439. doi: 10.1109/TMI.2002.803111. [DOI] [PubMed] [Google Scholar]
- Sherman D, Brophy PJ. Mechanisms of axon ensheathment and myelin growth. Nat Rev Neurosci. 2005;6:683–690. doi: 10.1038/nrn1743. [DOI] [PubMed] [Google Scholar]
- Smith SM, Johansen-Berg H, Jenkinson M, Rueckert D, Nichols TE, Miller KL, Robson MD, Jones DK, Klein JC, Bartsch AJ, Behrens TE. Acquisition and voxelwise analysis of multi-subject diffusion data with tract-based spatial statistics. Nat Protoc. 2007;2:499–503. doi: 10.1038/nprot.2007.45. [DOI] [PubMed] [Google Scholar]
- Song SK, Sun SW, Ju WK, Lin SJ, Cross AH, Neufeld AH. Diffusion tensor imaging detects and differentiates axon and myelin degeneration in mouse optic nerve after retinal ischemia. Neuroimage. 2003;20:1714–1722. doi: 10.1016/j.neuroimage.2003.07.005. [DOI] [PubMed] [Google Scholar]
- Wakana S, Jiang H, Nagae-Poetscher L, van Zijl P, Mori S. Fiber Tract-based Atlas of Human White Matter Anatomy. Radiology. 2004;230:77–87. doi: 10.1148/radiol.2301021640. [DOI] [PubMed] [Google Scholar]
- Wiegell MR, Larsson HB, Wedeen VJ. Fiber crossing in human brain depicted with diffusion tensor MR imaging. Radiology. 2000;217:897–903. doi: 10.1148/radiology.217.3.r00nv43897. [DOI] [PubMed] [Google Scholar]
- Wimberger DM, Roberts TP, Barkovich AJ, Prayer LM, Moseley ME, Kucharczyk J. Identification of "Premyelination" by Diffusion-Weighted MRI. Journal of Computer Assisted Tomography. 1995;19:28–33. doi: 10.1097/00004728-199501000-00005. [DOI] [PubMed] [Google Scholar]
- Zhai G, Lin W, Wilber KP, Gerig G, Gilmore JH. Comparisons of regional white matter diffusion in healthy neonates and adults performed with a 3.0-T head-only MR imaging unit. Radiology. 2003;229:673–681. doi: 10.1148/radiol.2293021462. [DOI] [PubMed] [Google Scholar]
- Zhang J, Evans A, Hermoye L, Lee SK, Wakana S, Zhang W, Donohue P, Miller MI, Huang H, Wang X, van Zijl PC, Mori S. Evidence of slow maturation of the superior longitudinal fasciculus in early childhood by diffusion tensor imaging. Neuroimage. 2007;38:239–247. doi: 10.1016/j.neuroimage.2007.07.033. [DOI] [PMC free article] [PubMed] [Google Scholar]
- Zhang J, van Zijl PC, Mori S. Image contrast using the secondary and tertiary eigenvectors in diffusion tensor imaging. Magn Reson Med. 2006;55:439–449. doi: 10.1002/mrm.20767. [DOI] [PubMed] [Google Scholar]
- Zhu H, Li Y, Tang N, Bansal R, Hao X, Weissman M, Peterson BG. Statistical Modelling of Brain Morphological Measures within Family Pedigrees. Statistica Sinica. 2008;18:1569–1591. [PMC free article] [PubMed] [Google Scholar]


