

Abstract
Both decision making and sensorimotor control require real-time processing of noisy information streams. Historically these processes were thought to operate sequentially: cognitive processing leads to a decision, and the outcome is passed to the motor system to be converted into action. Recently, it has been suggested that the decision process may provide a continuous flow of information to the motor system, allowing it to prepare in a graded fashion for the probable outcome. Such continuous flow is supported by electrophysiology in nonhuman primates. Here we provide direct evidence for the continuous flow of an evolving decision variable to the motor system in humans. Subjects viewed a dynamic random dot display and were asked to indicate their decision about direction by moving a handle to one of two targets. We probed the state of the motor system by perturbing the arm at random times during decision formation. Reflex gains were modulated by the strength and duration of motion, reflecting the accumulated evidence in support of the evolving decision. The magnitude and variance of these gains tracked a decision variable that explained the subject's decision accuracy. The findings support a continuous process linking the evolving computations associated with decision making and sensorimotor control.
Introduction
The nervous systems of simple animals channel information from the senses more or less directly to the motor system. More elaborate behaviors necessitate freedom from the immediacy imposed by evanescent sensory input and the real-time demands of motor control. Such elaboration arises in the sorts of cognitive decision making that dominate our mental lives. As such, decision making may be viewed simultaneously as a model for cognition and as an extension of simple sensorimotor couplings.
A simple form of decision making arises in the setting of perception under ambiguity, when signals are masked by the presence of noise. For example, the discrimination between two directions of motion in a noisy random dot display invites an analogy to a jury deliberating over the evidence to reach a verdict. For such simple perceptual decisions, much is known about the neural mechanisms underlying evidence accumulation and the rendering of a choice. When a choice is ultimately communicated through an action, say to move the eyes, the evolving decision process has its neural correlate in the firing rates of neurons in areas of the brain that play a role in planning eye movements (Schall, 2001; Sugrue et al., 2005; Gold and Shadlen, 2007; Glimcher et al., 2008). These and other findings suggest that the oculomotor system receives a continuous flow of information that could help to prepare an eventual action (Bichot et al., 2001; Gold and Shadlen, 2001; Horwitz et al., 2004).
Such continuous flow (Eriksen and Schultz, 1979) might seem like a peculiar design for a brain because it challenges the common-sense notion that decisions concern information bearing on propositions and not the actions that ensue as a result of the decision. After all, when we view a noisy random dot display, our categorical decisions do not seem to be about how we will answer but what we perceive as the correct direction. Moreover, it may not be possible to draw general conclusions about the flow of information in humans based on studies in trained monkeys. We might be inclined to accept that monkeys, which are highly trained to associate a decision with a motor response, map decisions to actions, whereas humans simply do not.
The human motor system exhibits preparatory activity (Evarts and Tanji, 1976; Riehle and Requin, 1989) which has been shown to support the competition between alternative actions (Cisek and Kalaska, 2002; Cisek, 2007; Michelet et al., 2010), but it is not known whether such preparatory activity reflects the type of deliberation that underlies formation of a decision. To examine this possibility, we studied a decision process that involved judging the direction of motion in a random dot motion display, which subjects indicated by moving a handle to one of two choice targets. We probed the state of the motor system by perturbing the arm at random moments during decision formation and measuring the strength of the stretch reflexes with electromyography. The gains of these reflexes revealed an approximately linear dependence on the evolving decision variable (DV) suggesting that the human brain does not wait for a decision to be completed before recruiting the motor system but instead passes partial information to prepare in a graded fashion for a probable action outcome.
Materials and Methods
Subjects.
We analyzed data from four subjects (2 female, 2 male, age range: 24–36 years). A fifth subject was recruited but failed to show reliable EMG responses. All had normal or corrected-to-normal vision and reported no neurological disorders. All subjects were right-handed according to the Edinburgh handedness inventory (Oldfield, 1971). The Cambridge Psychology Research Ethics Committee approved the experimental procedures and all subjects gave informed consent.
Behavioral task.
Subjects were required to decide on the direction of a random-dot motion stimulus in a two-alternative forced choice task and to indicate their choice by moving to one of two targets by making either an elbow flexion or extension movement. The cue to move was a rapid position perturbation that extended the elbow thereby eliciting a reflex response (Fig. 1).
Figure 1.

Experimental setup for the direction-discrimination task. A, Subjects hold the handle of a vBOT manipulandum while deciding on the direction of motion (elbow flexion or extension direction) of a dynamic random dot display. B, Temporal sequence of a single trial. Subjects move to a home position at which point the hand cursor vanishes and a fixation-cross appears. The motion stimulus appears 500–3000 ms later and remains on for 100–1500 ms. The cue for the subjects to respond is a rapid robot-controlled extension of the elbow joint (10 mm in 60 ms) that elicits a stretch reflex. Subjects then indicate their decision by moving to the target corresponding to the direction of perceived motion, at which point the correct target is displayed. C, The time course of key experimental parameters.
Subjects held the handle of a robotic manipulandum (vBOT, Howard et al., 2009) and their forearm was supported against gravity by an air-sled, constraining movement to the horizontal plane, ∼10 cm below shoulder level. The visual scene from a CRT monitor (Sony, 21 inch) was projected into the plane of the hand via a mirror (Fig. 1A). The visual scene consisted of a 5° diameter circular aperture (1.75 cm radius) with a home position (0.6 cm radius circle) displayed at the center of the aperture. On either side of the aperture were 5 cm radius targets, aligned with the elbow flexion and extension directions. Throughout the experiment, the manipulandum generated a 4 N force at the hand at right angles to the forearm and in the elbow extension direction (∼1.3 Nm at the elbow joint), thereby preloading the elbow flexor muscles to enhance the baseline stretch reflex allowing us to assess both increases and decreases in the reflex gain. Subjects were free to take a rest at any time between trials by moving their hand >12.5 cm from the home position, at which point the robotic forces were turned off.
The temporal order of the events in a trial is depicted in Figure 1B and C. To start a trial subjects were required to position their hand (position displayed as a 1-cm-diameter red circle) within the home position. The display of the hand and home position was then extinguished and replaced by a small fixation cross, which subjects were requested to fixate. After a random delay (500–3000 ms, mean 1000 ms, exponentially distributed), a random-dot motion stimulus was presented (Britten et al., 1992) in the aperture. The apparent motion of the dots on each trial was either in the elbow flexion or extension direction and the motion strength of the dots was varied between trials. The dots were white squares, 0.069° per side (two pixels at a screen resolution of 1024 × 768 on a 21 inch monitor positioned 40 cm from the subject's eyes) and 19.2 cd/m2 in luminance, viewed on a black background. The dots were displayed in three interleaved sets of equal size. Each set was displayed in one of three successive video frames (at 75 Hz frame rate) and shown for just a single frame. Three frames later (40 ms), a percentage of the dots from that set was redrawn displaced 0.2° (in a direction appropriate for either flexion or extension) to promote the perception of motion at 5° s−1; the remainder of the dots were redrawn at random locations. Together, the three sets produced a dot density of 15.6 dots per degree2 s−1. The percentage of coherently moving dots (0, 3.2, 6.4, 12.8, 25.6, 51.2%), termed “motion strength,” and the direction (flexion or extension) were randomly varied from trial to trial. We define positive and negative coherences to be for motion in the extension and flexion directions, respectively. Viewing duration was also determined randomly on each trial by drawing from a distribution chosen to approximate a flat hazard function (ensuring subjects could not anticipate the duration; Luce, 1986): 100 ms plus a random time chosen from an exponential distribution with mean 300 ms and truncated at 1500 ms.
Subjects were required to decide the direction of dot motion (flexion or extension direction) and move to the appropriate target. The cue to initiate movement was the onset of a position-controlled perturbation, at which point the visual display of the motion was extinguished. The perturbation was always in the elbow extension direction and was designed to move the hand 10 mm in 60 ms at constant speed (PD-controller: K = 1.2 kN m−1; B = 0.8 kN · s m−1). This perturbation was chosen to elicit a stretch reflex (R). After the perturbation the hand was again free to move under the usual background force and subjects moved to either the flexion or extension target to indicate their choice. Subjects were required to reach the target within 300 ms and were then informed about the correct target. For the 0% coherence trials the “correct” target was randomly chosen. After a familiarization session each subject performed 3600 trials. On each trial the position of the hand was recorded at 1 kHz.
We also conducted control experiments on our subjects in which we measured the fastest voluntary responses to haptic input without the stretch reflex loop being involved. To do this, the amplitude of the perturbation was reduced to 1 mm (easily detectable, but avoiding the stretch reflex) and subjects were exposed only to trials with maximum information: long viewing durations (>0.8 s) and high coherence (51.2%). Subjects were instructed to move as fast as possible to the correct target when they felt the perturbation (and the dots were extinguished). The control experiment was conducted in a separate session and consisted of 60 trials of each motion direction presented in a random order.
Electromyography.
Muscle activity was recorded from six muscles. Two mono-articular elbow flexors (musculus brachioradialis and m. biceps longum), two mono-articular elbow extensors (m. triceps laterale and m. triceps longum) and two biarticular muscles (m. biceps brevis and m. triceps longum). The brachioradialis muscle was excluded from analyses because it suffered from crosstalk of its surrounding muscles that were involved in gripping the handle of the manipulandum. Electromyograms (EMGs) were recorded with a Delsys Bagnoli system (DE-2.1 Single Differential Electrode). Electrode positions were chosen to maximize the signal for the individual muscles and to minimize crosstalk. Before electrode placement, the skin was cleansed with alcohol and an abrasive gel was applied to improve conductance. The EMG signals were analog bandpass-filtered between 20 and 450 Hz and sampled at 2 kHz.
Behavioral performance analysis.
We analyzed the probability of a correct choice as a function of viewing duration (t) and motion strength (C, proportion of coherently moving dots). We fit this behavioral data using a drift-diffusion model to explain each subject's proportion of correct choices as a function of both motion coherence and viewing duration. The proportion of correct responses depends on the decision variable, DV, which is modeled by the stochastic differential equation:
where k relates the drift rate to the motion strength and W denotes standard Brownian motion (with unit variance over one second). Given a coherence and viewing duration, Equation 1 leads to a Gaussian distribution of the DV with mean kCt and variance t. The probability of an extension or flexion choice is given as the integral of this distribution over the positive and negative values of the DV, respectively. We fit this one-parameter diffusion model (parameter k) to each subject's data so as to maximize the likelihood of each subject's choices. Bootstrapping (1000 samples) was used to obtain confidence intervals on the parameter estimates. Preliminary analysis suggested that the data fit was not improved substantially by the inclusion of an absorbing bound (Kiani et al., 2008).
Calculation of the decision variable on a single trial.
For each trial, we calculated the expected distribution of DV given that subject's coherence-dependent drift rate. We can further refine the distribution of the DV by truncating (and renormalizing) to only positive or negative values depending on the decision the subject makes on that trial. The expectation of this truncated Gaussian distribution, denoted DVchoice, is our estimate of the DV that gave rise to the choice on that trial. However, the perturbation probes the state of the DV some τ ms earlier, due to processing delays between visual input and any changes in EMG (Resulaj et al., 2009). We derived an estimate of this delay, τ, for each subject (see Eq. 2 in Electromyographic signal analysis, below). Our interest is in the DV at t − τ, that is based on the stream of information that could affect the reflex. Note that this is not simply the truncated part of the DV distribution at t −τ, as it is possible to have a negative DV at t − τ and a positive DV at t (and vice versa). To estimate the DV at t − τ, we propagate the truncated distribution of DV at t back in time to t − τ using the Kolmogorov backward equations (Kolmogoroff, 1931). We use the expectation of this back-propagated distribution, DVpert, in the analyses in Figure 5 (see Results).
Figure 5.
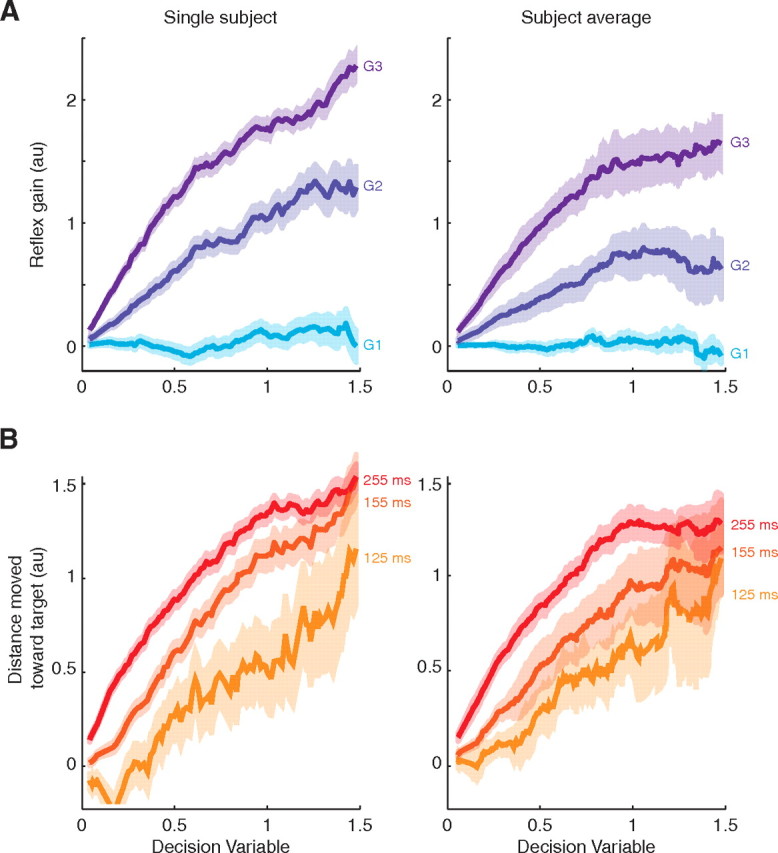
Reflex gains and kinematics track the decision variable. The DV was derived from the drift-diffusion model fit to each subject's choice function and estimated at the time of the perturbation (DVpert). For these graphs, the DVs, reflex gains, and kinematics were combined for both directions of dot motion by changing the sign of the DV and reflex gains for trials with flexion motion. A, Reflex gains as a function of DVpert for one typical subject (left) and the group average (right). Curves are running means of the single-trial estimates across ±0.2 units of DV. Shading indicates SEs across trials. B, Movement excursion toward the choice target as a function of DVpert for one typical subject (left) and the group average (right). Movement excursion was calculated for three time points (125, 155, and 255 ms) after perturbation onset. As the excursions at these time points have very different magnitudes, for plotting purposes the movement excursions have been normalized so that the SD (across all trials) for each time point is unity. Curves are running means, as in A.
We also analyzed the kinematics of the movement after the perturbation in relation to the DV. For each trial, we calculated the distance the hand had moved toward the final choice target from its position at the end of the perturbation at three different points in time: 125, 155, and 255 ms after perturbation onset. For plotting purposes, we normalized these measures for each time point to have unit SD across all trials for that time point. We plot these normalized distances as a function of DVpert in Figure 5 (see Results).
Electromyographic signal analysis.
EMG signals were bandpass filtered (25–250 Hz, fifth order bidirectional Butterworth filter) and full-wave rectified. Reflex activity is known to scale with background muscle activity before perturbation onset (Pruszynski et al., 2009). Therefore we normalized each trial's EMG by dividing by the mean activity over a 100 ms window before perturbation onset. The mean activity in the time windows 20–45 ms (R1), 45–75 ms (R2) and 75–105 ms (R3) after perturbation onset was calculated for the individual muscles on individual trials. R1 and R2 contain no voluntary activity and even R3 has been shown to contain voluntary activity only on a very limited number of trials (Pruszynski et al., 2008).
Since EMG activity typically drifted over the course of the experiment (>4 h) we controlled for drift in the individual muscles. We calculated a 150-point chronological running mean and running SD for each muscle. For each trial, we subtracted the value of this running mean and divided by the running SD, both centered on that trial. The resulting values were the normalized muscular activities for the corresponding time windows.
We calculated the difference between the average normalized flexor muscle activity and the average normalized extensor muscle activity for each time window, thereby quantifying the magnitude of the reflex response and refer to this measure as the reflex gain (G). As stated earlier, all Gs were normalized to background activity. However, to exclude changes in reflex responses due to coactivation (Akazawa et al., 1983; Carter et al., 1993; Lewis et al., 2010) based on accumulated evidence, we also analyzed muscle activity over the 100 ms window before perturbation onset. All procedures were the same as for the reflex gains, except for the first normalization step and that we summed the activity over all muscles. This preprocessing gives us four measures for each trial: G1, G2, G3 and Pre that reflect muscle activity in the R1, R2, R3 and pre-perturbation time window.
To test whether the reflex gains and preactivity depended on motion coherence (C: positive for extension motion direction and negative for flexion motion direction) and viewing time (t), we fit a phenomenological model that allows the gains to be zero until a delay τ and then to increase and plateau as a function of time, with the slope and plateau level dependent on the coherence. We modeled the gains using a cumulative scaled (half) Gaussian function rising after the delay τ, which represents the time delay between dot motion onset and changes in reflex gain:
 |
where σ = σ0 + σ1C and k = k0 + k1C represent the time constant and amplitude of tuning, respectively, which can depend on the coherence level C. We fit equation 2 to the flexion and extension choices from each subject (2 fits per subject). We evaluated the null hypothesis that coherence did not affect these curves (H0: k1 = σ1 = 0), using an F test based on combined “extra sum of squares” from the extension and flexion fits for each subject (total of 4 F tests). We used correct choices only for this analysis to ensure that the effect of motion strength is not explained by different mixtures of flexion and extension choices. The analysis also supplies an estimate of τ, the delay between visual input and any changes in EMG, for each subject (average of the two estimates for extension and flexion data). This delay is used in the estimation of the DV at the time of perturbation (see above, Calculation of the decision variable on a single trial).
Reflex gains are known to be affected by background activity due to cocontraction (Pruszynski et al., 2009). The analysis of the pre-perturbation activity was used to exclude systematic changes in gain as arising from this source.
Prediction of G3 from the decision variable.
The key idea of our study is that reflex activity, especially G3, provides a window on the evolving decision variable. Therefore, we compared the hypothesis that G3 is explained by DVpert to two alternative models: (1) that G3 reflects only the sign of the choice and the amount of viewing time up to the perturbation, that is sgn(C) · t, and (2) that G3 reflects the DV leading to the choice on that trial, without propagation back in time to the moment of the perturbation (DVchoice). To make these comparisons, we performed Gaussian process regression of G3 against each of the three regressors: DVpert, DVchoice, and sgn(C) · t. The models were fit separately to obtain the log likelihood of the data for each fit. We used Gaussian process regression for this analysis because it makes minimal assumptions about the shape of G3 versus time (Rasmussen and Nickisch, 2010). Briefly, while a Gaussian distribution specifies the distribution of data points in terms of its mean and covariance, Gaussian process regression specifies a distribution over functions in terms of the mean of the functions and their autocovariance. Similar to regression, an error model is used to represent noise in the data. For our Gaussian process regression model we used an affine function mean (2 parameters: slope and intercept), an autocovariance function with squared exponential decay (1 length parameter that determines the smoothness of the function) and an error model based on white Gaussian noise (1 variance parameter: Gaussian likelihood model). Using gpml code (available at Gaussianprocess.org/gpml) the 4 parameters of the model were adjusted to maximize the likelihood of the fit to the data, which we compared across models.
Mixture analysis.
We compared two models that can explain the increase in the average reflex gain as a function of the decision variable: (1) in a Mixture-of-states (mixture) model, the reflex gain on each trial undergoes a change from an uncommitted to a committed state. The average reflex gain, therefore, reflects a mixture of gains associated with either the uncommitted or committed reflex states. Accordingly, for each level of DV, the distribution of reflex gains is a mixture of two distributions—the distribution of gains for uncommitted reflexes (with a low mean, μu) and for committed reflexes (with a high mean, μc). The change in average gain is explained by a change in the mixing proportions, β and 1 − β, for uncommitted and committed distributions, respectively. As DV increases, the mixing proportions change monotonically from mainly uncommitted (β near 1) to mainly committed (β near 0); (2) in a Continuous flow model, the reflex gain on each trial undergoes continuous variation as the DV evolves. That is, the reflex gain is represented by a single distribution with a mean that increases monotonically with DV.
Although both models predict a mean reflex gain that increases with DV, the mixture-of-states model predicts that the gains at any level of DV come from a mixture of two distributions and this allows us to test between the models. Specifically, the mixture model predicts that for any subset of the reflex gain data, the variance of these gains should match the variance of a mixture of samples drawn from the uncommitted and committed gain distributions, with the mixing proportions chosen so that these samples have the same mean as the original data. Conversely, under the continuous flow model, the variance of the mixture need not be the same as the original dataset (and under reasonable assumptions, such as constant or signal-dependent noise on the gain, would be higher). We therefore compared Hypothesis 1 (H1): no difference between the variance of the observed data and resampled data to H2: observed data variance is less than the resampled data variance. H1 would support the mixture model, whereas H2 would support the continuous flow model. We used Monte Carlo and bootstrap methods to evaluate these possibilities (Efron, 1987).
We analyzed the data from each subject and each direction of choice separately for correct choices only. We generated two datasets to reflect the data coming from the uncommitted and committed reflex gain distributions (note that even if these datasets actually contain mixtures of the two distributions this does not affect or bias our analysis). For the uncommitted and committed datasets, we took the reflex gains from the 200 trials with the lowest and highest DV, respectively.
We generated a smoothed series of means and variance of the reflex gains based on a 200-point running average across increasing DV. For each mean, μ, of this smoothed series we calculated the mixing proportions β = (μc − μ)/(μc − μu) of the uncommitted states (mean μu) and (1 − β) of the committed states (mean μc), required to match this mean. The mixing parameter, β, determines how many data points to sample from each dataset. We sampled 200 data points (with replacement) in total with 200β from the uncommitted and 200(1 − β) from the committed dataset and calculated the variance of the associated reflex gains from this mixture dataset. We repeated this for all values of reflex gain in the smoothed series (that lay between μu and μc) and summed the variance across the series and across choice directions. We repeated this procedure 10,000 times to provide bootstrap samples of the summed variance for each subject. From the actual data we summed the true variance of the reflex gains in the same manner. This allows us to test whether the summed variance of the mixtures was significantly higher than the actual summed variance of the data (by comparing the actual summed variance to the 10,000 bootstrap samples).
Note that for the mixture-of-states model we do not model the time to switch from an uncommitted to committed state. With unambiguous information, the time to go from background to a fully tuned reflex is ∼40–50 ms (Yang et al., 2011). Given the temporal extent of our dataset, this would affect only ∼3% of trials.
In addition, we examined the distributions of G3 for evidence of bimodality, using Hartigan's dip test (Hartigan, 1985). For each subject, we used all choices (flexion and extension) on the 0% coherence condition and asked whether at each point in time the distribution of G3 is unimodal (as predicted by the drift-diffusion model) or bimodal. We used both short and long windows (±50 and ±200 ms of the time point) to measure the gain, so as to balance temporal resolution of the analysis against signal-to-noise.
Results
Subjects were required to decide between two possible directions of motion in a dynamic random-dot display and to indicate their choice by moving a handle to one of two targets (Fig. 1), requiring an elbow flexion or extension movement. We varied task difficulty by controlling both the strength (coherence) and duration of random dot motion. Subjects were instructed to indicate their direction decision as soon as the random dots were turned off, which occurred at an unpredictable time from motion onset. Simultaneous with motion offset, we applied a brief perturbation that extended the elbow, thereby eliciting a reflex response, which was quantified by EMG of forearm flexor and extensor muscles.
We first analyzed the subjects' behavioral accuracy and related this to a model of decision making. Across all trials, the random dot motion direction was 50% extension and 50% flexion, and the choices made by the subjects were 48% in the extension direction and 52% in the flexion direction. Decisions were more accurate on trials in which the subjects viewed stronger motion (Fig. 2A,B). Moreover, for each motion strength, the decision accuracy improved with longer viewing durations (Fig. 2C,D), consistent with previous findings (Kiani et al., 2008). These observations indicate that subjects' decisions were based on an accumulation of noisy evidence supplied by the motion stimulus via the visual cortex. Indeed the choices are explained by the sign of the decision variable (DV) from the one-parameter drift-diffusion model (Eq. 1, see Materials and Methods, Behavioral performance analysis): All k-values, which relate the drift rate to the coherence level (Table 1) were significantly different from zero (p < 0.0001), rejecting the null hypothesis that there are no effects of coherence level. This one-parameter drift-diffusion model furnishes the smooth curves in Figure 2A and C for a typical subject; the curves in Figure 2B and D are averages of the fits for each of the subjects.
Figure 2.

Performance on the random dot motion task. A, Proportion of correct responses, for one subject, plotted as a function of motion strength. Data are plotted separately for short, intermediate, and long viewing durations, as indicated. The curves depict a one-parameter diffusion model (Eq. 1) fit to the entire dataset. Error bars (SE of the proportions) are not visible as they all lie within the filled circles B, Group average for all subjects. Same conventions as A. Error bars are SEs across subject means and shaded areas show SEs across the individual subjects' curves from the fits of the diffusion model. C, Proportion of correct responses, for one subject, plotted as a function of viewing duration for the 5 nonzero coherence levels. Points are shown at the center of the time bins (∼75 trials per point). Error bars show SEs of the proportions, based on the binomial distribution. Colors represent different motion strengths, as indicated. The solid lines are fits of the drift-diffusion model. D, Group average for all subjects. Same conventions as C. Error bars are SEs across subject means and shaded areas show SEs across the individual subjects' curves from the fits of the diffusion model.
Table 1.
Parameter fit for the drift-diffusion model (k) to each subject's choice data with the 95% CI of the bootstrapped parameters
| Subject | k | EMG delay (ms) |
|---|---|---|
| 1 | 6.52 (5.98–7.11) | 157 |
| 2 | 11.52 (10.66–12.41) | 168 |
| 3 | 3.96 (3.44–4.62) | 158 |
| 4 | 8.75 (8.20–9.74) | 166 |
EMG delay estimates the lag between visual input and changes in EMG that arise due to sensorimotor and processing delays.
To assess the state of the motor system at the time of the perturbation, we recorded the EMG of elbow flexor and extensor muscles in response to the rapid extension of the elbow joint. These perturbations occurred at a random time from the onset of the random dot motion (truncated exponential distribution; 100–1500 ms, see Materials and Methods, Behavioral task), which coincided with the offset of the motion. Because of visual latencies, the perturbation is the first indication the subjects had that it was permissible to indicate their decision. In fact, visual information from the random dot motion is likely to be processed for another ∼200 ms after the dots turned off (Huk and Shadlen, 2005; Resulaj et al., 2009). Thus, the perturbation allowed us to assess the state of the motor system while the decision process was still benefiting from additional information.
Figure 3 shows a typical subject's averaged EMG signals elicited by the perturbation. For this example, we show data from correct trials for intermediate viewing durations in which the subject viewed weak or strong motion (left and right columns, respectively). The EMG signals show a classic short latency stretch reflex over the first 45 ms (Fig. 3, R1), which is evident mainly in the flexor muscles (Fig. 3, top row) and independent of motion direction. The EMG signals then begin to diverge in a manner that depends on the strength and direction of the random dot motion: flexor muscles (top row) show larger reflex responses when the motion supports a flexor response (blue trace), and extensor muscles (middle row) show larger responses when the motion supports an extensor response (red trace). The difference between flexor and extensor EMG signals (bottom row) suggest that the EMG signals accompanying the two directions of motion diverge earlier and more substantially for trials in which the dots moved more coherently (R2 and R3 time windows). On each trial, we used the integral of this difference to quantify the reflex gain (see Materials and Methods, Electromyographic signal analysis), in the three time-windows corresponding to short, intermediate, and long latency stretch reflexes (G1, G2, and G3, respectively).
Figure 3.
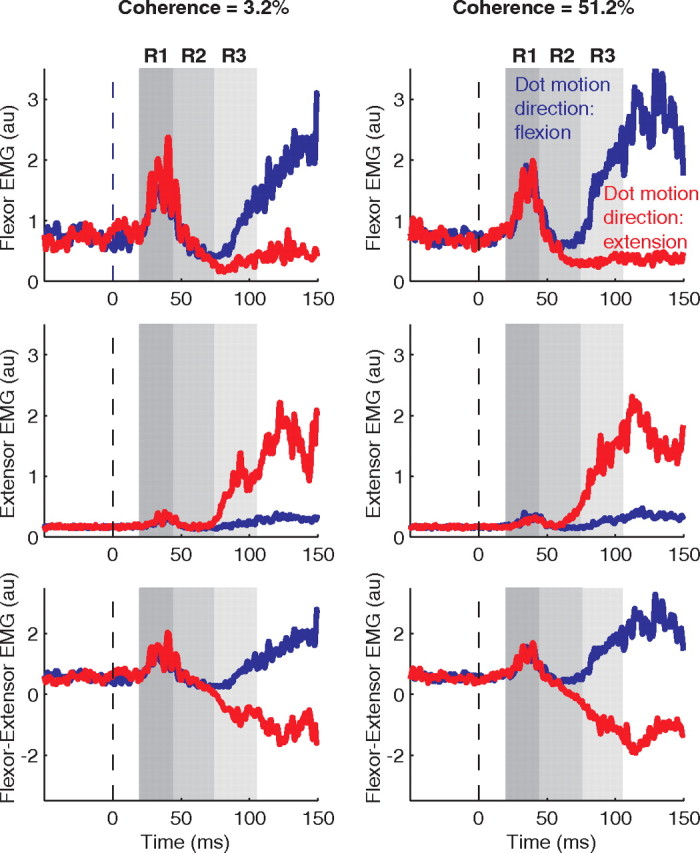
Examples of EMG records used to infer reflex gains. Averaged EMGs are shown for trials ending in correct choices for two motion strengths (3.2 and 51.2% coherence, left and right columns, respectively) at intermediate viewing durations (270–350 ms). Vertical dashed lines indicate the onset of the positional perturbation. Gray areas indicate the time windows of the reflex response: R1 (20–45 ms), R2 (45–75 ms), and R3 (75–105 ms). The direction of motion is indicated by color: blue traces for evidence in the flexion direction and red traces for evidence in the extension direction. For plotting purposes, the EMG traces for each muscle have been normalized so that the SD (across trials) of the mean EMGs (in the R3 window within a trial) is unity. The first row shows activity for the flexor muscles, the second for extensor muscles. The third row shows the time course of the difference between flexor and extensor muscles activity. This measure diverges for flexion and extension evidence with a divergence that is faster for the higher coherence level.
We first show that G2 and G3 are modulated by both the strength and duration of the motion stimulus and that G1 is independent of accumulated evidence. To do this we grouped together trials sharing the same motion strength and motion direction and supporting the same choice (i.e., correct choices only for nonzero coherence). Neither the strength nor the direction of motion influenced G1 [Fig. 4, left column for single subject (A) and group average (B)]. This is not surprising, as G1 has been shown not to modulate with task constraints or contextual changes on the short time scales used in our experiment (see Pruszynski et al., 2008 for discussion). In contrast, both G2 and G3 were clearly affected by the strength and direction of motion as well as the viewing duration. Importantly, the effect of motion strength was reliable even when incorporating the dominant effects of direction (i.e., choice) and duration (G2: p < 0.018; G3: p < 0.002 for all subjects). We also checked for systematic changes in muscle activation just before the perturbation and found no indication for time or coherence dependence (p > 0.25 for all subjects). This excludes the possibility that the observed changes in G2 and G3 are caused by increased coactivation before perturbation.
Figure 4.
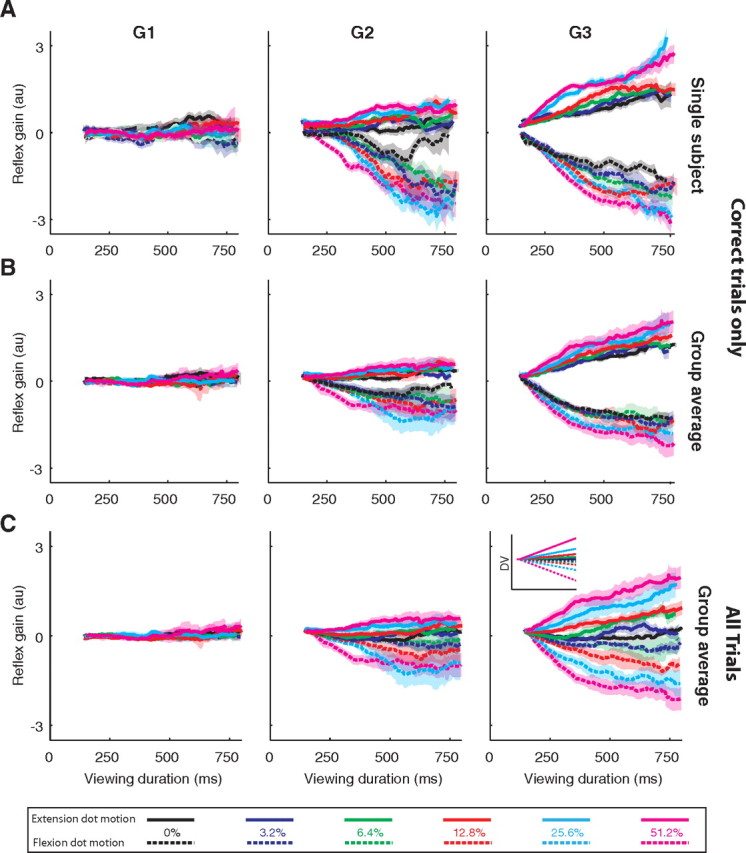
Effect of motion strength and viewing duration on reflex gains. The columns depict gains in the three time windows (G1, 20–45 ms; G2, 45–75 ms; G3, 75–105 ms). Data are grouped by motion strength and are plotted as a function of viewing duration (solid lines, dot motion supports extension evidence; dotted lines, dot motion supports flexion evidence). Curves are moving averages of the data (window = ±100 ms). A, Data for one subject with trials grouped by choice. Only correct choices are included for nonzero motion strengths. Shading indicates SEs across trials. B, Group average for trials grouped by choice. Same conventions as in A, except shading indicates SEs across the individual subject's means. C, Group average for all trials, correct and incorrect. Shading indicates SE across individual subject means. The inset in G3 shows a schematic of the expected DV as a function of time for different motion strengths and directions.
The observations in Figure 4A and B are important because they demonstrate that the reflex gains are affected in a graded manner even when averaging over data only from correct choices. Using data for correct choices ensures that the averages portrayed in Figure 4B do not reflect mixtures of reflex gains from trials leading to different actions. The grouping in Figure 4A and B and the related statistics thus provide a conservative test for a graded, motion-dependent change in the reflex. However, this grouping of trials obscures our central hypothesis that the reflex gains track the state of the DV. The evolving DV connects the stream of evidence from the visual system to either choice: it explains the proportion of correct and incorrect choices for the same motion stimulus (Fig. 2). To relate the evolving DV to the reflex gains measured, we must examine all trials associated with the same motion stimulus (direction and strength). The averaged reflex gains, now grouped across all trials sharing the same motion strength and direction, independent of choice (Fig. 4C), shows a qualitative correspondence with the time course of the expected decision variable (Fig. 4C, inset). We next attempt to quantify this relationship.
Our goal is to estimate the mean DV at the time of perturbation on each trial and relate this to the reflex gains on the same trial. From the one-parameter fits to the behavioral data we obtain a relation between coherence and the mean drift rate of the diffusion process which determines the average temporal evolution of the decision variable for the different motion strengths. We assume that the subject uses the full evidence stream (i.e., the viewing duration t) to make a decision, and from this model we can estimate the distribution of the DV on each trial using all the motion evidence. From diffusion, the DV has a Gaussian distribution with mean described by the lines in the inset of Figure 4C and variance proportional to t. Moreover, the subject's choice on each trial permits further refinement of this distribution, restricting values to one sign or the other. The expectation of this truncated Gaussian distribution, denoted DVchoice, is our estimate of the DV that gave rise to the choice on that trial. However, the perturbation probes the state of the DV some τ ms earlier, due to processing delays between visual input and any changes in EMG. We can estimate τ for each subject using fits to Equation 2 (see Materials and Methods, Electromyographic signal analysis). These estimates are displayed in Table 1 (range 157–168 ms). For each subject, we estimate the distribution of DV at the time of the perturbation by propagating the distribution of DVchoice (the truncated distribution, not its expectation) backwards in time to t − τ. According to our hypothesis, the mean of this distribution, DVpert, ought to explain the reflex gains we measured.
Figure 5A shows the reflex gains for the three time windows (G1-G3) as a function of DVpert. Both G2 and G3 clearly track DVpert and, as expected, G1 is independent of DVpert. This suggests that there is a continuous flow of accumulated evidence to the reflex gains and that the relation is almost linear. We compared the hypothesis that G3 is explained by DVpert to two alternative models (see Materials and Methods for details). The first alternative is that G3 reflects only the direction of random dot motion and the amount of viewing time up to the perturbation. This alternative was clearly inferior to the model based on the DVpert (smallest Δlog-likelihood across subjects = 380). This excludes the possibility that the measured G3 is simply associated with the flexion/extension evidence and waiting time. The DV adds substantial explanatory power.
The second alternative is that G3 reflects DVchoice, the decision variable leading to the decision on that trial, without propagation back in time to the moment of the perturbation. This model is much better than the first alternative, but it has weaker explanatory power than our main hypothesis (smallest Δlog-likelihood across subjects = 30). This implies that the extra machinery required to estimate the DV at the time of the perturbation was warranted. From these analyses, we conclude that the evolving DV plays an essential role in explaining the reflex gains, and its state at the time of the perturbation is more informative than its state at the end of the trial.
The link between DV and reflex gain is further strengthened by examining the variance of G3 as a function of elapsed time during decision formation. According to the diffusion model, the variance of DV increases linearly as a function of time. Since G3 is monotonically related to the DV, we would expect to observe a monotonic rise in its variance as well. Figure 6 shows the variance of G3 as a function of stimulus duration on the 0% coherence trials. The variance increases approximately linearly for all four subjects, in accordance with the diffusion model.
Figure 6.

Variance of G3 reflex gain as a function of viewing duration. The variance of G3 was calculated over a sliding window of 250 ms for the 0% coherence trials. Data are plotted separately for the four subjects.
The gradual changes seen in Figure 5A could arise in two different ways—through a continuous flow process or a mixture-of-states process. For a continuous flow process, the reflex gain would reflect the DV within the trial, varying smoothly between a low gain and the value attained at the time of the perturbations. Alternatively, in a mixture-of-states process, rather than track DV, the reflex gain would only take on one of two states, that is, either an uncommitted state with low gain or a committed state with high gain. Therefore, under this model, the gradual change in Figure 5A would result from averaging across trials in which subjects were either in an uncommitted low-gain state or a committed high-gain state.
To evaluate this possibility, we performed a mixture analysis (see Materials and Methods, Mixture analysis). We reconstructed reflex gain datasets for intermediate values of DV by mixing samples from low (uncommitted) and high (committed) values of DV. We mixed these in the correct proportion to match the mean reflex gain at the intermediate value of DV. Under a mixture-of-states process, this reconstructed dataset would have the same variance as the actual data, whereas for the continuous flow model this reconstructed dataset would have higher variance than the data (see Materials and Methods, Mixture analysis). We found that the variance was significantly higher (p < 0.001 for all subjects) in the reconstructed datasets, supporting the continuous flow model. This conclusion is further supported by examination of the distribution of G3 over sequential time-windows on the 0% coherence trials, which exhibit no evidence for bimodality (p > 0.05 across all subjects and all time-windows; Hartigan's dip test).
A natural question is why the motor system would modulate the state of its reflex gains during decision formation before an action is required. One possible answer is preparation. Feedback gains, such as long latency reflexes, are key parameters in computational models of sensorimotor control (Todorov and Jordan, 2002; Scott, 2004; Todorov, 2004; Pruszynski et al., 2008). Setting them ahead of time might support greater efficiency of the ensuing movement. However, it is possible that, although we observe reflex modulation, it may be too small to induce an observable change in the kinematics. To test this, we calculated the distance moved toward the choice target at three time points after the perturbation onset (see Materials and Methods, Calculation of decision variable on a single trial). Figure 5B shows that the distance moved increases with the DVpert even as early as 125 ms after perturbation onset. A similar relationship is evident between G3 and distance (data not shown). Therefore, higher DVpert correlates with a more rapid approach to the choice target, suggesting that setting the reflex gains before movement is indeed beneficial for generating rapid movements.
Control experiment
In the control experiment we examined voluntary responses to tactile input for trials with maximal information, that is, with long viewing durations and high coherence. Figure 7 plots the difference in EMG between flexion and extension evidence for voluntary trials (blue) and for our standard perturbation trials (red) with the same durations and coherences. We determined the earliest EMG responses in the control trials and found a median response delay of 132 ms and <5% of trials showing a response earlier than 105 ms after perturbation onset. Less than 1% of trials showed EMG responses earlier than 90 ms after perturbation onset. We conclude that voluntary responses have no measurable contribution to our G2 (epoch ending at 75 ms) and minimal contribution to G3. Importantly, this analysis demonstrates that the quantities we analyze in our study reflect true involuntary reflexes.
Figure 7.

Comparison of voluntary and reflex muscular activity. The voluntary activity is in response to a tactile input that does not elicit a reflex response. The difference in EMG between flexion and extension evidence is plotted for voluntary trials (blue) and for our standard perturbation trials (red) with the same durations (>0.8 s) and coherences (51.2%). For the standard perturbation trials the trace starts to diverge from zero at ∼50 ms, whereas for the voluntary trials this divergence starts at ∼90 ms. This indicates that in standard perturbation trials there is activity before the voluntary response.
Discussion
By probing the state of the motor system with a sudden perturbation to the arm, we have shown that reflex gains adjust dynamically to track the evolution of a decision as it is being formed. Even for trials ending in the same (correct) decision, the medium- and long-latency reflex gains (G2 and G3) are modulated in a graded manner depending on both the strength and the viewing duration of the random dot motion stimulus (Fig. 4). It had been shown previously that G2 and G3 can be modulated in preparation of movements that differ in magnitude and speed (Pruszynski et al., 2008). The novel extension pursued in our study is to link these gains to the process of decision formation.
To connect the reflex gains to the decision process we exploited a virtue of the random dot motion task: decision accuracy can be explained quantitatively by the accumulated evidence, termed the decision variable, in support of one or the other alternative. This single decision variable represents the integral of the noisy motion evidence and is thus affected by both motion coherence and viewing duration (Heekeren et al., 2004; Bogacz et al., 2006; Gold and Shadlen, 2007; Heekeren et al., 2008; Donner et al., 2009). In reaction time versions of the random dot motion task, the choice accuracy and reaction time are explained by a drift-diffusion model in which the DV reaches a positive or negative bound, which terminates the process and determines the choice outcome (Gold and Shadlen, 2002, 2007; Smith and Ratcliff, 2004). In our task, subjects were cued when to move and we therefore used a simplified (one-parameter) diffusion model that assumes accumulation of all evidence provided by the display. The decision is simply based on the sign of the DV at the end of the trial.
The drift-diffusion model explains the choice data for each of the subjects (Fig. 2) and allows us to infer the state of the decision variable—its probability distribution—at the time of the perturbation on each trial. The evolution of the expected value of the DV demonstrates a striking correspondence to the modulation of the G2 and G3 (but not G1) reflex gains (Fig. 5A). These gains, therefore, reflect the evolving decision variable that ultimately supports the subject's choice behavior. Importantly, they do not simply reflect the outcome of the decision, but are instead privy to the brain's deliberations as a decision is being formed. In our study we asked the subjects to respond to the direction of dot motion with the congruent direction of hand movement. In monkeys, when the directions of motion and motor responses are incongruent, such that leftward motion requires a rightward eye movement, signatures of the DV remain apparent in the motor system, but now obey the new logic—support for whatever the new associated direction is (Gold and Shadlen, 2003). We suspect the same would be true for humans.
The novelty in our design and analysis is that it allows us to measure noninvasively the influence of an evolving decision variable in a critical time frame of decision formation. However, in our design, subjects could have made an early decision and been simply in a holding state awaiting the perturbation. Our analyses argue against this based on two observations: (1) The data are better described by a continuously changing gain than a mixture (across trials) of the gains associated with uncommitted and committed (“holding”) states; (2) the gains for G2 and G3 are diverging even with the shorter stimulus durations (Fig. 4). Therefore, even for small values of DV (e.g., early time points, low coherence), the reflex gains are sensitive to changes in DV (Fig. 5A).
In the current study we have measured the reflex gains and show that there is supraspinal modulation of their gain during decision making, reflecting changes in excitability of the response pathways. The rationale for studying the reflex gains in relation to decision making is that such feedback gains are key control parameters within the framework of optimal feedback control (OFC). This framework unifies diverse motor functions, such as planning, on-line control, coordination, and the interaction of effort and noise (for reviews see Scott, 2004; Todorov, 2004; Diedrichsen et al., 2010). OFC proposes that the sensorimotor system acts to minimize a cost function that is usually a combination of accuracy and effort. To achieve this, the nervous system implements feedback controllers with adjustable time-varying gains. Normally, these feedback gains contribute to establishing the smooth movement trajectories that transport the hand from rest to target, for example. However, it has been shown that also before movement these feedback gains, i.e., intermediate and long latency responses, are modulated to optimize task performance (Kurtzer et al., 2008; Pruszynski et al., 2008). We extended this observation by showing that the same feedback gains are affected by an evolving cognitive process of decision making leading to movement selection. Importantly, reflex gains were not modulated by the outcome of a decision (e.g., a mixture of uncommitted and committed states) but instead track the accumulating evidence in a graded fashion.
From an evolutionary perspective, it is perhaps unsurprising that information about a stimulus might affect structures in the brain that control the motor system that will ultimately act upon that information. Yet, according to traditional accounts of decision making, the process of deciding should complete before the motor system is brought into play (Donders 1868/1969; Sternberg, 1969). Such an architecture, termed sequential flow, seems consistent with the common sense notion that decisions are about propositions or categories, independent of what, if anything, we will do as a consequence (Freedman and Assad, 2011). A central executive or other high level processor (Sigman and Dehaene, 2005) makes the decision and communicates the answer to the appropriate motor system if and when an action is required. On this view, the motor system is informed of the decision outcome, not partial evidence.
To the contrary, our findings suggest that there is continuous flow from the decision making process to set feedback gains in the motor system. This is consistent with neurophysiological studies in nonhuman primates that use microstimulation to elicit an eye movement during the decision making process (Kustov and Robinson, 1996; Gold and Shadlen, 2000, 2003; Horwitz et al., 2004; Connolly et al., 2009). Without the benefit of the present findings, the continuous flow exhibited by nonhuman primates on this task might be interpreted as evidence that such species lack a central executive. Instead, we provide evidence that the human brain also supplies the motor system with partial evidence to prepare circuitry for an eventual act.
Complementary evidence in support of continuous flow in humans comes from the analysis of movements of a computer mouse during a lexical decision task (Spivey et al., 2005) and from analyses of sequences of movements suggesting concurrent processing of visual information in a variety of tasks (Resulaj et al., 2009; Song and Nakayama, 2009; Purcell et al., 2010). These and other findings support the idea that motor preparation incorporates not just readiness to act but qualitative information leading to that action (Coles et al., 1985; Michelet et al., 2010). The present result shows that this information is not restricted to anticipation (Tanji and Evarts, 1976; Miller et al., 1992; Crammond and Kalaska, 2000) or certainty (Bastian et al., 2003), but incorporates a rich representation of a decision variable, that is, the accumulation of evidence leading to a choice.
Our findings do not imply that decisions are always tied to actions. Even in a task like ours, decisions do not feel like they are about an action but about a property of the visual stimulus, suggesting the presence of some higher order decision process. Nonetheless, the motor system receives a continuous flow of evidence as the decision evolves, presumably because there is some benefit for preparation. That said, we often make abstract decisions about propositions independent of what, if anything, we will do as a consequence. In such cases, the motor system is unlikely to receive partial information about the evolving decision (Gold and Shadlen, 2003). However, even here it seems likely that partial evidence will flow continuously, not to the effectors of action, but to the implementers of subsequent decisions (Cisek, 2007; Shadlen et al., 2008).
The dividends of continuous flow include readiness and computational savings when an action is required. But we suspect a deeper connection between the brain's apparatus for evaluating evidence and the control of motor function. Both decision making and motor control require acting in real time on streams of noisy evidence. Thus, both rely on inference, termination rules, time constraints, and predicted costs—operations that are best understood with the tools of probability theory (Knill and Pouget, 2004; Körding and Wolpert, 2006; Tenenbaum et al., 2006; Anderson, 2011). While we have shown flow from the decision-making process to the motor system, we expect elements of the motor task, such as the range of possible actions or the value effort/costs associated with them, to influence the settings of the decision-making process, such as the tradeoff between decision speed and accuracy. Therefore, we suspect that the flow demonstrated in our experiment may be part of a larger bidirectional interplay between the brain processes that underlie decision making and motor control.
Footnotes
This work was supported by the Wellcome Trust, the Human Frontiers Science Program, Netherlands Organisation for Scientific Research (451-10-017), the Howard Hughes Medical Institute, National Eye Institute (EY11378), and the Center for Research Resources (RR00166). We thank Carl Rasmussen and Andrew Pruszynski for their valuable input and James Ingram for technical assistance.
References
- Akazawa K, Milner TE, Stein RB. Modulation of reflex EMG and stiffness in response to stretch of human finger muscle. J Neurophysiol. 1983;49:16–27. doi: 10.1152/jn.1983.49.1.16. [DOI] [PubMed] [Google Scholar]
- Anderson B. There is no such thing as attention. Front Psychol. 2011;2:246. doi: 10.3389/fpsyg.2011.00246. [DOI] [PMC free article] [PubMed] [Google Scholar]
- Bastian A, Schöner G, Riehle A. Preshaping and continuous evolution of motor cortical representations during movement preparation. Eur J Neurosci. 2003;18:2047–2058. doi: 10.1046/j.1460-9568.2003.02906.x. [DOI] [PubMed] [Google Scholar]
- Bichot NP, Chenchal Rao S, Schall JD. Continuous processing in macaque frontal cortex during visual search. Neuropsychologia. 2001;39:972–982. doi: 10.1016/s0028-3932(01)00022-7. [DOI] [PubMed] [Google Scholar]
- Bogacz R, Brown E, Moehlis J, Holmes P, Cohen JD. The physics of optimal decision making: a formal analysis of models of performance in two-alternative forced-choice tasks. Psychol Rev. 2006;113:700–765. doi: 10.1037/0033-295X.113.4.700. [DOI] [PubMed] [Google Scholar]
- Britten KH, Shadlen MN, Newsome WT, Movshon JA. The analysis of visual motion: a comparison of neuronal and psychophysical performance. J Neurosci. 1992;12:4745–4765. doi: 10.1523/JNEUROSCI.12-12-04745.1992. [DOI] [PMC free article] [PubMed] [Google Scholar]
- Carter RR, Crago PE, Gorman PH. Nonlinear stretch reflex interaction during cocontraction. J Neurophysiol. 1993;69:943–952. doi: 10.1152/jn.1993.69.3.943. [DOI] [PubMed] [Google Scholar]
- Cisek P. Cortical mechanisms of action selection: the affordance competition hypothesis. Philos Trans R Soc Lond B Biol Sci. 2007;362:1585–1599. doi: 10.1098/rstb.2007.2054. [DOI] [PMC free article] [PubMed] [Google Scholar]
- Cisek P, Kalaska JF. Simultaneous encoding of multiple potential reach directions in dorsal premotor cortex. J Neurophysiol. 2002;87:1149–1154. doi: 10.1152/jn.00443.2001. [DOI] [PubMed] [Google Scholar]
- Coles MG, Gratton G, Bashore TR, Eriksen CW, Donchin E. A psychophysiological investigation of the continuous flow model of human information processing. J Exp Psychol Hum Percept Perform. 1985;11:529–553. doi: 10.1037//0096-1523.11.5.529. [DOI] [PubMed] [Google Scholar]
- Connolly PM, Bennur S, Gold JI. Correlates of perceptual learning in an oculomotor decision variable. J Neurosci. 2009;29:2136–2150. doi: 10.1523/JNEUROSCI.3962-08.2009. [DOI] [PMC free article] [PubMed] [Google Scholar]
- Crammond DJ, Kalaska JF. Prior information in motor and premotor cortex: activity during the delay period and effect on pre-movement activity. J Neurophysiol. 2000;84:986–1005. doi: 10.1152/jn.2000.84.2.986. [DOI] [PubMed] [Google Scholar]
- Diedrichsen J, Shadmehr R, Ivry RB. The coordination of movement: optimal feedback control and beyond. Trends Cogn Sci. 2010;14:31–39. doi: 10.1016/j.tics.2009.11.004. [DOI] [PMC free article] [PubMed] [Google Scholar]
- Donders F. On the speed of mental processes. Acta Psychologica. 1969;30:412–431. doi: 10.1016/0001-6918(69)90065-1. [Translation of: Die Schnelligkeit Psychischer Processe, first published in 1868.] [DOI] [PubMed] [Google Scholar]
- Donner TH, Siegel M, Fries P, Engel AK. Buildup of choice-predictive activity in human motor cortex during perceptual decision making. Curr Biol. 2009;19:1581–1585. doi: 10.1016/j.cub.2009.07.066. [DOI] [PubMed] [Google Scholar]
- Efron B. The jackknife, the bootstrap, and other resampling plans (CBMS-NSF regional conference series in applied mathematics) Philadelphia: Society for Industrial Mathematics; 1987. [Google Scholar]
- Eriksen CW, Schultz DW. Information processing in visual search: a continuous flow conception and experimental results. Percept Psychophys. 1979;25:249–263. doi: 10.3758/bf03198804. [DOI] [PubMed] [Google Scholar]
- Evarts EV, Tanji J. Reflex and intended responses in motor cortex pyramidal tract neurons of monkey. J Neurophysiol. 1976;39:1069–1080. doi: 10.1152/jn.1976.39.5.1069. [DOI] [PubMed] [Google Scholar]
- Freedman DJ, Assad JA. A proposed common neural mechanism for categorization and perceptual decisions. Nat Neurosci. 2011;14:143–146. doi: 10.1038/nn.2740. [DOI] [PubMed] [Google Scholar]
- Glimcher PW, Fehr E, Rangel A, Camerer C, Poldrack RA, editors. Neuroeconomics: decision making and the brain. Waltham, MA: Academic; 2008. [Google Scholar]
- Gold JI, Shadlen MN. Representation of a perceptual decision in developing oculomotor commands. Nature. 2000;404:390–394. doi: 10.1038/35006062. [DOI] [PubMed] [Google Scholar]
- Gold JI, Shadlen MN. Neural computations that underlie decisions about sensory stimuli. Trends Cogn Sci. 2001;5:10–16. doi: 10.1016/s1364-6613(00)01567-9. [DOI] [PubMed] [Google Scholar]
- Gold JI, Shadlen MN. Banburismus and the brain: decoding the relationship between sensory stimuli, decisions, and reward. Neuron. 2002;36:299–308. doi: 10.1016/s0896-6273(02)00971-6. [DOI] [PubMed] [Google Scholar]
- Gold JI, Shadlen MN. The influence of behavioral context on the representation of a perceptual decision in developing oculomotor commands. J Neurosci. 2003;23:632–651. doi: 10.1523/JNEUROSCI.23-02-00632.2003. [DOI] [PMC free article] [PubMed] [Google Scholar]
- Gold JI, Shadlen MN. The neural basis of decision making. Annu Rev Neurosci. 2007;30:535–574. doi: 10.1146/annurev.neuro.29.051605.113038. [DOI] [PubMed] [Google Scholar]
- Hartigan JA, Hartigan PM. The dip test of unimodality. Ann Stat. 1985;13:70–84. [Google Scholar]
- Heekeren HR, Marrett S, Bandettini PA, Ungerleider LG. A general mechanism for perceptual decision-making in the human brain. Nature. 2004;431:859–862. doi: 10.1038/nature02966. [DOI] [PubMed] [Google Scholar]
- Heekeren HR, Marrett S, Ungerleider LG. The neural systems that mediate human perceptual decision making. Nat Rev Neurosci. 2008;9:467–479. doi: 10.1038/nrn2374. [DOI] [PubMed] [Google Scholar]
- Horwitz GD, Batista AP, Newsome WT. Representation of an abstract perceptual decision in macaque superior colliculus. J Neurophysiol. 2004;91:2281–2296. doi: 10.1152/jn.00872.2003. [DOI] [PubMed] [Google Scholar]
- Howard IS, Ingram JN, Wolpert DM. A modular planar robotic manipulandum with end-point torque control. J Neurosci Methods. 2009;181:199–211. doi: 10.1016/j.jneumeth.2009.05.005. [DOI] [PubMed] [Google Scholar]
- Huk AC, Shadlen MN. Neural activity in macaque parietal cortex reflects temporal integration of visual motion signals during perceptual decision making. J Neurosci. 2005;25:10420–10436. doi: 10.1523/JNEUROSCI.4684-04.2005. [DOI] [PMC free article] [PubMed] [Google Scholar]
- Kiani R, Hanks TD, Shadlen MN. Bounded integration in parietal cortex underlies decisions even when viewing duration is dictated by the environment. J Neurosci. 2008;28:3017–3029. doi: 10.1523/JNEUROSCI.4761-07.2008. [DOI] [PMC free article] [PubMed] [Google Scholar]
- Knill DC, Pouget A. The Bayesian brain: the role of uncertainty in neural coding and computation. Trends Neurosci. 2004;27:712–719. doi: 10.1016/j.tins.2004.10.007. [DOI] [PubMed] [Google Scholar]
- Kolmogoroff A. Über die analytischen methoden in der wahrscheinlichkeitsrechnung. Math Ann. 1931;104:415–458. [Google Scholar]
- Körding KP, Wolpert DM. Bayesian decision theory in sensorimotor control. Trends Cogn Sci. 2006;10:319–326. doi: 10.1016/j.tics.2006.05.003. [DOI] [PubMed] [Google Scholar]
- Kurtzer IL, Pruszynski JA, Scott SH. Long-latency reflexes of the human arm reflect an internal model of limb dynamics. Curr Biol. 2008;18:449–453. doi: 10.1016/j.cub.2008.02.053. [DOI] [PubMed] [Google Scholar]
- Kustov AA, Robinson DL. Shared neural control of attentional shifts and eye movements. Nature. 1996;384:74–77. doi: 10.1038/384074a0. [DOI] [PubMed] [Google Scholar]
- Lewis GN, MacKinnon CD, Trumbower R, Perreault EJ. Co-contraction modifies the stretch reflex elicited in muscles shortened by a joint perturbation. Exp Brain Res. 2010;207:39–48. doi: 10.1007/s00221-010-2426-9. [DOI] [PMC free article] [PubMed] [Google Scholar]
- Luce D. Response times: their role in inferring elementary mental organization. New York: Oxford UP; 1986. [Google Scholar]
- Michelet T, Duncan GH, Cisek P. Response competition in the primary motor cortex: corticospinal excitability reflects response replacement during simple decisions. J Neurophysiol. 2010;104:119–127. doi: 10.1152/jn.00819.2009. [DOI] [PubMed] [Google Scholar]
- Miller J, Riehle A, Requin J. Effects of preliminary perceptual output on neuronal activity of the primary motor cortex. J Exp Psychol Hum Percept Perform. 1992;18:1121–1138. doi: 10.1037//0096-1523.18.4.1121. [DOI] [PubMed] [Google Scholar]
- Oldfield RC. The assessment and analysis of handedness: the Edinburgh inventory. Neuropsychologia. 1971;9:97–113. doi: 10.1016/0028-3932(71)90067-4. [DOI] [PubMed] [Google Scholar]
- Pruszynski JA, Kurtzer I, Scott SH. Rapid motor responses are appropriately tuned to the metrics of a visuospatial task. J Neurophysiol. 2008;100:224–238. doi: 10.1152/jn.90262.2008. [DOI] [PubMed] [Google Scholar]
- Pruszynski JA, Kurtzer I, Lillicrap TP, Scott SH. Temporal evolution of “automatic gain-scaling.”. J Neurophysiol. 2009;102:992–1003. doi: 10.1152/jn.00085.2009. [DOI] [PMC free article] [PubMed] [Google Scholar]
- Purcell BA, Heitz RP, Cohen JY, Schall JD, Logan GD, Palmeri TJ. Neurally constrained modeling of perceptual decision making. Psychol Rev. 2010;117:1113–1143. doi: 10.1037/a0020311. [DOI] [PMC free article] [PubMed] [Google Scholar]
- Rasmussen C, Nickisch H. Gaussian processes for machine learning (GPML) toolbox. J Mach Learn Res. 2010;11:3011–3015. [Google Scholar]
- Resulaj A, Kiani R, Wolpert DM, Shadlen MN. Changes of mind in decision-making. Nature. 2009;461:263–266. doi: 10.1038/nature08275. [DOI] [PMC free article] [PubMed] [Google Scholar]
- Riehle A, Requin J. Monkey primary motor and premotor cortex: single-cell activity related to prior information about direction and extent of an intended movement. J Neurophysiol. 1989;61:534–549. doi: 10.1152/jn.1989.61.3.534. [DOI] [PubMed] [Google Scholar]
- Schall JD. Neural basis of deciding, choosing and acting. Nat Rev Neurosci. 2001;2:33–42. doi: 10.1038/35049054. [DOI] [PubMed] [Google Scholar]
- Scott SH. Optimal feedback control and the neural basis of volitional motor control. Nat Rev Neurosci. 2004;5:532–546. doi: 10.1038/nrn1427. [DOI] [PubMed] [Google Scholar]
- Shadlen M, Kiani R, Hanks T, Churchland A. Neurobiology of decision making: an intentional framework. In: Engel C, Singer W, editors. Better than conscious? Decision making, the human mind, and implications for institutions. Cambridge, MA: MIT; 2008. pp. 71–101. [Google Scholar]
- Sigman M, Dehaene S. Parsing a cognitive task: a characterization of the mind's bottleneck. PLoS Biol. 2005;3:e37. doi: 10.1371/journal.pbio.0030037. [DOI] [PMC free article] [PubMed] [Google Scholar]
- Smith PL, Ratcliff R. Psychology and neurobiology of simple decisions. Trends Neurosci. 2004;27:161–168. doi: 10.1016/j.tins.2004.01.006. [DOI] [PubMed] [Google Scholar]
- Song JH, Nakayama K. Hidden cognitive states revealed in choice reaching tasks. Trends Cogn Sci. 2009;13:360–366. doi: 10.1016/j.tics.2009.04.009. [DOI] [PubMed] [Google Scholar]
- Spivey MJ, Grosjean M, Knoblich G. Continuous attraction toward phonological competitors. Proc Natl Acad Sci U S A. 2005;102:10393–10398. doi: 10.1073/pnas.0503903102. [DOI] [PMC free article] [PubMed] [Google Scholar]
- Sternberg S. The discovery of processing stages: extensions of Donders' method. Acta Psychologica. 1969;30:276–315. [Google Scholar]
- Sugrue LP, Corrado GS, Newsome WT. Choosing the greater of two goods: neural currencies for valuation and decision making. Nat Rev Neurosci. 2005;6:363–375. doi: 10.1038/nrn1666. [DOI] [PubMed] [Google Scholar]
- Tanji J, Evarts EV. Anticipatory activity of motor cortex neurons in relation to direction of an intended movement. J Neurophysiol. 1976;39:1062–1068. doi: 10.1152/jn.1976.39.5.1062. [DOI] [PubMed] [Google Scholar]
- Tenenbaum JB, Griffiths TL, Kemp C. Theory-based Bayesian models of inductive learning and reasoning. Trends Cogn Sci. 2006;10:309–318. doi: 10.1016/j.tics.2006.05.009. [DOI] [PubMed] [Google Scholar]
- Todorov E. Optimality principles in sensorimotor control. Nat Neurosci. 2004;7:907–915. doi: 10.1038/nn1309. [DOI] [PMC free article] [PubMed] [Google Scholar]
- Todorov E, Jordan MI. Optimal feedback control as a theory of motor coordination. Nat Neurosci. 2002;5:1226–1235. doi: 10.1038/nn963. [DOI] [PubMed] [Google Scholar]
- Yang L, Michaels JA, Pruszynski JA, Scott SH. Rapid motor responses quickly integrate visuospatial task constraints. Exp Brain Res. 2011;211:231–242. doi: 10.1007/s00221-011-2674-3. [DOI] [PubMed] [Google Scholar]