Abstract
An optical-based motion sensing system has been developed for real-time sensing of instrument motion in micromanipulation. The main components of the system consist of a pair of position sensitive detectors (PSD), lenses, an infrared (IR) diode that illuminates the workspace of the system, a non-reflective intraocular shaft, and a white reflective ball attached at the end of the shaft. The system calculates 3D displacement of the ball inside the workspace using the centroid position of the IR rays that are reflected from the ball and strike the PSDs. In order to eliminate inherent nonlinearity of the system, calibration using a feedforward neural network is proposed and presented. Handling of different ambient light and environment light conditions not to affect the system accuracy is described. Analyses of the whole optical system and effect of instrument orientation on the system accuracy are presented. Sensing resolution, dynamic accuracies at a few different frequencies, and static accuracies at a few different orientations of the instrument are reported. The system and the analyses are useful in assessing performance of hand-held microsurgical instruments and operator performance in micromanipulation tasks.
Keywords: Position Sensitive Detectors, Feedforward Neural Network, Micromanipulation, Microscale Sensing
1. Introduction
Vitreoretinal microsurgery and some cell micromanipulation tasks are fields that require very high tool positioning accuracy. In vitreoretinal microsurgery, there is some degree of consensus among vitreoretinal microsurgeons that instrument-tip positioning accuracy of 10 μm is desired [1] whilst cell micromanipulation tasks require accuracy ranging from a few tens of micrometers to nanometers depending on the applications.
Many involuntary and inadvertent components are present in normal human hand movement. These include physiological tremor [2], jerk [3] and low frequency drift [4]. These undesirable components have limited manipulation accuracy of surgeons in microsurgery, and cause certain types of procedures to be generally infeasible, such as retinal vein cannulation and arteriovenous sheathotomy [5]. Several types of engineered accuracy enhancement devices have been or are being developed in order to improve manipulation accuracy of microsurgeons, including telerobotic systems [6], the “steady-hand” robotic system [7], and fully hand-held active tremor canceling instruments [8][9][10][11]. To better engineer and evaluate performance of such systems, thorough knowledge of these components present in microsurgeons during microsurgical operations is required.
Several one-dimensional (1-D) studies of motion have been reported for microsurgeons [2][12] and medical students [13]. Some studies have examined only physiological tremor [2][13], the roughly sinusoidal component of involuntary motion. Others have examined also the general motion of surgeons [4][12]. Studies of micromanipulation tasks of microsurgeons in 3D are rare in the literature. That is partly due to the fact that commercially available motion tracking systems such as Optotrak, Aurora (Northern Digital, Waterloo, Canada) [14][15], Isotrack II (Polhemus, Colchester, Vt.), miniBIRD (Ascension Technology Corp., Burlington, Vt.) [16], Fastrak (Polhemus, Colchester, Vt.) [17][18], and the HiBall Tracking System [19] are not suitable for such studies since they are bulky or else do not provide adequate accuracy and resolution for micro scale motion.
To address the above issues, motion sensing systems which can sense microsurgical instrument motion in micro scale are developed based on a passive tracking method [20][21][22], or an active tracking method [23][24][25]. Although systems based on active tracking method (active tracking systems) can provide high resolution due to high intensity light reception at the sensors, the light sources have to be fixed on the instrument to be tracked, requiring electronics and wires on the instrument. Additional weight and clumsiness due to the need to have electronics, wires, and the light sources make it non-ideal for studies of micromanipulation tasks since instruments which are heavy or clumsy alter natural hand dynamics [26] and distract the surgeons.
On the other hand, systems based on passive tracking method (passive tracking systems) are best suited for studies of micromanipulation tasks since they require only a reflective marker. Therefore, all the mentioned issues present in systems based on active tracking method are eliminated although they suffer from poor resolution due to relatively lower light intensity received at the sensors. In all these systems, Position Sensitive Detectors (PSDs) and lenses form the main components whereby the accuracy is limited by nonlinearity inherent in PSDs and distortion (i.e., nonlinearity) introduced by the optical system.
It is well known that lens introduces distortion. PSD also introduces distortion effects that vary from sensor to sensor reducing accuracy significantly at micron and submicron levels. The overall nonlinearity is the combination of distortion effects from the lenses and PSDs. Passive tracking systems described in [20][21] do not take care of nonlinearity and ambient light effects. Accuracies of the systems at different tilt orientations of the instrument are not investigated nor described although they can be affected by different tilt orientations due to incomplete absorption of IR light by the non-reflective instrument shaft. Accuracy is poorer without calibration because of the imperfect alignment and assembly of the components. If accuracy and resolution can be improved by eliminating inherent nonlinearity and increasing signal to noise ratio respectively, the systems can be suitable systems for the assessment and microsurgical trainings of surgeons, and as accurate ground truth systems to evaluate accuracy enhancement devices [6][7][8][9][10][11].
In this paper, development and analysis of the whole optical system based on the passive tracking method are described. Calibration using a neural network to reduce nonlinearity of the measurement is proposed, and described. Measures to improve sensing resolution of the system so that it has adequate sensing resolution for micromanipulation tasks in spite of the nature of a passive tracking method are presented. Analysis of the effect of microsurgical instrument orientation on the system accuracy is presented. Sensing resolution, dynamic accuracies, and static accuracies at different orientation of the instrument are reported.
2. System Description
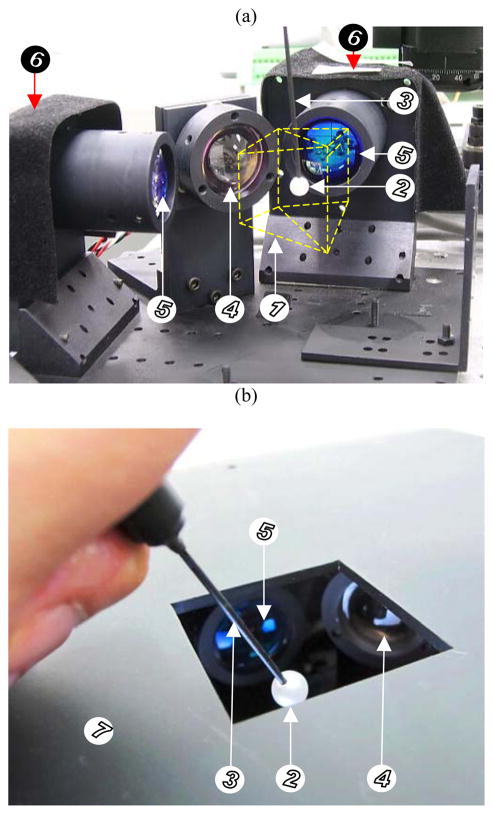
In this section, design and development of the optical micro motion sensing system (M2S2) is first described. Then, measures to increase signal-to-noise ratio to improve system resolution are presented. The main components of the system are two PSD modules (DL400-7PCBA3, Pacific Silicon Sensor Inc, USA), three lenses, an IR diode with its switching control circuit, a white reflective ball, and a non-reflective shaft as shown in Figure 1 and Figure 2. The two PSD modules are placed orthogonally to each other. PSDs are chosen among other sensors such as CCD, and CMOS since the PSDs detect the centroids of the IR rays striking their surfaces; thereby they work optimally with out-of-focus sensing/imagery. Another reason is that they offer adequate high position resolution and fast response [27] at an affordable cost.
Figure 1.
Pictures of Micro Motion Sensing System (M2S2) (a) without the hand-support cover, and (b) with the hand-support cover, showing (1) the location of the workspace (within the yellow dash line), (2) the reflective ball, (3) non-reflective instrument shaft, (4) the aspheric lens, (5) bi-convex lenses, (6) the PSD modules placed inside light absorption cloths, and (7) the hand-support cover.
Figure 2.
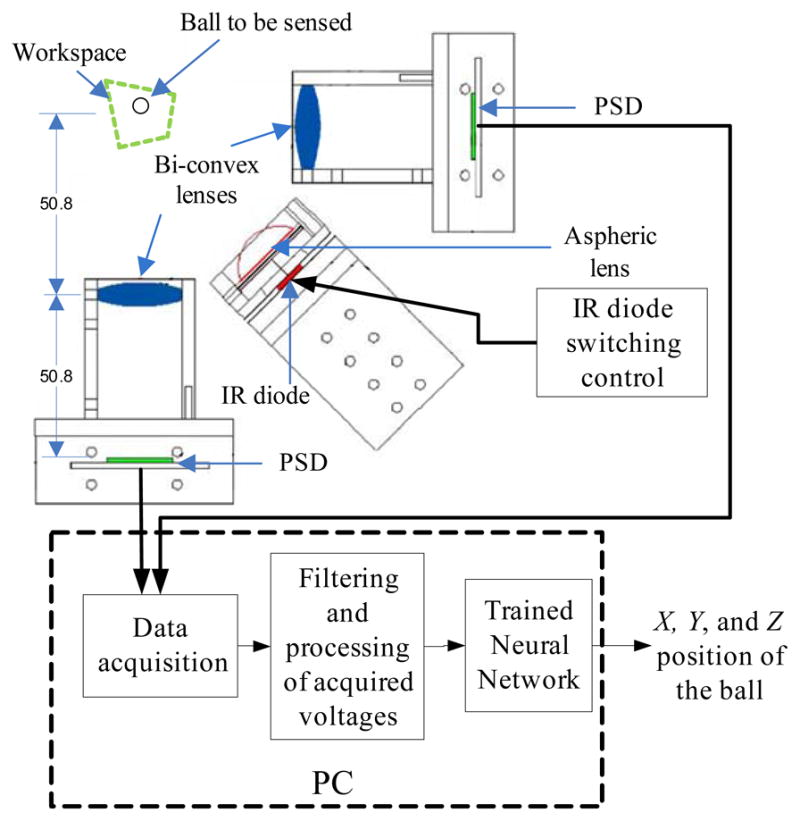
An overview of the system (M2S2).
Each PSD module employs a two-dimensional PSD with a 20 mm square sensing area. There are two pairs of output electrodes in a two-dimensional PSD – X-axis electrode pair and Y-axis electrode pair. The current produced at an electrode depends on the intensity and position of the centroid of the light striking the PSD [28]. With regards to an electrode pair, the electrode located nearer to the light centroid will produce more current than the other. With this phenomenon, the position of the light centroid can be calculated once the current produced at each electrode is known. The module converts current produced at each electrode into voltage. For each PSD module, two normalized voltage outputs independent of the light intensity – one representing the light centroid position in X-axis, and the other representing in Y-axis – are obtained by dividing the difference between the two voltages of each electrode pair with their summation.
Bi-convex lenses (LB1761-B (∅25.4mm, f=25.4mm), Thorlabs, Inc., USA) are placed at 50.8 mm (two times focal length) in front of each PSD. These lenses are anti-reflection coated to maximize the transmission of IR light. Distance between center of the workspace (shown in green dotted line in Figure 2) and each of the two lenses is also 50.8 mm.
The white reflective ball (∅6mm) from Gutermann (Art. 773891), whose location is to be sensed, is attached to tip of the instrument shaft which has 1 mm diameter and is painted with a non-reflective black color as can be seen in Figure 1. The IR diode delivers IR light onto the workspace. Sensing of the three-dimensional motion of the ball, and hence the instrument shaft tip, is achieved by placing the ball in the workspace. IR rays from the IR diode are reflected from the ball surface. Some of the reflected IR rays are collected by the lenses and imaged onto the respective PSDs. The light spot positions on the respective PSDs are affected by the ball position. Therefore, the ball position is known from the centroid positions of the IR rays striking the PSDs.
It should be noted that commonly-used optical band-pass filters which are used in [20][21] to reduce disturbance light intensity are not employed in this system. The main reason for not employing the band-pass filters is that they also reduce the IR light intensity striking the PSDs, resulting in poor signal and hence poor resolution. Elimination of disturbance lights in this system is performed using a method based on switching control of the IR light. The method is described in section 5. The IR diode switching control is performed by a microcontroller-based control circuit.
An overview of the system is shown in Figure 2. The PSD modules convert the IR rays striking the PSDs into voltages which are then acquired using a data-acquisition card (DAQ) placed inside a PC. The acquired voltages are then filtered and processed for a feedforward neural network which then gives three-dimensional position of the ball. The data acquisition, filtering, processing, and the neural network function are all performed using software written in LabVIEW (National Instruments Corporation).
Voltage signals from each output of the PSD modules are sampled and digitized at 16.67 kHz, 16 bits using a data acquisition card (PD2-MF-150, United Electronic Industries, Inc, USA). Shielded cables are used to connect both PSD module outputs to the data acquisition card for better noise suppression. The power and signal cables are also separated to eliminate coupling of power line noise and signals. The digitized samples are first filtered with an 8th order Butterworth low-pass software filter having a cutoff frequency of 100Hz and subsequently downsampled to 250Hz by averaging. Root-mean-square (RMS) amplitude of the filtered noise is approximately ten times smaller than that of the unfiltered noise. The filtered voltage signals obtained after averaging are used to compute the respective normalized centroid positions for the neural network input.
OD-669 IR diode from Opto Diode Corp. is chosen as the IR light source because it has very high power output and its peak emission wavelength is within the most sensitive region of the PSD spectral response. Since radiation of IR light from OD-669 is diverging, an aspheric condenser lens (∅27mm, EFL=13mm, Edmund Optics) is placed in front of the IR diode to converge the IR rays onto the workspace. The lens also enhances the IR intensity by more than two times. The IR diode is pulsed at 500Hz (Duty cycle=50%) to increase the maximum current limit of the IR diode as well as to handle ambient lights. Increasing maximum current limit results in a higher IR emission intensity and thereby, improving the SNR. The pulse timing of the IR diode is controlled with a PIC microcontroller via a field effect transistor (FET).
3. Optical System Analysis
In this section, analyses of the workspace of the system, and reflection of the IR rays from the ball and the shaft are presented. Reflection from an object can be decomposed into two main components: specular reflection, and diffuse reflection. Specular reflection refers to the mirror-like reflections from smooth surfaces where the incident beam and reflected beam make the same angle with the normal of the surface. Specular reflection is simulated with a single incident ray hitting the reflective surface and a single ray reflected back. The reflected ray has the same magnitude as the incident one if the surface is not absorptive. In diffuse reflection, reflected rays may follow many different angles than just one. Reflection from a mat piece of paper is diffuse reflection. In modelling diffuse reflection, the incident ray is slit into many rays and each one follows a different path determined by a probabilistic function. There are many ways to model the range and intensity of reflected rays in diffuse reflection. For our work, Lambertian distribution that is widely used and gives excellent results as a first step approximation is used.
3.1 Reflection from the Ball
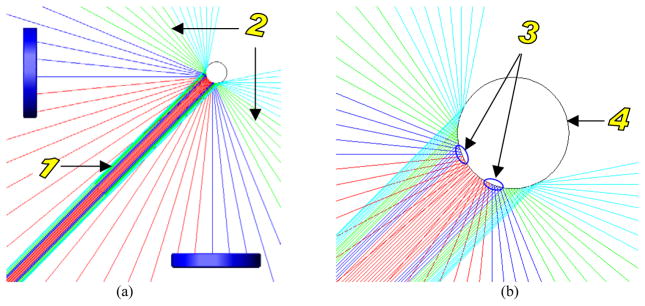
Not all the IR rays that hit the ball enter the lenses. Only some portion of the rays passes through the lenses and falls onto the PSD. Since the ball is shiny, its specular reflection is relatively very high. A plan-view schematic diagram of specular reflection of IR rays from the ball surface is shown in Figure 3. Figure 3(b) shows a close-up plan-view of incidence of IR rays onto the ball. The surfaces that reflect the rays which enter the lenses are also shown in the figure.
Figure 3.
A plan-view schematic diagrams of specular reflection of IR rays from the ball surface showing (1) incident IR rays from the diode, (2) Reflected IR rays from the ball, (3) surfaces that reflect IR rays to the lenses, and (4) the ball.
3.2 Workspace Analysis
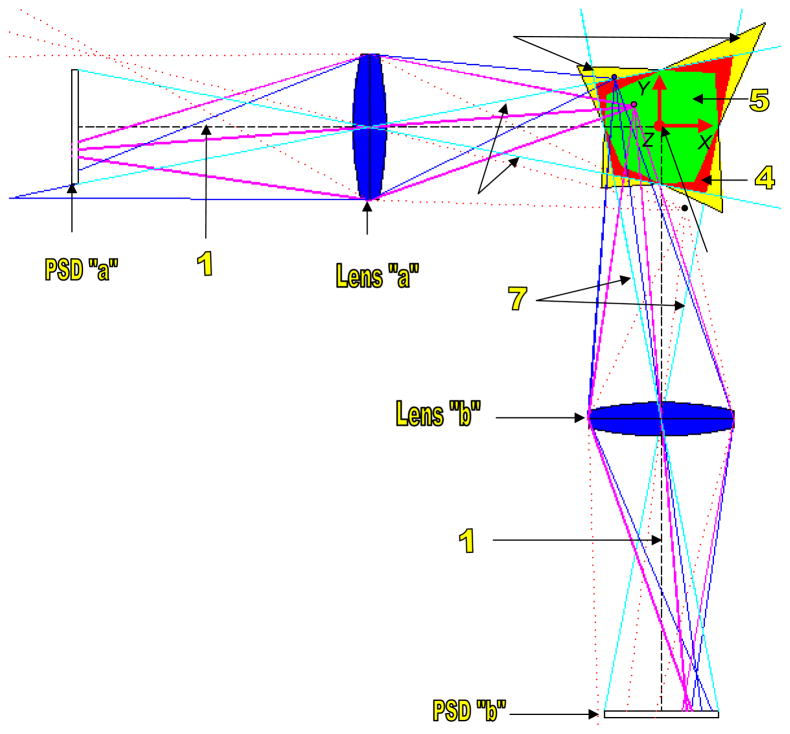
Workspace is defined loosely as all the locations of the ball where reflected IR rays from the ball strike both PSDs. Workspace is known by tracing rays of light from each point in the space to both PSDs through the lenses. Figure 4 shows ray tracing of light from a few points to both PSDs thorough the lenses that are assumed to be thin lenses for simplicity. As can be seen from the figure, all the rays that are originated from the magenta point and collected by each lens reach its corresponding PSD. For the blue point, only half of the rays collected by the lens “a” reach PSD “a” although all of the rays collected by lens “b” reach the PSD “b”. For the black point, none of the rays collected by the lens “a” reach PSD “a” although some of the rays collected by lens “b” reach the PSD “b”. It can be figured out that for the points within the principal rays shown in cyan, at least half of the rays collected by the lens will reach its corresponding PSD. More detailed description on ray tracing can be found in [29].
Figure 4.
Top view schematic diagram showing ray tracing of points [(1) principal axes, (2) origin of the world frame, (3) workspace I, (4) workspace II, (5) workspace III, (6) principal rays for lens “a”, and (7) principal rays for lens “b”].
Based on the proportion of the rays that a PSD receive from the total rays collected by its lens, workspace of the system can be grouped into three as also shown in Figure 4Error! Reference source not found.. In the figure, the region shown in yellow (workspace I) is the workspace where both PSDs receive some but less than half of the reflected IR rays collected by their corresponding lenses. The region shown in red (workspace II) is the workspace where both PSDs receive at least half of the rays collected by their corresponding lenses, and the region shown in green (workspace III) is the workspace where both PSDs receive all the reflected IR rays collected by their corresponding lenses. The ball at locations outside the workspace I would deprive at least one of the PSDs of receiving any of the ball reflections collected by the lens. This can be seen in Figure 4 which shows that none of the reflected rays from the black point, which is outside the workspace I, do not reach the PSD “a”.
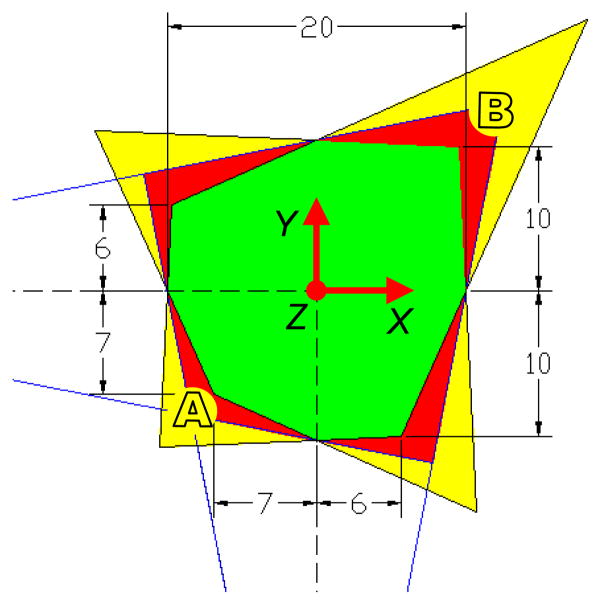
Since some of the reflected rays that are collected by the lenses do not strike the PSDs in workspace I and workspace II, higher nonlinearity exists in the measurement of the ball locations in these workspaces. A close-up top view schematic diagram showing the dimensions and the shapes of the workspaces are shown in Figure 5. Magnification is not constant within the workspace. In Figure 5, at location “A”, the magnification is approximately 1.4 while at location “B”, it is approximately 0.8. The magnification is one at the origin of the world frame (intersection point of the two principal axes). It should be mentioned here that although the ball is out-of-focus at most of locations within the workspace, since PSD detects centroid of the rays, out-of-focus does not create a problem.
Figure 5.
A close-up top-view schematic diagram of the workspaces. Dimensions are in millimeter.
3.3 Reflection from the Shaft
Although the shaft is painted with non-reflective black color so that it absorbs all the IR rays which hits it, there exists imperfection in absorption of the rays, and some rays are reflected. Some of the reflected rays also reach the PSDs, mixing with the IR rays reflected from the ball, and hence causing inaccuracy of measurement of the system. The intensity and location of the reflected IR rays striking the PSDs due to the shaft depends on orientation and reflective properties of the shaft. Analysis based on simulation is performed for several orientation angles to see the effect of the instrument shaft orientation and reflective properties on the accuracy of the measurement. Optical design and analysis software (ZEMAX-EE, Radiant ZEMAX LLC, USA) is used for the simulation.
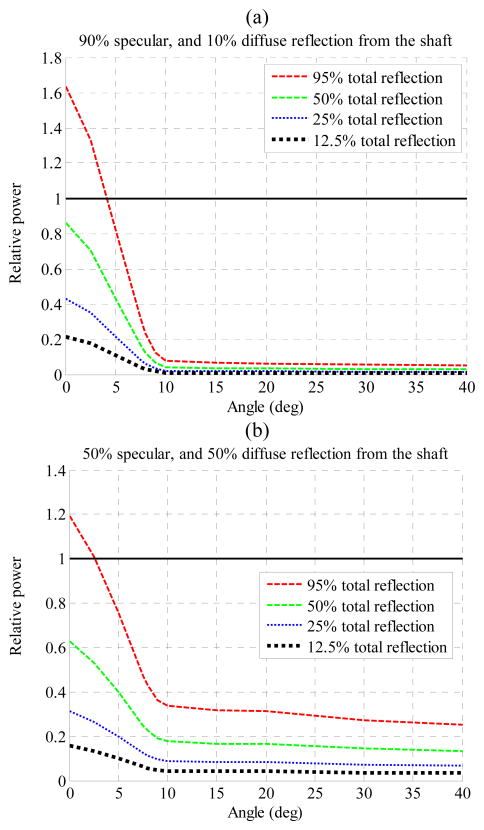
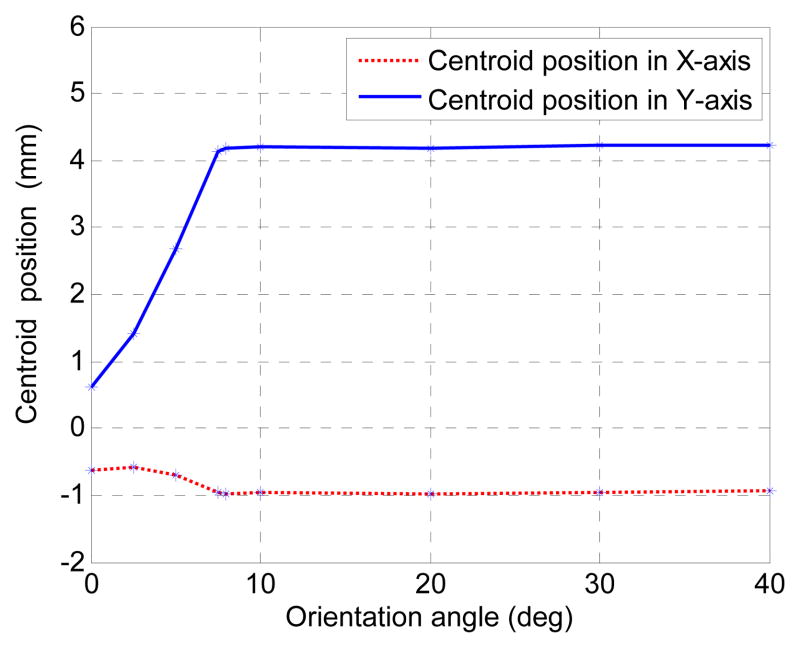
Angles of orientation of the instrument shaft about X-axis and Y-axis are represented as α and β, respectively, as shown in Figure 6. Assignment of the world frame with respect to the workspace of the system can be seen in Error! Reference source not found. and Figure 5. Origin of the world frame is chosen at the center of the workspace. The values of the angles are varied and intensities of lights received at every pixel location of the sensors are measured. Different light patterns and intensities received on a sensor for different orientation angles of the shaft are shown in Figure 7. Figure 8 shows simulation of specular reflection of IR rays from the shaft at α = β = 30°. It can be seen that reflected rays do not enter the lenses. Relative power levels received at the sensors due to reflections from the shaft with respect to the power level due to reflection from the ball are shown in Figure 9. In Figure 9(a), the amounts of specular reflection and diffuse reflection are set at 90% and 10% respectively of the total reflection while in (b), they are set equally at 50% of the total reflection. As can be seen from the figure, the power due to reflections from the shaft drops significantly after approximately 10°. Centroid positions as a function of orientation angles of the shaft for a constant position of the ball are shown in Figure 10. Changes in centroid position due to changes in orientation become negligible after approximately 10°. In all the simulations, total reflection from the ball is set at 95 % of the incident light, and its specular reflection and diffuse reflection are set at 90% and 10% respectively. The simulation results are discussed in section 6.4 and section 7.
Figure 6.
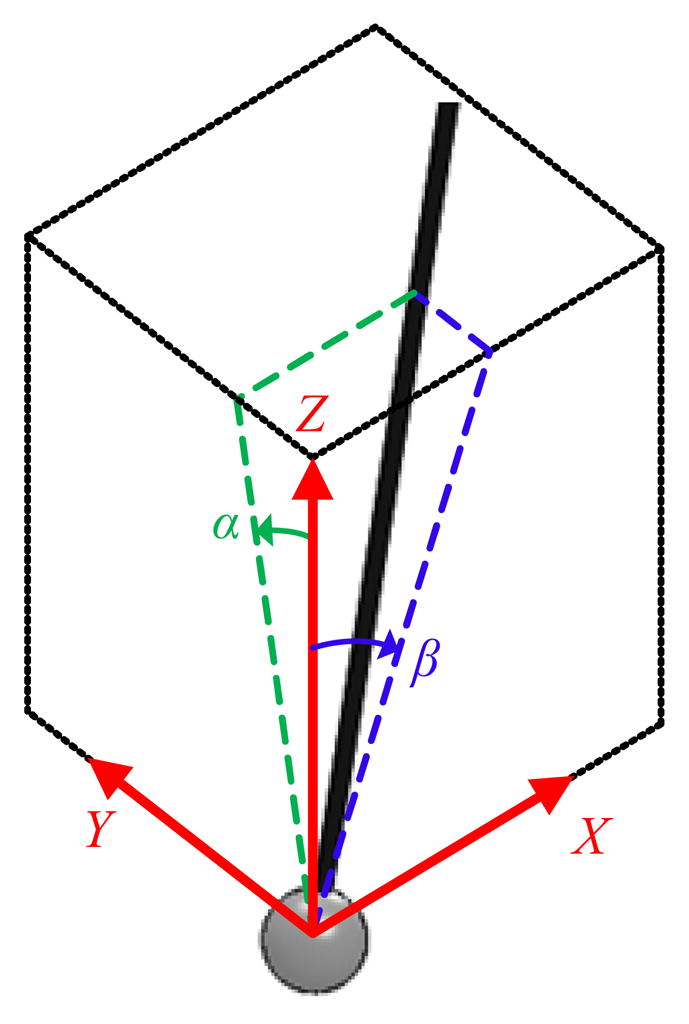
Orientation of the shaft at α and β angles.
Figure 7.
Different light patterns and intensities received on a sensor for different orientation angles of the shaft.
Figure 8.
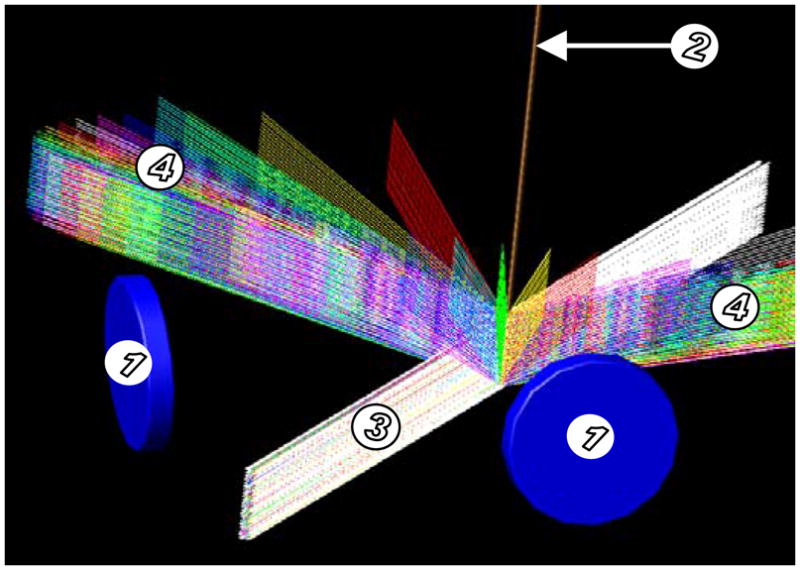
Simulation of specular reflection from the shaft at α = β = 30°. (1) bi-convex lenses, and (2) instrument shaft, (3) incident rays, and (4) reflected rays.
Figure 9.
Relative power levels received at the sensors due to reflections from the shaft and the ball. The power received at the sensors due to reflection from the ball is set at one.
Figure 10.
Centroid positions as a function of orientation angle of the shaft. Total reflection from the shaft is set at 50% of the incident light. The specular reflection and diffuse reflection are set at 90% and 10% respectively.
4. System Calibration
Calibration of the system can be performed by various approaches such as physical modeling, brute force method in which look-up table (LUT) and interpolation are used, neural network, etc. Physical modeling can give the best accuracy if all the parameters of the system are taken into consideration but that requires thorough understanding of the physical behavior of each individual component. LUT with interpolation method requires calibration data be stored in memory and needs larger data for higher accuracy.
A multilayer neural network approach is proposed for this application because it eliminates the need to know individual component’s behavior; uses a reasonable span of time for a trained network to determine the output and can approximate any arbitrary continuous function to any desired degree of accuracy [30].
4.1 Obtaining Calibration Data
Calibration data consists of a set of reference positions of the ball, , i = 1,2,…, n. and the corresponding measured values of the outputs from the two PSDs, , i = 1,2,…, n. where n is the number of calibration locations where the reference positions and the corresponding measured values are obtained. The variables x1i and y1i are outputs from one PSD representing the centroid position of the light striking its surface while x2i and y2i are from the other PSD. The calibration data is obtained by making known displacement of the ball and acquiring the corresponding output values from the two PSDs. Movement of the ball and acquisition is automatically performed by controlling motorized precision stages using software developed in-house. X-Y-Z stepper-motorized precision translation stages (8MT173-20, Standa) are used for the calibration. No rotation of the shaft occurs during the calibration. The travel range and accuracy of the stages is 20 mm, and 0.25 μm, respectively. The calibration setup for the system is shown in Figure 11.
Figure 11.
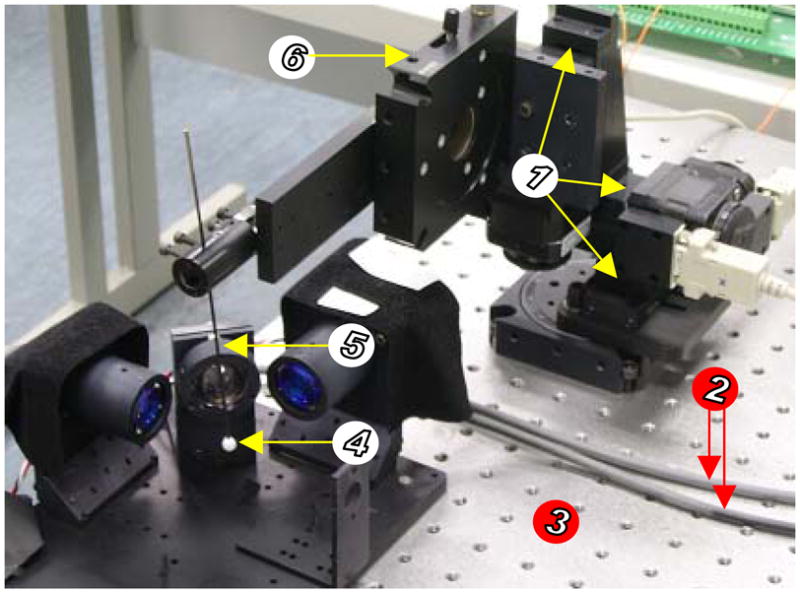
The M2S2 system and its calibration setup showing (1) motorized precision translation stages, (2) shielded cables, (3) the anti-vibration table, (4) the reflective ball, (5) the shaft, and (6) a manual rotary stage.
As described in section 3.2, since all the reflected IR rays that are collected by the lenses strike the PSDs when the ball is in the workspace III, nonlinearity is less severe in this workspace. Therefore, only the calibration data within the 123 mm3 in the workspace III is used for the neural network training and evaluation of the system accuracy. The spacing between two successive calibration locations is 1 mm. The total number of calibration locations for 123 mm3 is therefore 133. The data obtained at each calibration location and their corresponding absolute positions are used as training and target values respectively for neural network training.
In order to improve the quality of the acquired data, after each displacement of the ball, sufficient time is provided for mechanical vibrations generated by the motion of the motorized stages to settle down before acquiring data. In addition, the system including the motorized stages is placed on an anti-vibration table to suppress floor emanated vibrations. In order to ensure that calibration is not affected by temperature, the system is switched on for about ten minutes before commencing the calibration so that the IR diode attains a steady operating temperature state.
4.2 Mapping by a Feedforward Neural Network
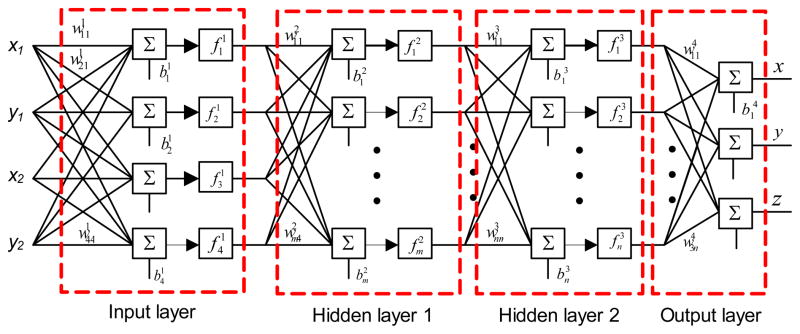
A multilayer feedforward neural network model is proposed because PSD calibration is a nonlinear problem that cannot be solved using a single layer network [31]. The determination of proper network architecture for the PSD system calibration is ambiguous like other neural network applications. The best architecture and algorithm for a particular problem can only be evaluated by experimentation and there are no fixed rules to determine the ideal network model for a problem. The network model employed includes four neurons in the input layer, three neurons in the output layer, and two hidden layers. The network is shown in Figure 12.
Figure 12.
The neural network employed for obtaining x, y, and z position of the ball.
The number of neurons in the hidden layers is varied to achieve the best accuracy. Three neurons are used in the output layer for the three components of the position vector: x, y, and z. The position vector, , is obtained using the weight matrices Wi, i = 1,2,3,4; bias vectors, b⃗i, i = 1,2,3,4; and transfer function vectors, f⃑j, j = 1,2,3,; and the PSD outputs vector, , as follows.
| (1) |
where , i =1,2, or 3; j =1,2,…, m or n; are log-sigmoid transfer functions and are expressed as:
| (2) |
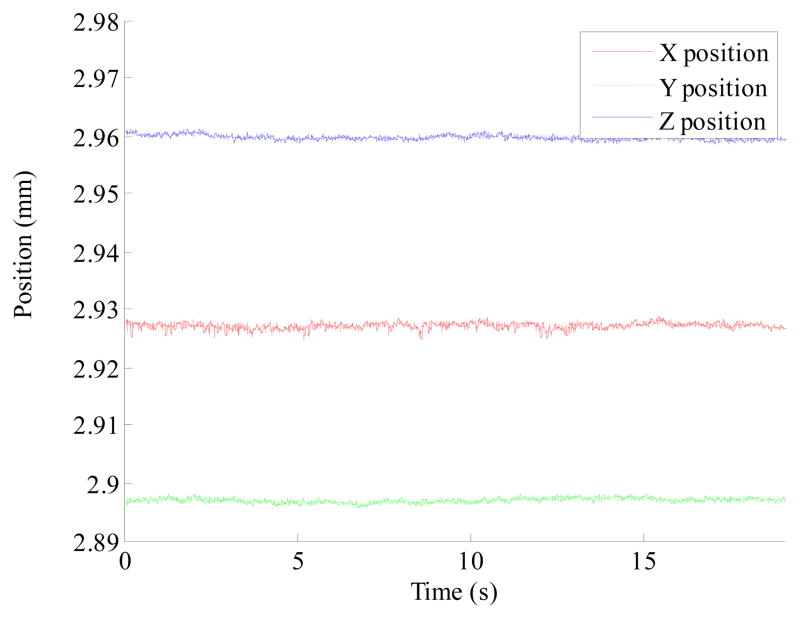
Levenberg-Marquardt algorithm [32] is used in training the network to obtain the weight matrices, and the bias vectors. Discussion on the use of the algorithm in training feedforward neural networks can be found in [33]. Figure 13 shows nonlinearity with and without neural network calibration. Table 1 shows accuracies of the system with a few different numbers of neurons in the hidden layers. Figure 14 shows neural network position output for a stationary ball.
Figure 13.
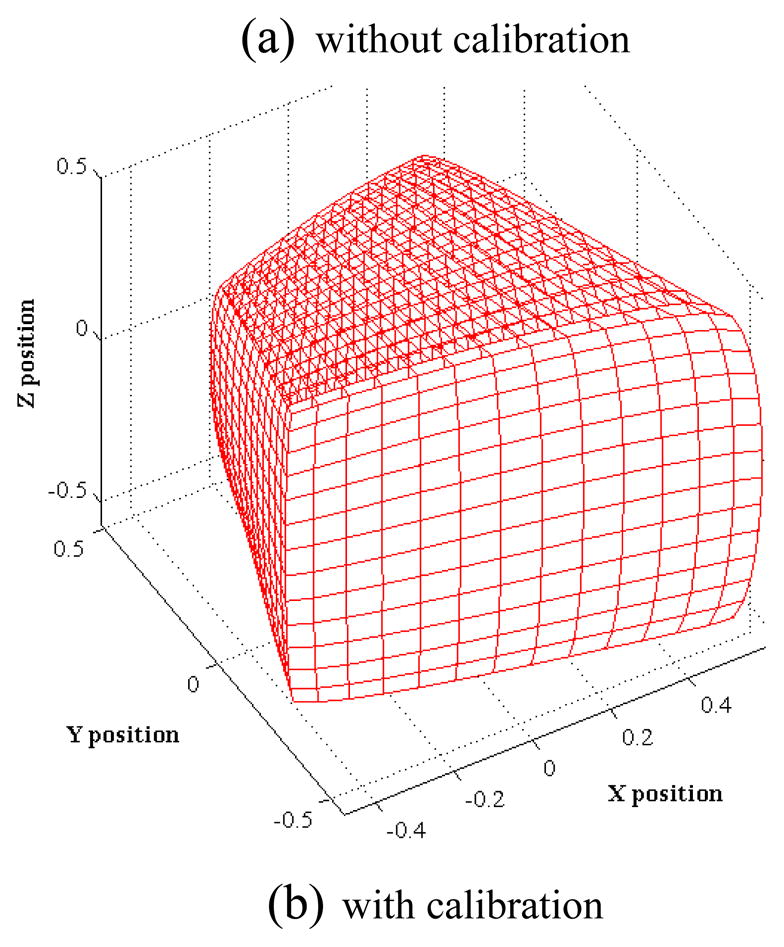
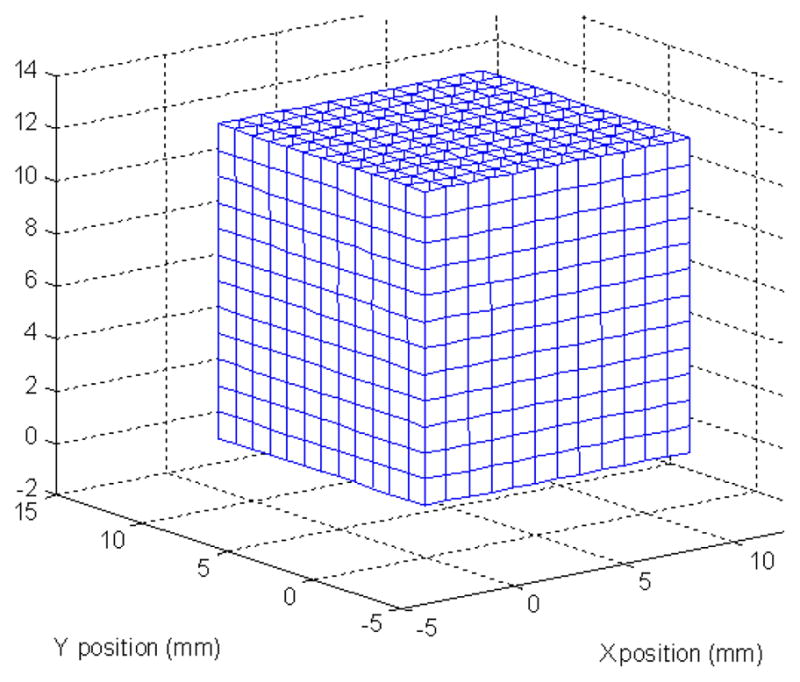
3D comparison for the amount of non-linearity (a) without calibration, and (b) with neural network calibration.
Table 1.
RMS errors and accuracies calculated within 12 mm cubical workspace.
| Number of neurons in the first hidden layer (m) | Number of neurons in the second hidden layer (n) | Minimum error (μm) | RMSE (μm) | Maximum error (μm) | Accuracy (%) |
|---|---|---|---|---|---|
| 14 | 8 | 20 | 63 | 169 | 99.47 |
| 14 | 14 | 19 | 51 | 130 | 99.57 |
| 20 | 20 | 15 | 41 | 110 | 99.66 |
Figure 14.
Twenty seconds measurement of position of a stationary ball.
The RMS errors (RMSE) and accuracies are calculated over the range of 12 mm cubical space at 133 locations. To determine the measurement errors at each location, measured values at these locations are subtracted from their respective true values. True values are known by moving the ball to known relative positions using motorized precision translation stages. Then, the RMSE is calculated using errors at all the locations, and accuracy is calculated using RMSE as follows:
5. Handling Disturbance Lights
Disturbance lights affecting the system accuracy can be categorized into two: ambient light, and environment light. The ambient light is the light coming from various light sources other than the IR diode while the environment light is the IR light coming from reflection of IR light from surrounding objects. In this section, handling these disturbance lights is described.
Assuming reflection from the shaft does not strike the PSDs, total light falling on the PSDs, LT, can be decomposed into three main components: reflected IR light from the ball LIRball, reflected IR light from the environment (or the environment light) LIRenv, and ambient light Lamb.
| (3) |
Since the instrument tip position, which is the same as the ball position, is of interest, only the voltage outputs due to LIRball should be used for the neural network input to obtain position of the ball and voltage outputs due to the other two components can be regarded as DC offsets or disturbances and they should be excluded.
5.1 Handling Ambient Light
As mentioned in section 2, the IR diode is pulsed at 500 Hz with 50% duty cycle. The lights falling on the PSDs during the period while the IR diode is switched on, LOn normally consist of all three components described in (3). Therefore, LOn can be described as
| (4) |
The lights falling on the PSDs during the period while the IR diode is switched off, LOff is only due to ambient light, Lamb.
| (5) |
Subtracting (5) from (4) and using (3), resultant light, Lres becomes
| (6) |
By subtracting the voltage outputs obtained during the period while the IR diode is switched off, VOff from those obtained while it is on, VOn, the voltage outputs of the module due to Lres are obtained. If the voltage outputs due to Lres are used for the neural network input, the system accuracy will not be affected by the ambient light.
5.2 Handling Environment Light
Although using (6) eliminates the effect of ambient light, it still includes LIRenv. The accuracy will be affected if the value of LIRenv is different from that during the calibration. The value of the environment light can be different due to various reasons such as introduction of a new object near to the workspace. One way solve the inaccuracy caused by the changes in the environment light is to perform the calibration again. This requires proper setup and is time consuming. Therefore, a method is proposed and employed which avoids the need to do calibration every time there is change in the environment.
The value of the environment light needs to be measured and subtracted from (6) so that Lres contains only LIRball. The LIRenv, depends on properties of the surrounding objects such as shape, color, reflection coefficients, etc. To measure LIRenv, the instrument shaft and the ball are removed from the workspace and data-acquisition is performed while IR diode is switched on and off. Then, LOn contains only two components; LIRenv and Lamb. By subtracting voltage outputs due to LOff from those due to LOn, voltage outputs due to LIRenv can be obtained.
| (7) |
The LIRenv remains constant as long as surrounding objects are maintained the same. Whenever the surrounding objects or their properties are changed, LIRenv needs to be measured again.
6. Experiments and Results
Experiments are conducted to show system resolution, dynamic accuracies, and static accuracies at different orientation of the instrument shaft. Experiments are also carried out to show that the system accuracy is not affected by different ambient and environment light conditions. In this section, the mentioned experiments and their results are presented.
6.1 Effect of Different Ambient Light Condition
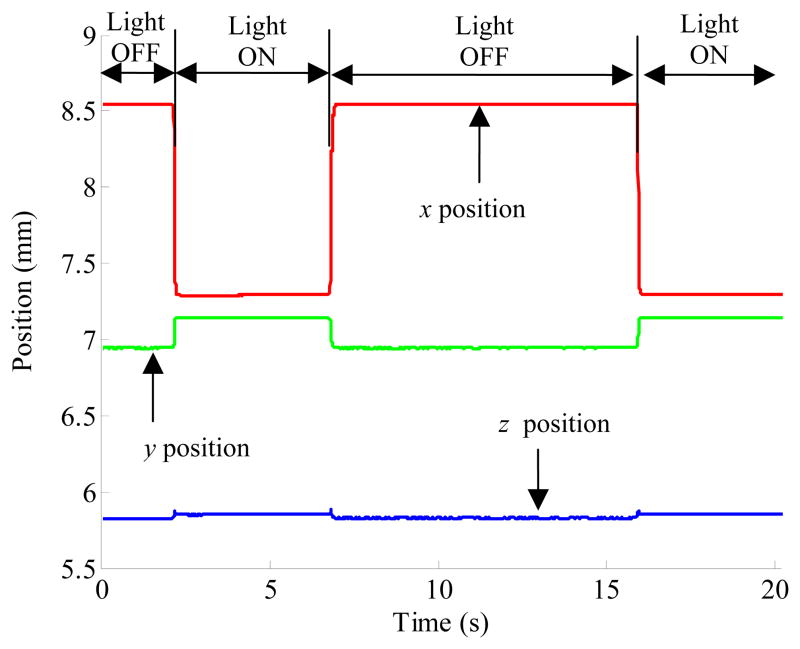
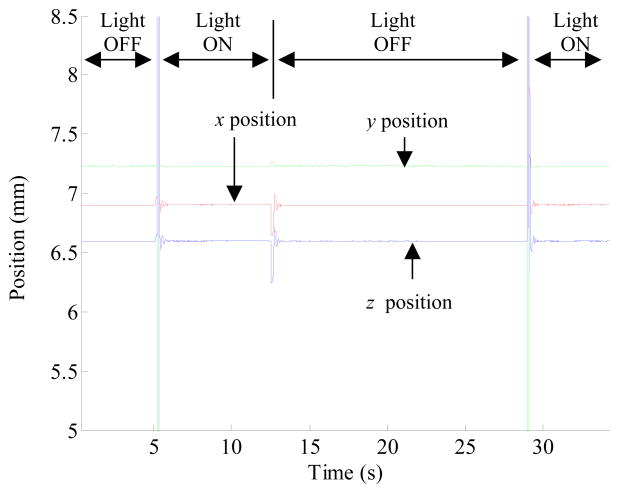
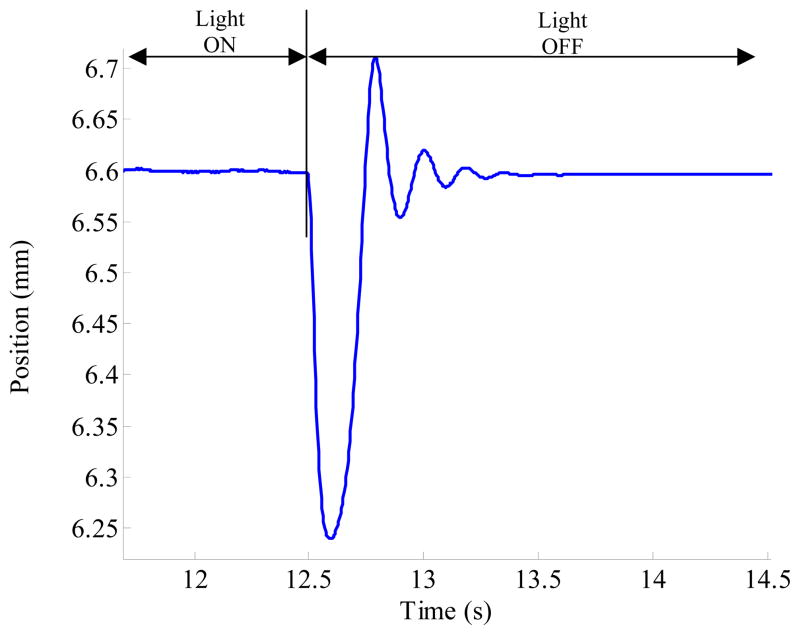
To see the effect of different ambient light intensity on the accuracy of the M2S2, a light bulb (40W, 240Hz) is placed on the system. While the ball position is being measured by the system, the light bulb is turned on and off a few times. Figure 15 shows the effect of light changes on the system accuracy without using the method described in section 5.1. As can be seen in the figure, the calculated position of the ball is not the same for the periods while the light is turned on (Light ON) and off (Light OFF). System accuracy with the use of the method under the condition of ambient light changes is shown in Figure 16. The transient behavior of the system when ambient light intensity is changed is shown in Figure 17.
Figure 15.
The effect of changes in ambient light on the accuracy of M2S2.
Figure 16.
System accuracy invariant (Measured x, y, and z positions of the instrument tip is constant for stationary tip) to different ambient light intensities when using the method in section 5.1.
Figure 17.
Close-up view of the transient effect when the light is switched off.
6.2 Effect of Changes in Environment Light
To show that by excluding LIRenv in the neural network input, the system accuracy is not affected by the changes in environment (surrounding objects or their properties), two neural networks are used for comparison. The first neural network is trained with the data obtained from voltages due to the lights which consist of a combination of LIRball and LIRenv. The second neural network is trained with the data due to LIRball only.
A test platform (a representative object) is then placed just below the workspace of M2S2 as shown in Figure 18. The presence of the test platform makes the value of LIRenv different from that during the calibration (i.e., without the presence of the platform). The new value of LIRenv is measured as described in section 5.2 and excluded in the input of the second neural network.
Figure 18.
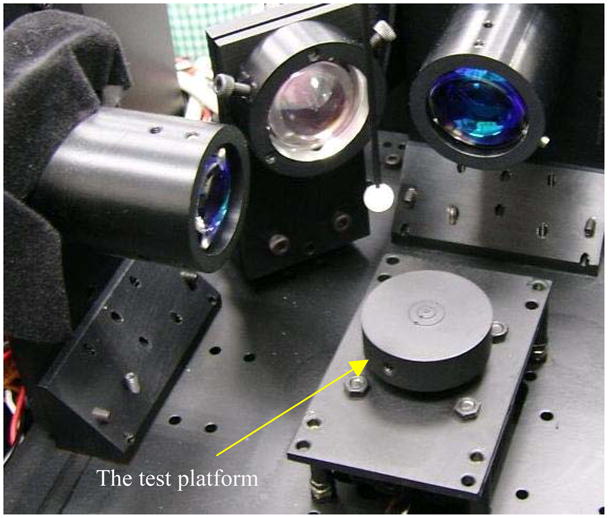
M2S2 with the test platform.
Table 2 shows the comparison of Root Mean Square (RMS) errors and accuracies of the system for the two neural networks. The RMS errors and accuracies are calculated over the range of 12 mm cubical space.
Table 2.
Comparison of RMSE, and accuracies of the system for the two neural networks.
| 1st Network | 2nd Network | |
|---|---|---|
| RMS error (μm) | 115.96 | 43.20 |
| Accuracy (%) | 99.03 | 99.64 |
6.3 System Resolution
Resolution of the system is determined by placing a stationary ball in the middle of the workspace and measuring the ball position for a period of one minute. Resolution or standard deviation of the measured values during one minute is found to be 0.9 μm.
6.4 Accuracies at Different Orientations of the Instrument
Simulation results in Figure 10 show that centroid positions vary significantly as orientation angles of the shaft vary for orientation angles less than approximately 10°. Obviously, the change in centroid positions would result in inaccuracy of the system. However, this cannot be shown experimentally since a remote center-of-rotation device needed to keep the ball position at a constant location while rotating the shaft is not available. Using the setup shown in Figure 11, the shaft can be rotated to a desired particular orientation although the ball cannot be kept at the same position while the shaft is being rotated. Therefore, accuracies at a few different fixed orientations can be measured and compared.
To perform this, the neural network is first trained with the data obtained at the instrument orientation being vertical (i.e., α = β =0 ). Then, measurements to calculate accuracies at different fixed orientation angles are performed as follows. The instrument that is attached to the translation stages is tilted to a particular orientation. Subsequently, the ball is moved using the translation stages to a desired location in the workspace while keeping the orientation constant. This location is regarded as an initial location for that particular orientation. Then, keeping the orientation constant, the ball is moved to locations whose relative positions with respect to the initial location are known. After moving the ball and making corresponding measurements using the trained neural network at all the required locations for accuracy assessment, accuracy at that particular orientation is calculated. Therefore, accuracy calculation is not based on absolute positions, but it is based on the relative positions with respect to the initial location of the ball. The process is repeated to calculate accuracies at other desired orientations.
Figure 19 shows the instrument orientation at α = β =50°. Different accuracies at different instrument orientation angles are reported in Table 3. A 3D plot of measurement accuracy of M2S2 for a particular instrument orientation at α=0°, and β= −60° is shown in Figure 20.
Figure 19.
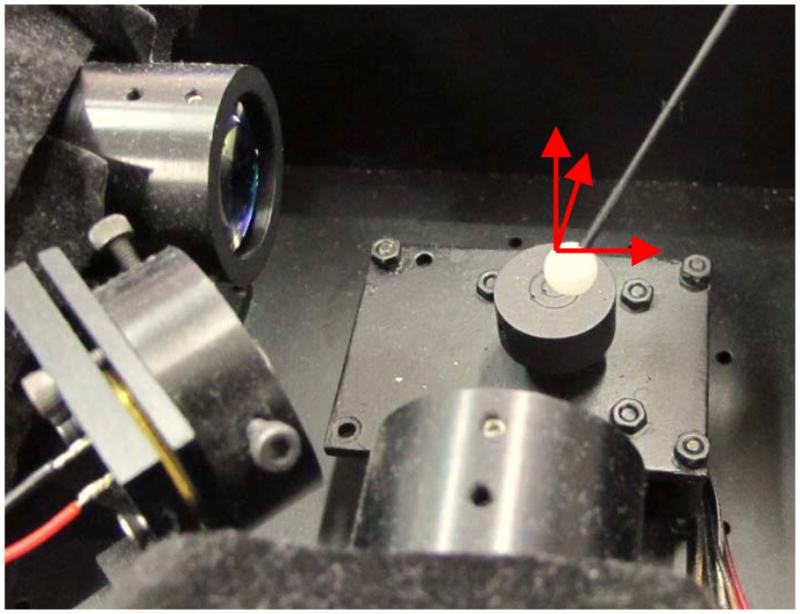
Measuring ball positions at known locations with the instrument orientation angles at 50°.
Table 3.
Accuracies of the system at different orientations of the instrument when the neural network trained with the data obtained at 0° of orientation angles is used (The accuracy of the system at 0° is 99.65%). Reduction in accuracy is obtained by subtracting a particular accuracy from the accuracy at 0°.
| β (°) | α (°) | Accuracy (%) | Reduction in accuracy (%) |
|---|---|---|---|
| −30 | 0 | 97.89 | 1.77 |
| −45 | 0 | 96.02 | 3.64 |
| −60 | 0 | 95.47 | 4.19 |
| 5 | 5 | 98.6 | 1.05 |
| 10 | 10 | 97.3 | 2.36 |
| 15 | 15 | 97.1 | 2.56 |
| 20 | 20 | 97.0 | 2.66 |
Figure 20.
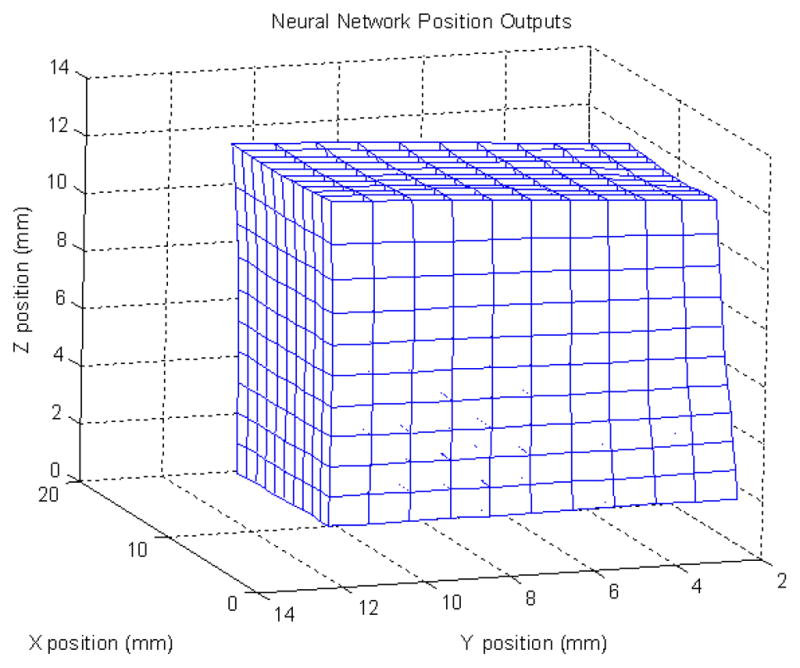
3D plot of measurement accuracy of M2S2 for the instrument orientated with α=0°, and β= −60°.
Simulation results in Figure 10 also show that the when the orientation angles are more than 10°, change in centroid positions due to the change in orientation is insignificant. To confirm this, the neural network is first trained with the data obtained at orientation angles of 30°. Then, accuracies at the other orientation angles are calculated using the neural network trained with the data obtained at 30°. Accuracies of the system at different orientations of the instrument when the neural network trained with the data obtained at 30° of orientation angles is used are shown in Table 4. Reduction in accuracy is obtained by subtracting a particular accuracy from the accuracy obtained at orientation angle of 30°.
Table 4.
Accuracies of the system at different orientations of the instrument when the neural network trained with the data obtained at 30° of orientation angles is used(The accuracy of the system at 30° is 99.67%). Reduction in accuracy is obtained by subtracting a particular accuracy from the accuracy at 30°.
| β (°) | α (°) | Accuracy | Reduction in accuracy (%) |
|---|---|---|---|
| 10 | 10 | 99.36 | 0.31 |
| 15 | 15 | 99.64 | 0.03 |
| 20 | 20 | 99.56 | 0.11 |
| 30 | 30 | 99.66 | 0.01 |
| 40 | 40 | 99.46 | 0.21 |
| 45 | 45 | 99.55 | 0.12 |
| 50 | 50 | 99.65 | 0.02 |
6.5 Dynamic Accuracies of the System
The accuracy values reported in the previous tables are static accuracy values which are calculated from measurement values which are obtained by moving the ball to known locations and measuring the respective positions of the ball when it is stationary (i.e, measurement is not performed when the ball is being moved). Dynamic accuracy of the system might be different from static accuracy due to the filter employed in the system and some other factors. Therefore, dynamic accuracies of the system at different frequencies need to be measured.
Physiological tremor is the erroneous component of the hand motion which corrupts the intended motion of the hand most often [2]. Its amplitude range is from a few tens of microns to a few hundreds of microns while the frequency range is from approximately 8- to 12-Hz [2]. To make sure that the system performs well in sensing the physiological tremor, dynamic accuracies of the system at 8 Hz, 10Hz, and 12 Hz are evaluated.
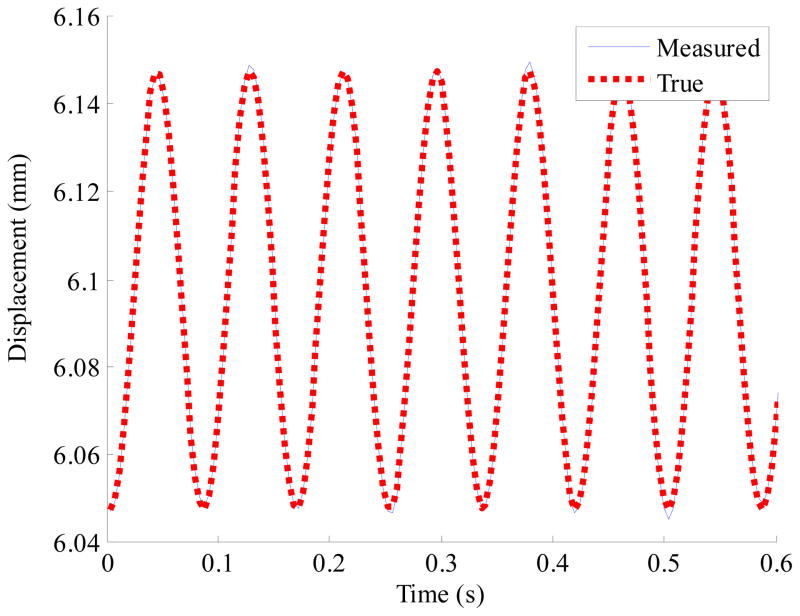
Dynamic accuracies are obtained by measuring position of a ball moving in a sinusoidal motion with 50 μm amplitude with varying frequencies up to 12Hz. Movement of the ball in a sinusoidal motion is generated by a nanopositioning system (P-561.3CD from Physik Instrumente). The positioning accuracy of the system is less than 0.1 μm. Measured positions by the system and true positions which are generated by the nanopositioning system are compared after compensating for the slight phase-lag due to the low-pass filter employed. Dynamic errors and accuracies calculated over the peak-to-peak motion range of 100 μm are shown in Table 5. The plot of the displacement of the ball at 12 Hz is shown in Figure 21.
Table 5.
Dynamic errors and accuracies.
| @ 8 Hz | @ 10 Hz | @ 12 Hz | |
|---|---|---|---|
| Dynamic RMSE (μm) | 1.1±0.03 | 1.12±0.02 | 1.28±0.03 |
| Dynamic RMS Accuracy (%) | 98.9 | 98.88 | 98.72 |
Figure 21.
Displacement of the ball moving at 12 Hz, and 100 μm peak-to-peak.
7. Discussion
Nonlinear calibration is necessary to reduce inherent nonlinearity present in the system so that the system can be used to accurately assess micromanipulation performance of surgeons, and evaluate performance of intelligent microsurgical instruments. As can be seen in Figure 13(a), there exists significant nonlinearity in the system without calibration. The nonlinearity is significantly reduced with the neural network calibration as can be seen in Figure 13(b). To the authors’ knowledge, there is no neural network calibration for stereo camera systems with PSD sensors. Neural network-based calibration is proposed for the various advantages. With neural network calibration, system is robust to unknown parameters, and one does not need to model every single detail of the system component to achieve acceptable accuracy for micromanipulation tasks. Even low-cost lenses which have larger distortion (i.e., larger nonlinearity) can even be employed. Accuracies of the network with a few different numbers of neurons are reported. A feedforward network with twenty neurons in each of the hidden layers is employed for the experiments since it provides sufficiently good accuracy as can be seen in Table 1. However, exploring the use of other network architectures might give even better results if necessary.
The effect of orientation of the shaft with different reflective properties on the system accuracy has been studied. Accuracy is not affected by the orientation of the shaft as long as the orientation is the same as that at which calibration is performed, and remains unchanged when measurement is performed. This is because the neural network which is trained with the data including the effect of reflection from the shaft still receives the input data which has the same effect of reflection from the shaft for the same orientation. However, if the orientation angles are different from that at the calibration, reflective properties of the shaft such as specular and diffuse properties and its orientation determine the accuracy of the system.
Accuracy would not be affected by the orientation changes if there were no reflection from the shaft. However, in practice, there exists some amount of reflection due to imperfect absorption by the shaft. It can be seen in Figure 9 that power received due to the reflection from the shaft is significantly reduced when α and β are larger than 10°. This is due to the fact that specular reflection from the shaft does not reach the PSDs at these orientation angles (α and β >10 °). The residual power at these angles is due to the diffuse reflection. As can be seen in Figure 10, the amount of change in centroid position with respect to the amount of change in orientation angle within 10° of orientation angles is found to be approximately 400 μm/° while the amount after 10° is approximately 5 μm/°. Since there was no suitable device to keep the position of the ball at a fixed location while changing the orientation, this could not be shown experimentally.
However, as described in section 6.4, accuracies at different fixed orientations could be measured and compared to show this indirectly. The accuracy results shown in Table 3 suggest that reduction in accuracy is more as the difference in orientation angles is larger although the extents of reduction in accuracy are not severe (< ~ 3% even for the angle difference of 20°). This is due to the fact that accuracy calculated is based on the relative movements and measurements of the ball from its initial location. The accuracy results in Table 4 suggest that the reduction in accuracy is negligible (< ~0.3%) as long as the orientation angles are larger than 10° when the network is trained with the data obtained at 30°.
From the results in both Table 3 and Table 4, it can be concluded that as long as the orientation of the instrument can be maintained constant, the accuracy of the 3D displacement measurement of the ball is not affected so much. This is possible for evaluation of performance of some devices such as a hand-held micromanipulator [34] which causes negligible orientation changes. However, in assessing micromanipulation performance of surgeons, slight changes in orientation of the instrument can happen. Therefore, to minimize the effect of orientation changes on the accuracy, it is suggested that microsurgical instruments should be handled in such a way that the nominal orientation angles of the shaft are a few degrees larger than 10° while coating material of the shaft be chosen such that its diffuse coefficient is minimum.
Since the system does not employ optical band-pass filters for increased SNR, the use of the method described in section 5.1 to eliminate the effect of ambient light disturbance is necessary especially when the ambient light intensity is not constant such as the location under the microscope where the system is to be used quite often. Plots in Figure 15 show that the system accuracy is significantly affected without elimination of the effect of ambient light disturbance. Using the method, the accuracy is no longer affected as can be seen in Figure 16. Transient accuracy of the system, shown in Figure 17, is affected by the changes in ambient light intensity only for about one second. After about one second, the system can provide position information accurately. The transient inaccuracy is believed to be due to the low pass filter employed. However, in most situations, ambient light intensity is not changing so much during the usage of the system. For example, when it is used under a microscope, the microscope light is fixed at a particular intensity after the user has adjusted it to suit them. Results in Table 2 demonstrate that the effect of changes in the environment light due to the introduction of a new object on the system accuracy is negligible when the environment light component is excluded from the neural network input. As described in section 5.2, the value of the environment light required for the exclusion can be known by minimal effort and time.
Various measures to improve signal-to-noise ratio have been performed in order to achieve adequate sensing resolution for micromanipulation regardless of the passive tracking method. These includes the use of filtering, selection of an IR diode which provides IR light whose wavelength fall within the most sensitive region of the PSDs while giving very high power, increasing the maximum current limit of the diode, and the use of a lens to converge IR light onto the workspace. The resolution of the system reported in section 6.3 is sufficiently high for assessment of micromanipulation performance of surgeons, and evaluation of performance of most hand-held instruments [9][10]. If higher resolution is needed for some other applications, one of the methods to increase the resolution is to employ a DAQ card with higher sampling rate to have more samples for averaging. Experiments on dynamic accuracy in section 6.5 ensure that the system is capable of measuring all components of the motion of the hand accurately.
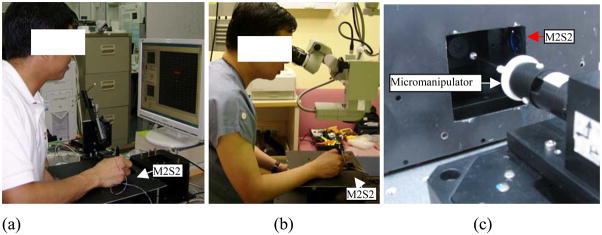
The system has already been being used in evaluations of accuracy enhancement devices such as hand-held microsurgical instruments [10][11][34][35], and micromanipulation performance of surgeons [36]. Figure 22 shows the use of the system in the evaluations.
Figure 22.
The use of the system in evaluation of micromanipulation performance of surgeons using a monitor screen (a), and a microscopes (b), and that of a micromanipulator’s positioning accuracy (c).
8. Conclusion
In conclusion, a motion sensing system that can sense 3D motion of an instrument tip in micro scale has been developed. The system accuracy is invariant to different ambient light and environment light conditions, and hence is suitable to be used under microscopes. Development, analysis, and calibration described in this paper are useful in implementing similar sensing systems. Knowledge from the analysis helps in obtaining good accuracies. It is ready to be used as an evaluation tool to assess the accuracy of hand-held microsurgical instruments and the performance of operators in micromanipulation tasks, such as microsurgeries.
Acknowledgments
Assessment and Training System for Micromanipulation Tasks in Surgery project is funded by Agency for Science, Technology & Research (A*STAR), Singapore, and partially funded by the U.S. National Institutes of Health under grant nos. R01EB000526 and R01EB007969. The authors thank them for the financial support of this work. The authors also thank Dr. Dan Elson from Hamlyn Centre for Robotic Surgery, Imperial College London for providing optical design and analysis software, ZEMAX, to conduct the simulation study of the system.
Biographies
Win Tun Latt received the B.E. degree in Electronics from Yangon Technological University, Myanmar in 2000. He earned the M.Sc. degree in Biomedical Engineering, and the Ph.D. degree from the Nanyang Technological University (NTU), Singapore, in 2004 and 2010 respectively. He is a recipient of a gold medal in Singapore Robotics Games in 2005. He worked as a member of research staff in NTU from 2005 to 2010. He has been working as a post-doctoral Research Associate in the area of biomedical robotics in the Hamlyn Centre for Robotic Surgery, and in the Department of Computing, Imperial College London, UK since 2010. His research interests include sensing systems, instrumentation, signal processing, computer control systems, medical robotics, and mechatronics.
U-Xuan Tan received the BEng degree in mechanical and aerospace engineering from the Nanyang Technological University, Singapore, in 2005. He earned the PhD degree from the Nanyang Technological University, Singapore in 2010. He is currently working as a post-doctoral research associate in Maryland University, USA. His research interests include mechatronics, control systems, smart materials, sensing systems, medical robotics, rehabilitative technology, mechanism design, kinematics, and signal processing.
Andreas Georgiou received his PhD in Optical Holography from the University of Cambridge. He continued his research on developing a miniaturised holographic projector while being a research and teaching fellow at Wolfson and Robinson Colleges respectively. He worked for a year with the Open University developing the UV and visible spectrometer under the ExoMARS project, the flagship mission of the European Space Agency. He has also been a visiting Fellow at the University of Ghent, Belgium, after receiving a Flemish Research Council award. Currently he is a Research Associate in the Hamlyn Centre for Robotic Surgery, in the Institute of Global Health and Innovation. His current research focuses on miniaturised optical systems for imaging and sensing.
Ananda Ekaputera Sidarta received his B.Eng in Electronics and Electrical Engineering (2004) and M.Sc. in Biomedical Engineering (2009) from the Nanyang Technological University (NTU), Singapore. He has 4 years industrial experiences in the area of test development engineering prior to this, serving big customers such as Philips Electronics and ST Electronics-InfoComm. He then worked as a research staff in NTU from 2008 to 2009. He is currently working as a research associate in the area of stroke rehabilitation in NTU. His research interests include sensing systems, instrumentation, and embedded system.
Cameron N. Riviere received the BS degree in aerospace engineering and ocean engineering from the Virginia Polytechnic Institute and State University, Blacksburg, in 1989 and the PhD degree in mechanical engineering from The Johns Hopkins University, Baltimore, MD, in 1995. Since 1995, he has been with the Robotics Institute at Carnegie Mellon University, Pittsburgh, PA, where he is presently an Associate Research Professor and the Director of the Medical Instrumentation Laboratory. He is also an adjunct faculty member of the Department of Rehabilitation Science and Technology at the University of Pittsburgh. His research interests include medical robotics, control systems, signal processing, learning algorithms, and biomedical applications of human-machine interfaces. Dr. Riviere served as one of the guest editors of the Special Issue on Medical Robotics of the journal proceedings of the IEEE in September 2006.
Wei Tech Ang received the BEng and MEng degrees in mechanical and production engineering from the Nanyang Technological University, Singapore, in 1997 and 1999, respectively, and the PhD degree in robotics from Carnegie Mellon University, Pittsburgh, PA, in 2004. He has been an Assistant Professor in the School of Mechanical and Aerospace Engineering, Nanyang Technological University, since 2004. His research interests include sensing and sensor, actuators, medical robotics, rehabilitative and assistive technology, mechanism design, kinematics, signal processing, and learning algorithms.
Footnotes
Publisher's Disclaimer: This is a PDF file of an unedited manuscript that has been accepted for publication. As a service to our customers we are providing this early version of the manuscript. The manuscript will undergo copyediting, typesetting, and review of the resulting proof before it is published in its final citable form. Please note that during the production process errors may be discovered which could affect the content, and all legal disclaimers that apply to the journal pertain.
References
- 1.Charles S. Computer Integrated Surgery: Technology and Clinical Applications. MA: MIT Press; 1996. Dexterity enhancement for surgery; pp. 467–472. [Google Scholar]
- 2.Harwell RC, Ferguson RL. Physiologic tremor and microsurgery. Microsurgery. 1983;4:187–192. doi: 10.1002/micr.1920040310. [DOI] [PubMed] [Google Scholar]
- 3.Schenker PS, et al. Development of a telemanipulator for dexterity enhanced microsurgery. Proc. 2nd Int. Symp. Med. Rob. Comput. Assist. Surg; 1995. [Google Scholar]
- 4.Hotraphinyo L, Riviere CN. Three-dimensional accuracy assessment of eye surgeons. Proc. 23rd Annu. Conf. IEEE Eng. Med. Biol. Soc; Istanbul. 2001. [Google Scholar]
- 5.Tang WN, Han DP. A study of surgical approaches to retinal vascular occlusions. Arch Ophthalmol. 2000;118:138–143. doi: 10.1001/archopht.118.1.138. [DOI] [PubMed] [Google Scholar]
- 6.Das H, Zak H, Johnson J, Crouch J, Frambach D. Evaluation of a telerobotic system to assist surgeons in microsurgery. Computer Aided Surg. 1999;4:15–25. doi: 10.1002/(SICI)1097-0150(1999)4:1<15::AID-IGS2>3.0.CO;2-0. [DOI] [PubMed] [Google Scholar]
- 7.Taylor R, et al. A steady-hand robotic system for microsurgical augmentation. Int J Robot Res. 1999;18:1201–1210. [Google Scholar]
- 8.Ang WT, Riviere CN, Khosla PK. Design and implementation of active error canceling in a hand-held microsurgical instrument. Proc. IEEE/RSJ Intl. Conf. Intell. Robots and Systems; Hawaii. 2001. pp. 1106–1111. [Google Scholar]
- 9.Riviere CN, Ang WT, Khosla PK. Toward active tremor canceling in handheld microsurgical instruments. IEEE Trans on robotics and automation. 2003 Oct;19(5) [Google Scholar]
- 10.Latt WT, Tan U-X, Shee CY, Ang WT. A Compact Hand-held Active Physiological Tremor Compensation Instrument. IEEE/ASME International Conference on Advanced Intelligent Mechatronics; Singapore. Jul 14–17, 2009; pp. 711–716. [Google Scholar]
- 11.Latt WT, Tan U-X, Shee CY, Riviere CN, Ang WT. Compact Sensing Design of a Hand-held Active Tremor Compensation Instrument. IEEE sensors journal. 2009 December 1;9(12):1864–1871. doi: 10.1109/JSEN.2009.2030980. [DOI] [PMC free article] [PubMed] [Google Scholar]
- 12.Riviere CN, Khosla PK. Characteristics of hand motion of eye surgeons. Proc. 19th Annu. Conf. IEEE Eng. Med. Biol. Soc; Chicago. Oct. 30-Nov. 2, 1997. [Google Scholar]
- 13.Walsh EG. Physiological finger tremor in medical students and others. Neurol Dis Ther. 1994;30:63–78. [Google Scholar]
- 14.Simon DA, Jaramaz B, Blackwell M, Morgan F, DiGioia AM, Kischell E, Colgan B, Kanade T. Development and validation of a navigational guidance system for acetabular implant placement. In: Troccaz J, Grimson E, Mösges R, editors. CVRMed-MRCAS’97. Lecture Notes in Computer Science. Vol. 1205 [Google Scholar]
- 15.Northern Digital Inc. Datasheet “NDI Aurora Electronmagnetic Tracking System”. 2007. [Google Scholar]
- 16.Tseng CS, Chung CW, Chen HH, Wang SS, Tseng HM. Development of a robotic navigation system for neurosurgery. In: Westwood JD, Hoffman HE, Robb RA, Stredney D, editors. Medicine Meets Virtual Reality. Studies in Health Technology and Informatics. Vol. 62. IOS Press; Amsterdam: 1999. pp. 358–359. [PubMed] [Google Scholar]
- 17.Sherman KP, Ward JW, Wills DPM, Mohsen AMMA. A portable virtual environment knee arthroscopy training system with objective scoring. In: Westwood JD, Hoffman HE, Robb RA, Stredney D, editors. Medicine Meets Virtual Reality. Studies in Health Technology and Informatics. Vol. 62. IOS Press; Amsterdam: 1999. pp. 335–336. [PubMed] [Google Scholar]
- 18.Polhemus Datasheet. FASTRAK Electromagnetic Tracking System. 2008. [Google Scholar]
- 19.Welch G, Bishop G, Vicci L, Brumback S, Keller K, Colucci D. High-Performance Wide-Area Optical Tracking: The HiBall Tracking System. Presence: Teleoperators and Virtual Environments. 2001 February;10(1):1–21. [Google Scholar]
- 20.Riviere CN, Khosla PK. Microscale Tracking of Surgical Instrument Motion. Proc. 2nd Intl. Conf. on Medical Image Computing and Computer-Assisted Intervention; Cambridge, England. 1999. [Google Scholar]
- 21.Hotraphinyo LF, Riviere CN. Precision Measurement for Microsurgical Instrument Evaluation. Proc. of the 23rd Annu. EMBS International Conference; Istanbul, Turkey. 2001. [Google Scholar]
- 22.Win TL, Tan UX, Shee CY, Ang WT. Design and calibration of an optical micro motion sensing system for micromanipulation tasks; Proc. IEEE International Conference on Robotics and Automation; Roma, Italy. Apr. 2007; pp. 3383–3388. [Google Scholar]
- 23.Ortiz R, Riviere CN. Tracking Rotation and Translation of Laser Microsurgical Instrument. Proc. of the 25th Annu. International Conference of the IEEE EMBS; Caneum, Mexico. 2003. [Google Scholar]
- 24.MacLachlan RA, Riviere CN. Tech report CMU-RI-TR-07–01. Robotics Institute, Carnegie Mellon University; 2007. Optical tracking for performance testing of microsurgical instruments. [Google Scholar]
- 25.MacLachlan RA, Riviere CN. High-Speed Microscale Optical Tracking Using Digital Frequency-Domain Multiplexing. IEEE Transactions on Instrumentation and Measurement. 2009 Jun;58(6) doi: 10.1109/TIM.2008.2006132. [DOI] [PMC free article] [PubMed] [Google Scholar]
- 26.Patkin M. Ergonomics applied to the practice of microsurgery. Aust N Z J Surg. 1977 Jun;47:320–329. doi: 10.1111/j.1445-2197.1977.tb04297.x. [DOI] [PubMed] [Google Scholar]
- 27.Schaefer P, Williams RD, Davis GK, Ross RA. Accuracy of position detection using a position-sensitive detector. IEEE Trans Instrum Meas. 1998 Aug;47:914–919. [Google Scholar]
- 28.Yamamoto K, Yamaguchi S, Terada Y. New Structure of Two-Dimensional Position Sensitive Semiconductor Detector and Application. IEEE Trans on nuclear science. 1985 Feb;NS-32(1) [Google Scholar]
- 29.Chartier G. Introduction to Optics (Advanced Texts in Physics) Springer; 2005. [Google Scholar]
- 30.Funahashi K. On the approximation realization of continuous mapping by neural networks. Neural Networks. 1989;2:183–192. [Google Scholar]
- 31.Fausett LV. Fundamentals of Neural Networks: Architectures, Algorithms and Applications. Prentice-Hall; 1994. pp. 289–330. [Google Scholar]
- 32.Marquardt D. An algorithm for least squares estimation of non-linear parameters. J Soc Ind Appl Math. 1963:43141. [Google Scholar]
- 33.Hagan MT, Menhaj MB. Training feedforward networks with the Marquardt algorithm. IEEE Transactions on Neural Networks. 1994;5(6):989–993. doi: 10.1109/72.329697. [DOI] [PubMed] [Google Scholar]
- 34.Tan UX, Latt WT, Shee CY, Ang WT. A Low-cost Flexure-based Handheld Mechanism for Micromanipulation. IEEE/ASME Trans Mechatronics. 2010 Sep;20(99):1– 5. [Google Scholar]
- 35.Latt WT, Tan UX, Riviere CN, Ang WT. Placement of accelerometers for high sensing resolution in micromanipulation. Sensors and Actuators A-Physical. 2011;167(2):304–316. doi: 10.1016/j.sna.2011.03.001. [DOI] [PMC free article] [PubMed] [Google Scholar]
- 36.Su ELM, Latt WT, Ang WT, Lim TC, Teo CL, Burdet E. Micromanipulation Accuracy in Pointing and Tracing Investigated with a Contact-Free Measurement System. Proc Annual International of the IEEE Engineering in Medicine and Biology Society Conference; Minneapolis, USA. Aug 2009; pp. 3960–3963. [DOI] [PubMed] [Google Scholar]


